Open Cases
The Open Cases section (/open-cases) under Cases serves as the primary operational triage console in PixelView.
It centralizes active, unacknowledged, and triggered alerts ingested from diverse monitoring platforms—such as Prometheus, Alertmanager, Zabbix, and Nagios—as well as manually generated incident reports. Operators use this view to assess incident severity, delegate investigation tasks, trigger self-healing remediations, and track mean time to resolution (MTTR).
Navigating to Open Cases
To access the active incident queue:
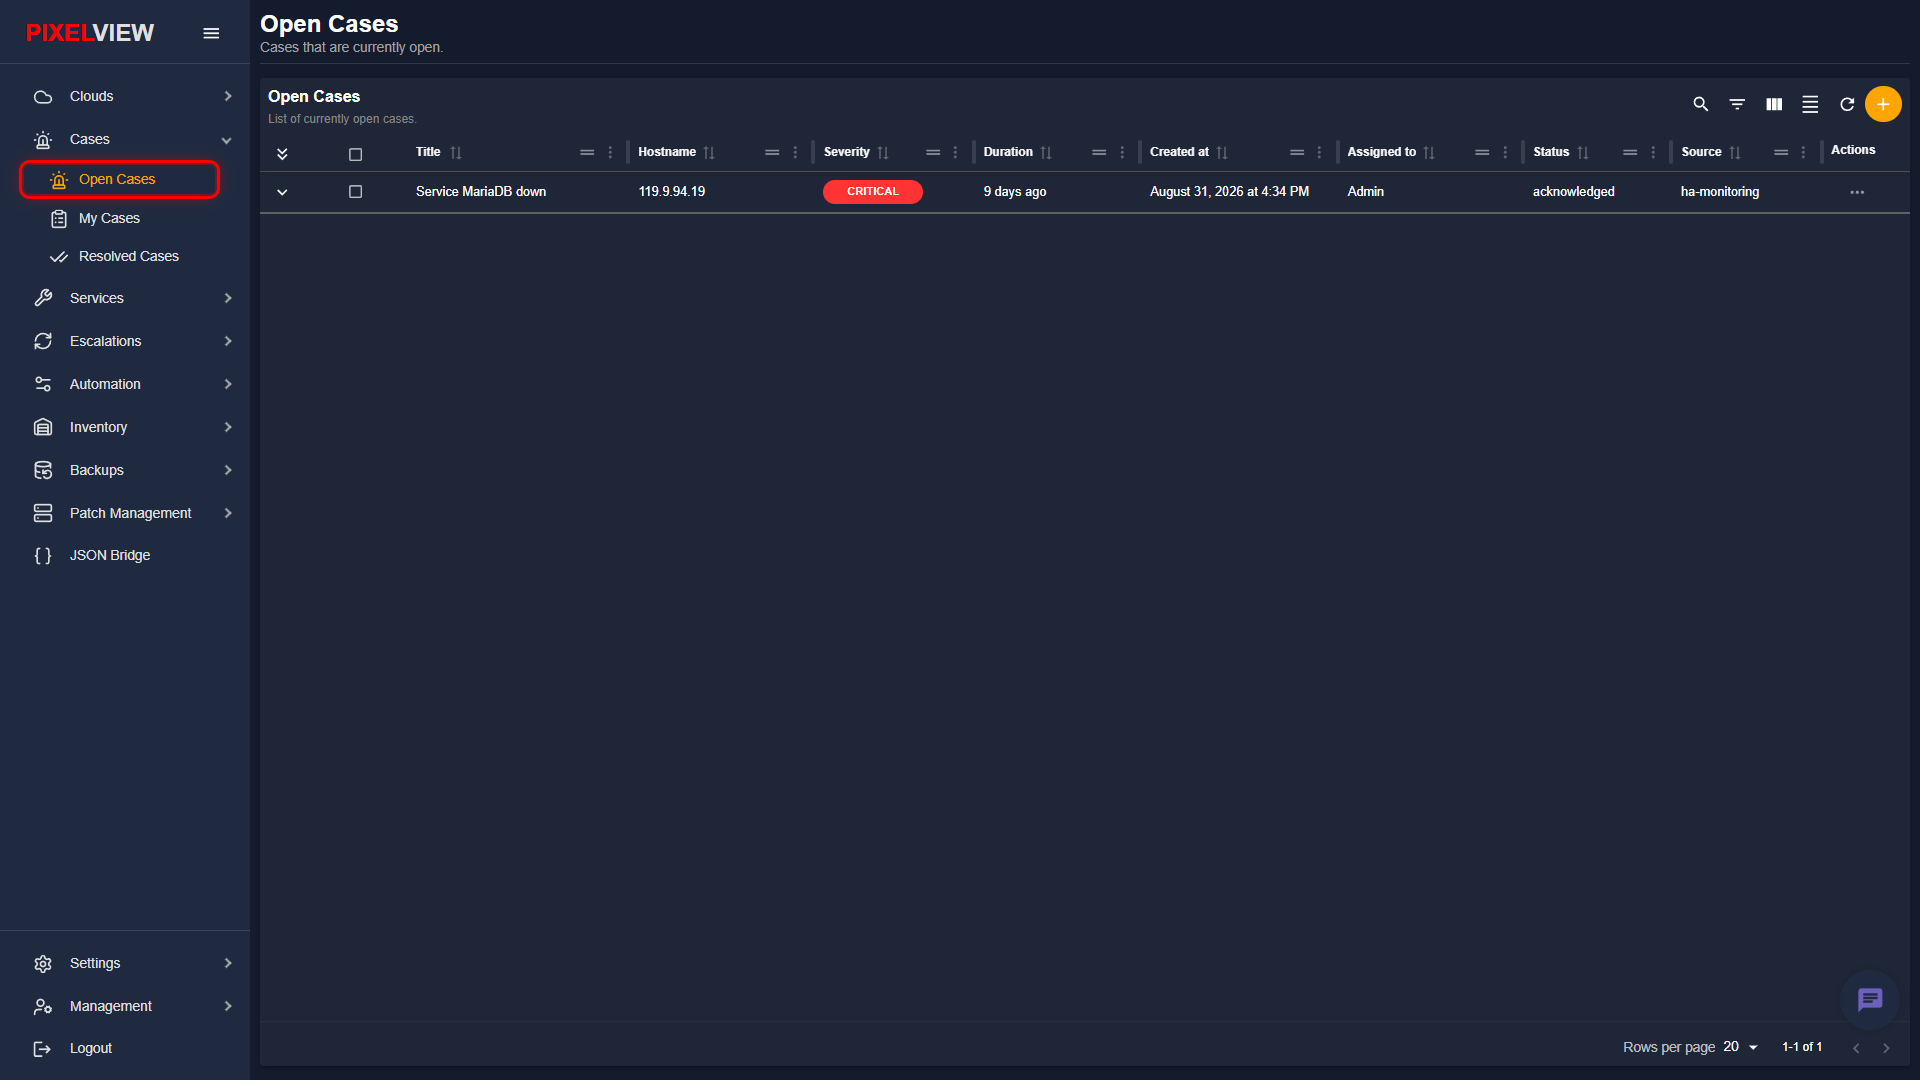
- In the left navigation sidebar, expand Cases and click Open Cases:
Open Cases Table Overview
The main table lists all active and unresolved incidents with real-time state synchronization:
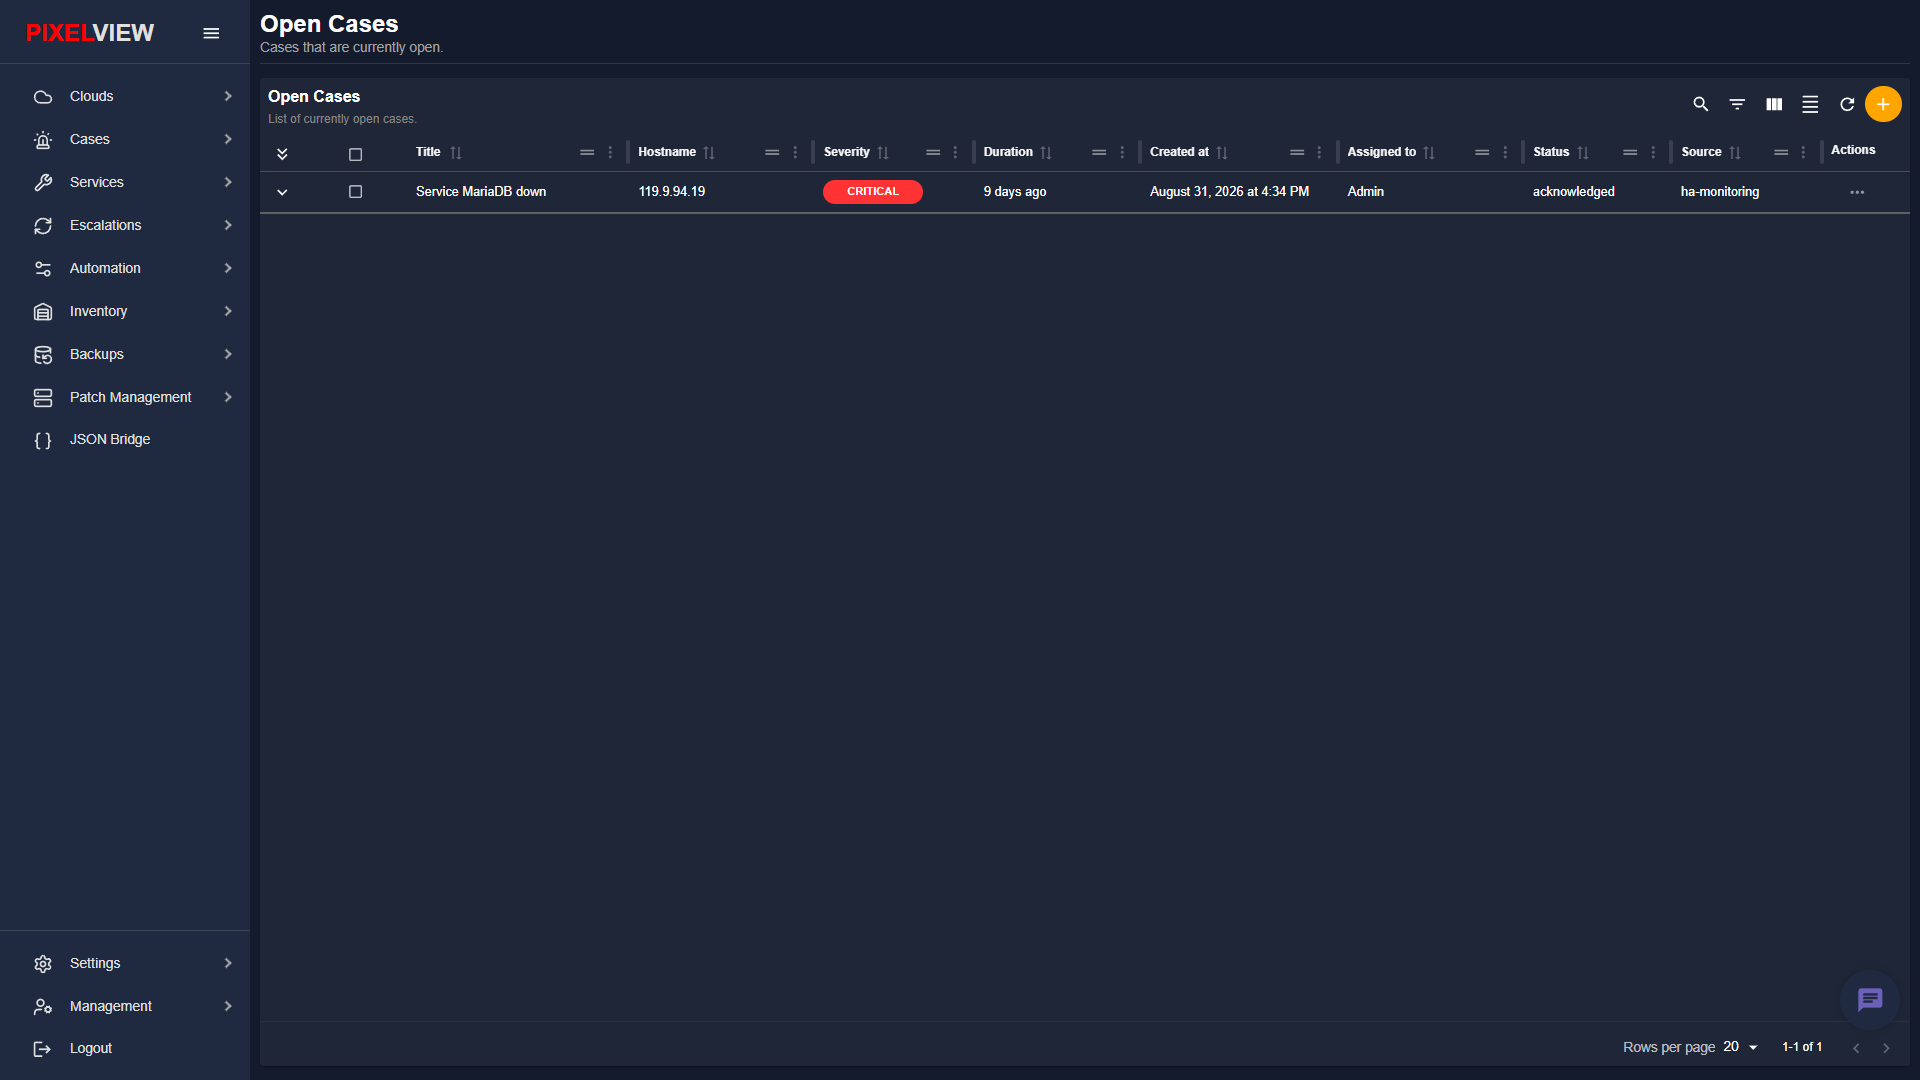
| Column | Description |
|---|---|
Expand (v) |
Chevron toggle that expands the row to access inline comment composition without leaving the table. |
Selection ([ ]) |
Checkbox for selecting cases for batch triage and bulk operations. |
| Title | The alert summary or incident headline (e.g., Service MariaDB down). Clicking the title navigates to the detailed case dashboard. |
| Hostname | Target node IP address or FQDN associated with the alert (e.g., 119.9.94.19). |
| Severity | Impact indicator represented as a colored pill badge (CRITICAL in red, HIGH in orange, MEDIUM in yellow, LOW in blue). |
| Duration | Elapsed time since the alert was first triggered (e.g., 9 days ago). |
| Created at | Absolute timestamp marking alert generation (Month DD, YYYY at HH:MM AM/PM). |
| Assigned to | The current operator or automated bot assigned to remediate the incident (e.g., Admin). |
| Status | Current incident lifecycle stage (triggered, acknowledged, or resolved). |
| Source | Originating monitoring integration or webhook source (e.g., ha-monitoring). |
| Actions | Context action menu (...) providing quick triage shortcuts. |
Table Toolbar Controls
- Search / Global Filter: Perform full-text queries across alert titles, hostnames, sources, and assignees.
- Column Filters: Filter incidents by severity tier, source platform, or creation time range.
- Show/Hide Columns: Customize visible table headers to optimize workspace density.
- Density Toggle: Switch between compact view and spacious layout.
- Refresh: Instantly query the backend API for the latest triggered alerts.
- Add Case (
+): Open the manual case creation dialog.
Batch Triage Operations
When multiple alerts trigger simultaneously (for example, during network partition events or power outages), operators can perform bulk operations across multiple incidents simultaneously.
- Select one or more cases using the checkboxes on the left of each row. The Batch Actions Toolbar automatically appears above the table headers:
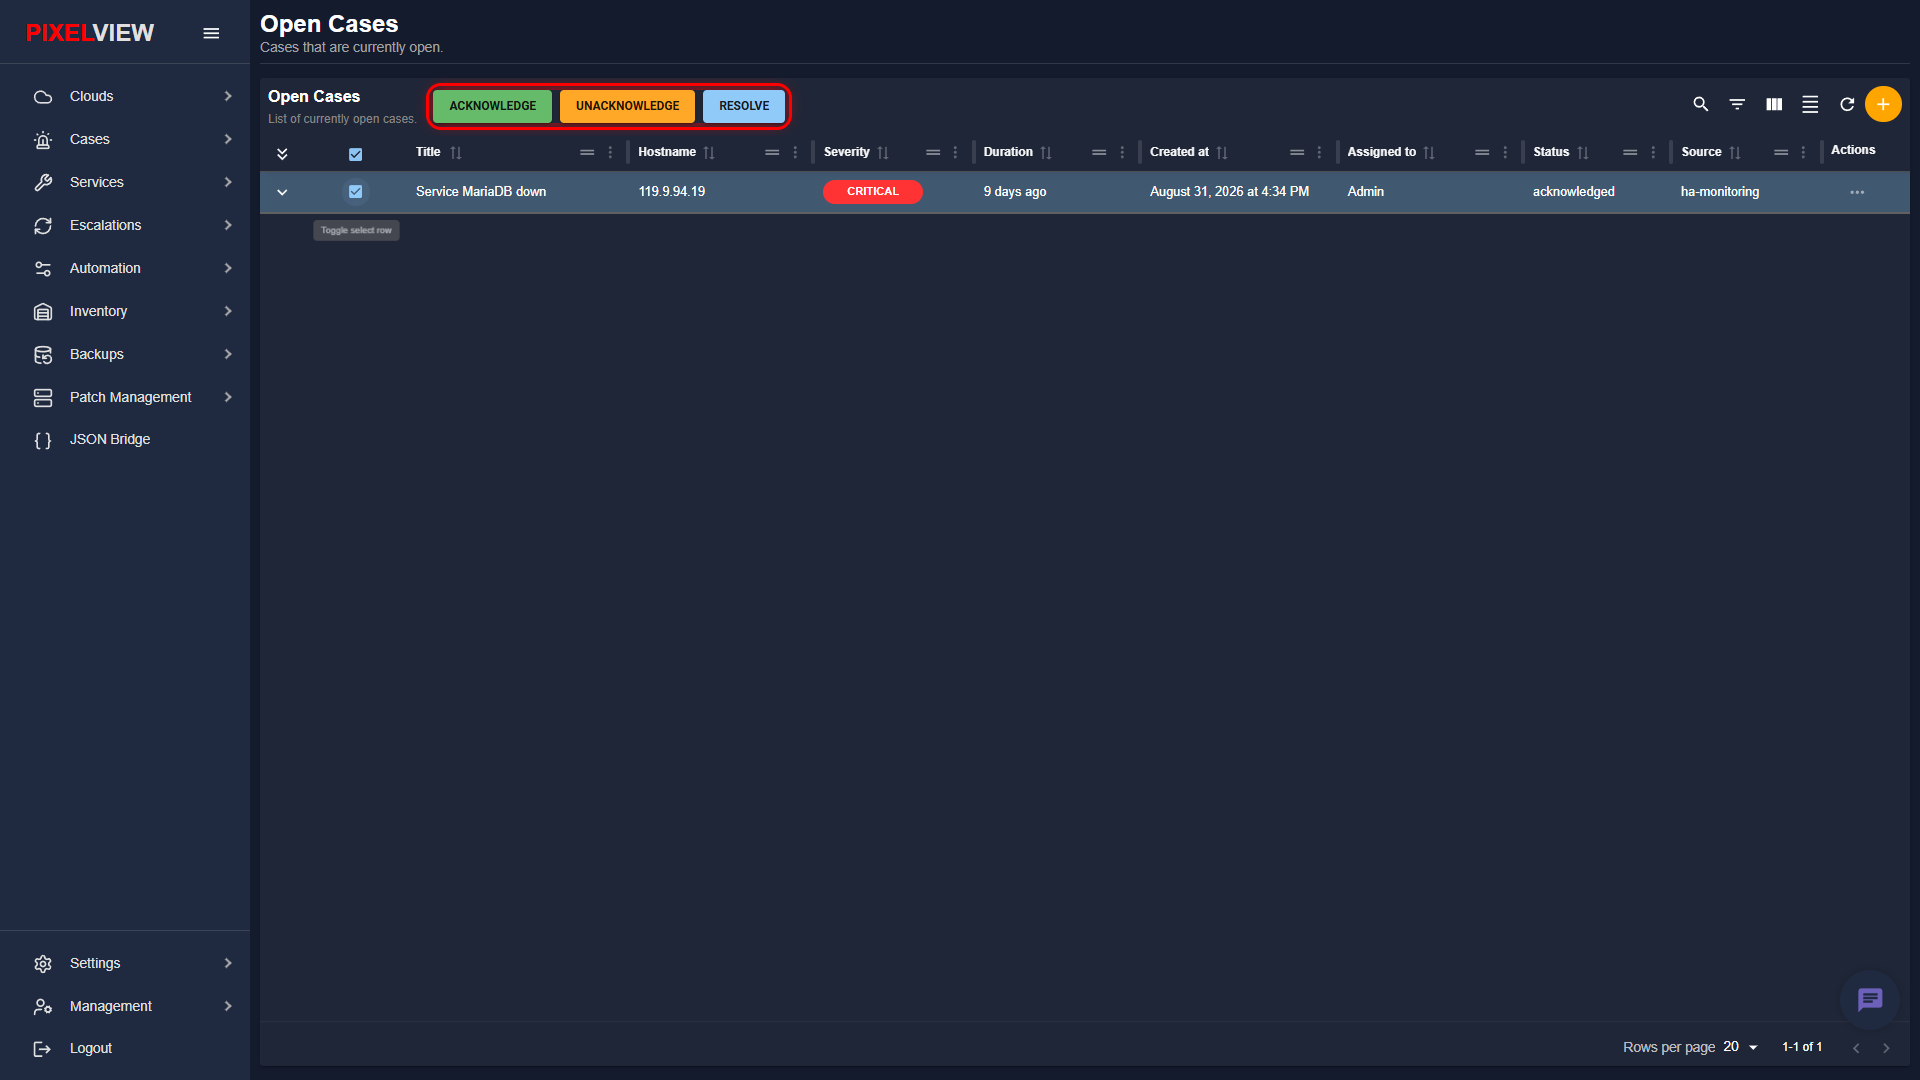
The batch toolbar provides three quick-action commands:
- ACKNOWLEDGE: Signal active operational ownership across all selected incidents simultaneously. This sets the status to acknowledged and halts unacknowledged escalation countdowns.
- UNACKNOWLEDGE: Revert selected cases to unacknowledged, returning them to the unassigned queue for other engineers or automated triage workflows.
- RESOLVE: Conclude all selected incidents at once, moving them from Open Cases directly into Resolved Cases.
Creating a Manual Case
While most cases are ingested automatically via monitoring webhooks, operators can create ad-hoc cases for unscheduled outages, customer-reported issues, or planned maintenance:
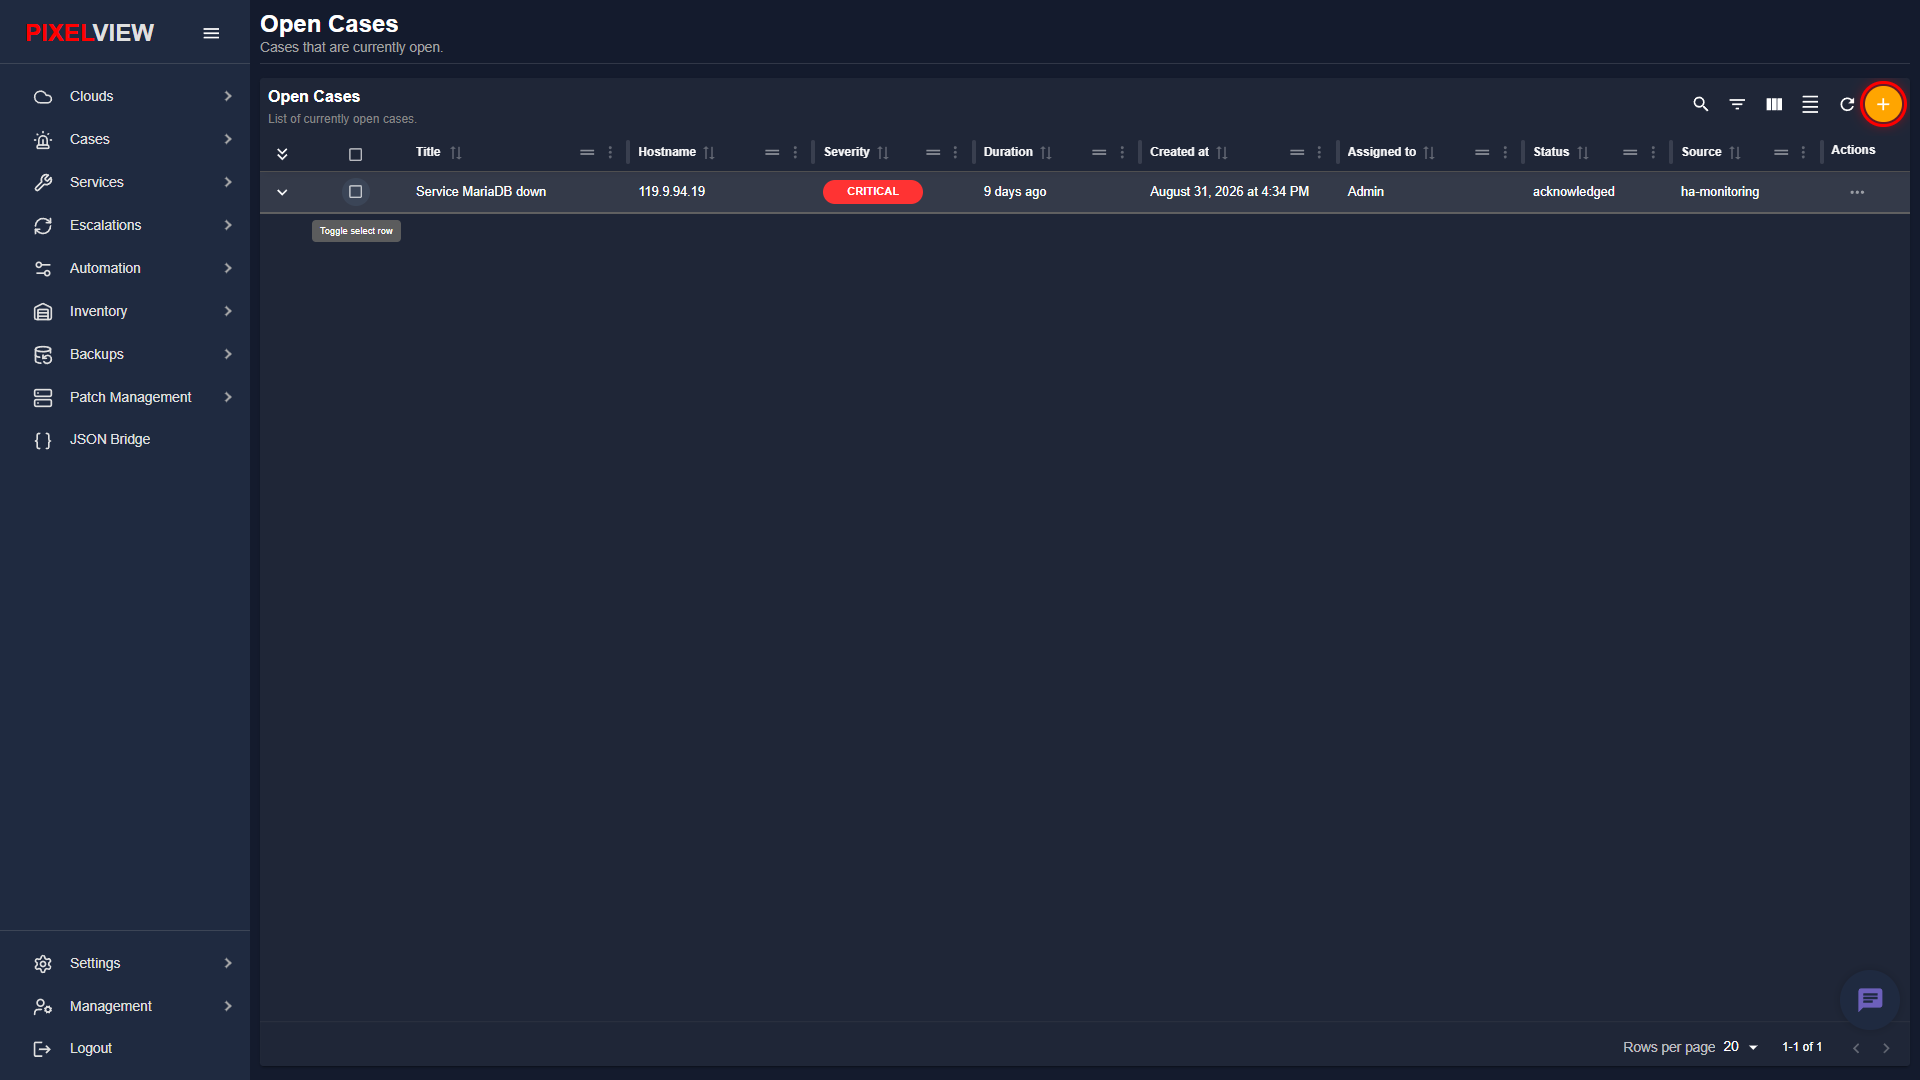
- Click the orange
+(Add Case) button in the top-right table toolbar:
- The New Case modal dialog will open:
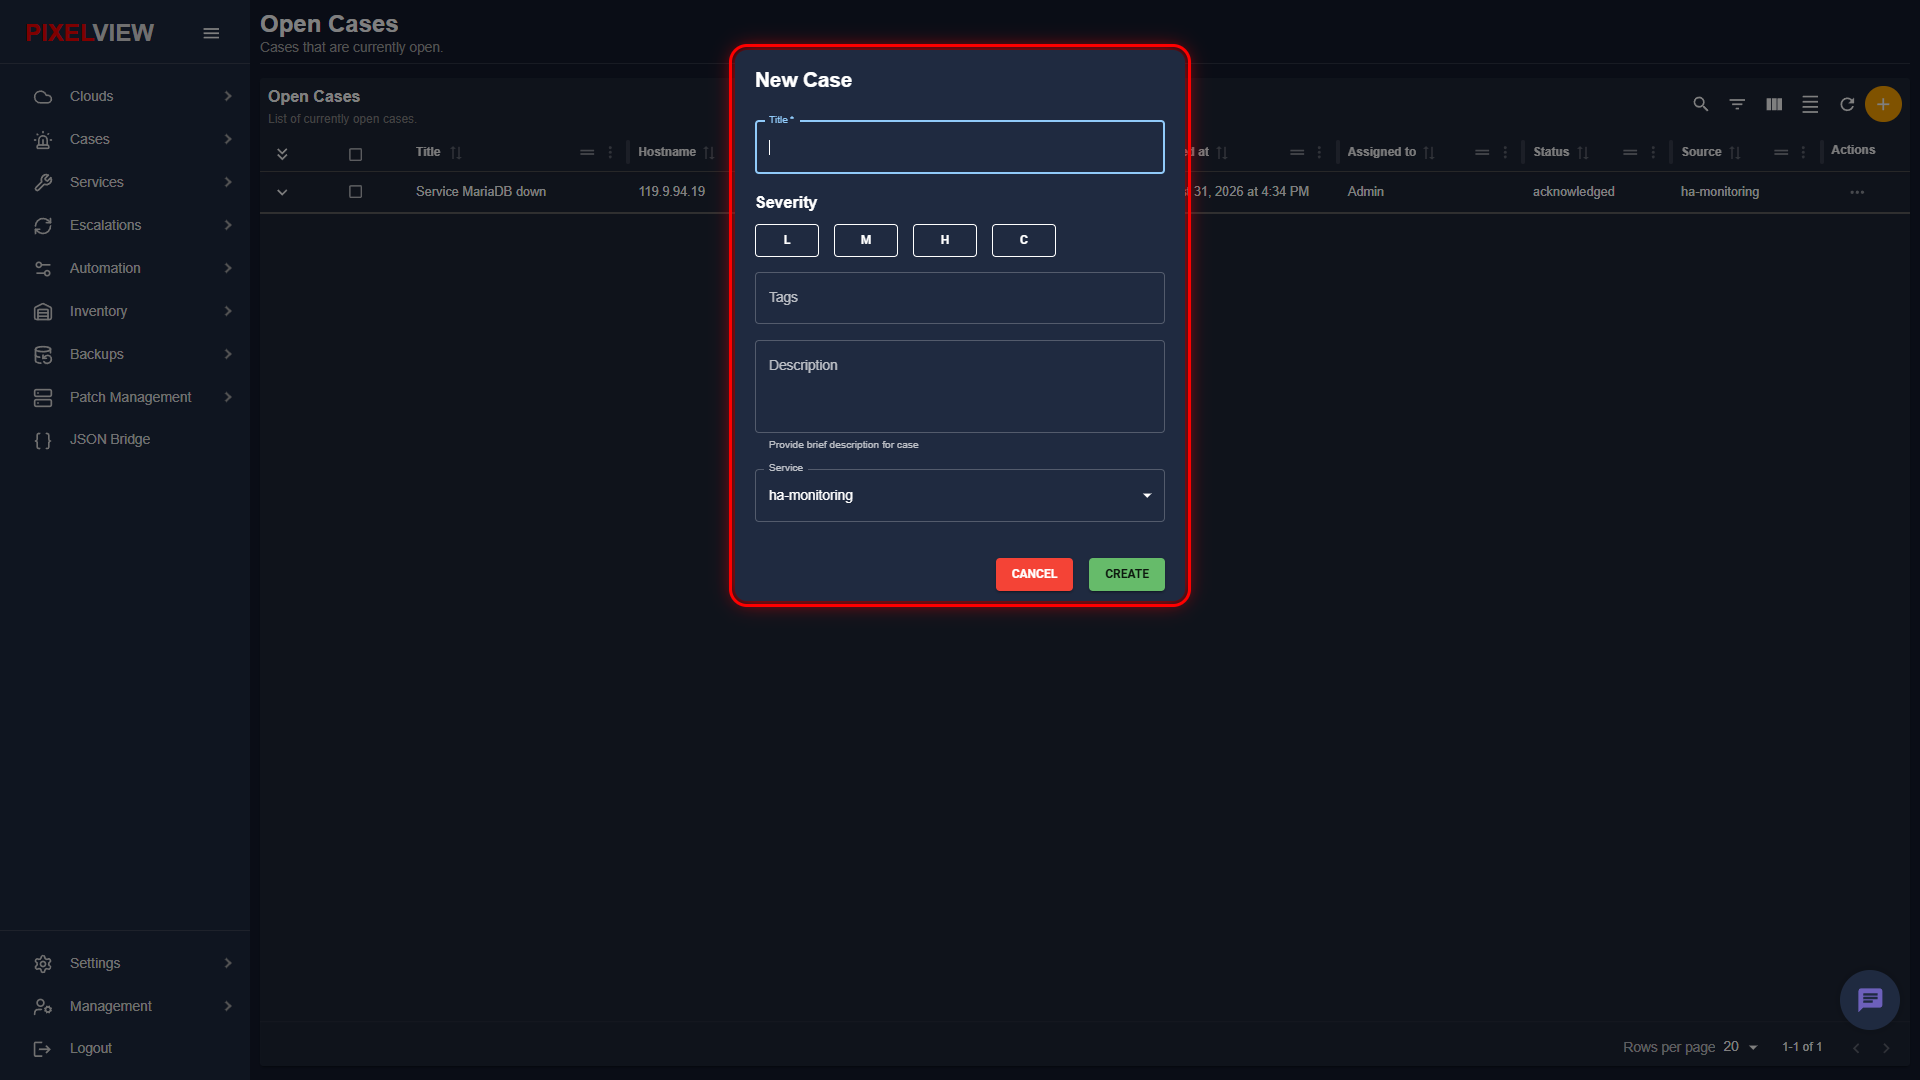
Configuration Fields
- Title (Required): Enter a concise, descriptive title for the incident (e.g.,
Database Cluster Failover). - Severity (Required): Select the operational severity tier:
- Low: Minor operational anomaly or routine telemetry deviation.
- Moderate: Partial degradation, single node redundancy loss, or threshold warning.
- High: Major service disruption impacting multiple users.
- Critical: Total service outage, catastrophic failure, or database unavailability.
- Tags: Add one or more taxonomy tags to help filter and correlate related incidents.
- Description: Provide contextual investigation details, symptoms, impacted customer services, or initial diagnostic steps.
- Service: Select the target monitoring service or environment from the dropdown (e.g.,
ha-monitoring).
Dialog Actions
- CANCEL: Abort case creation and close the modal.
- CREATE: Persist the case and publish it to the Open Cases queue.
Incident Aggregation & Multi-Dimensional Filtering
During high-volume incident storms (such as network flapping or datacenter power events), operators can collapse hundreds of incoming alerts into coherent functional clusters:
- Aggregation Modes: In the table controls, operators can aggregate cases dynamically by:
- Hostname: Consolidates all alerts firing against a specific server or hypervisor node into a single grouped expandable row.
- Service Name: Groups all cases originating from a shared monitoring integration or application service tier (e.g.,
Prometheus-Ingress,ha-monitoring). - Status: Segregates active
triggeredalerts from currentlyacknowledgeditems under active investigation. - Severity: Clusters alerts by criticality level (Critical, High, Moderate, Low).
- Targeted Filtering: The filter modal allows scoping the queue by specific hostnames, services, peak severity, and custom metadata tags.
Table Actions & Inline Quick Comments
Operators can manage incidents directly from the table without navigating away:
Row Context Menu
- Click the Actions menu (
...) on any case row:
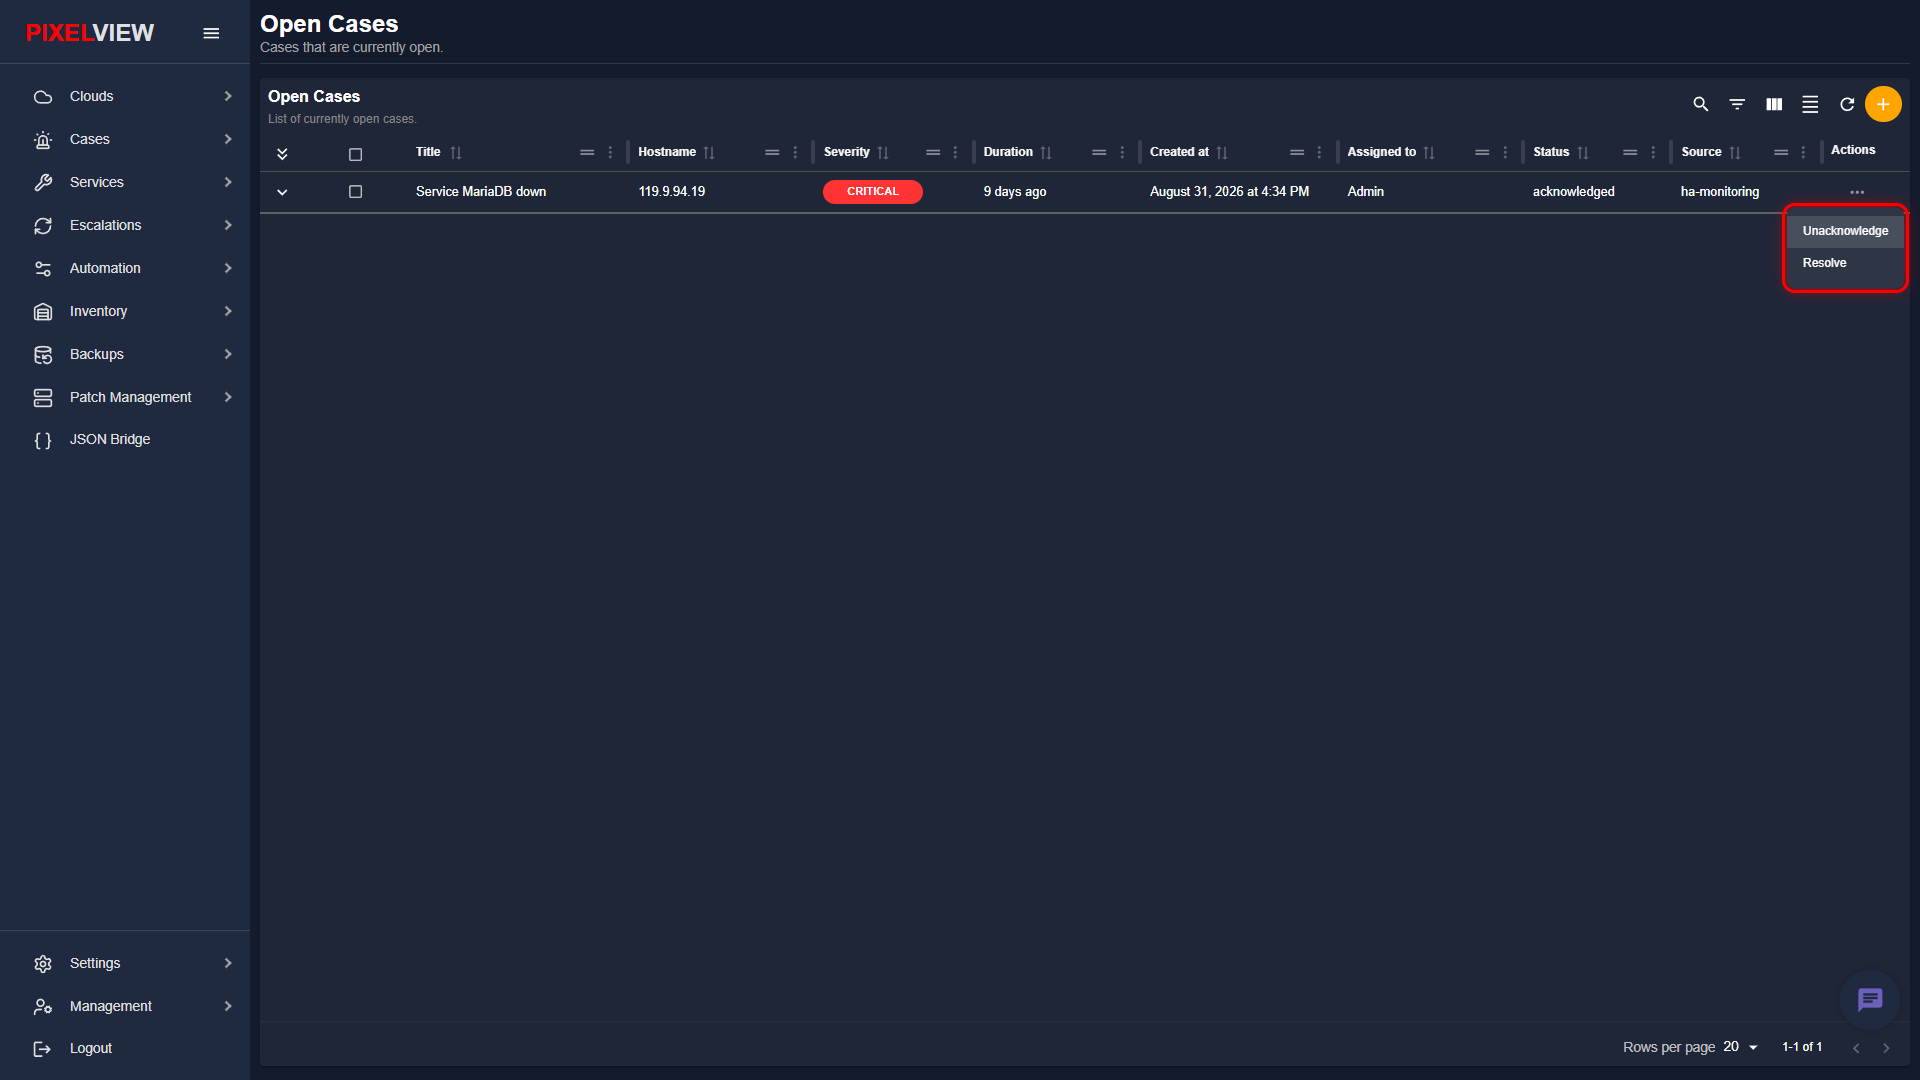
- Acknowledge: Transition the case status to acknowledged, notifying the team that an engineer is actively addressing the alert.
- Resolve: Mark the underlying incident as fixed, automatically moving the case from Open Cases to Resolved Cases.
Inline Row Expansion & Quick Comments
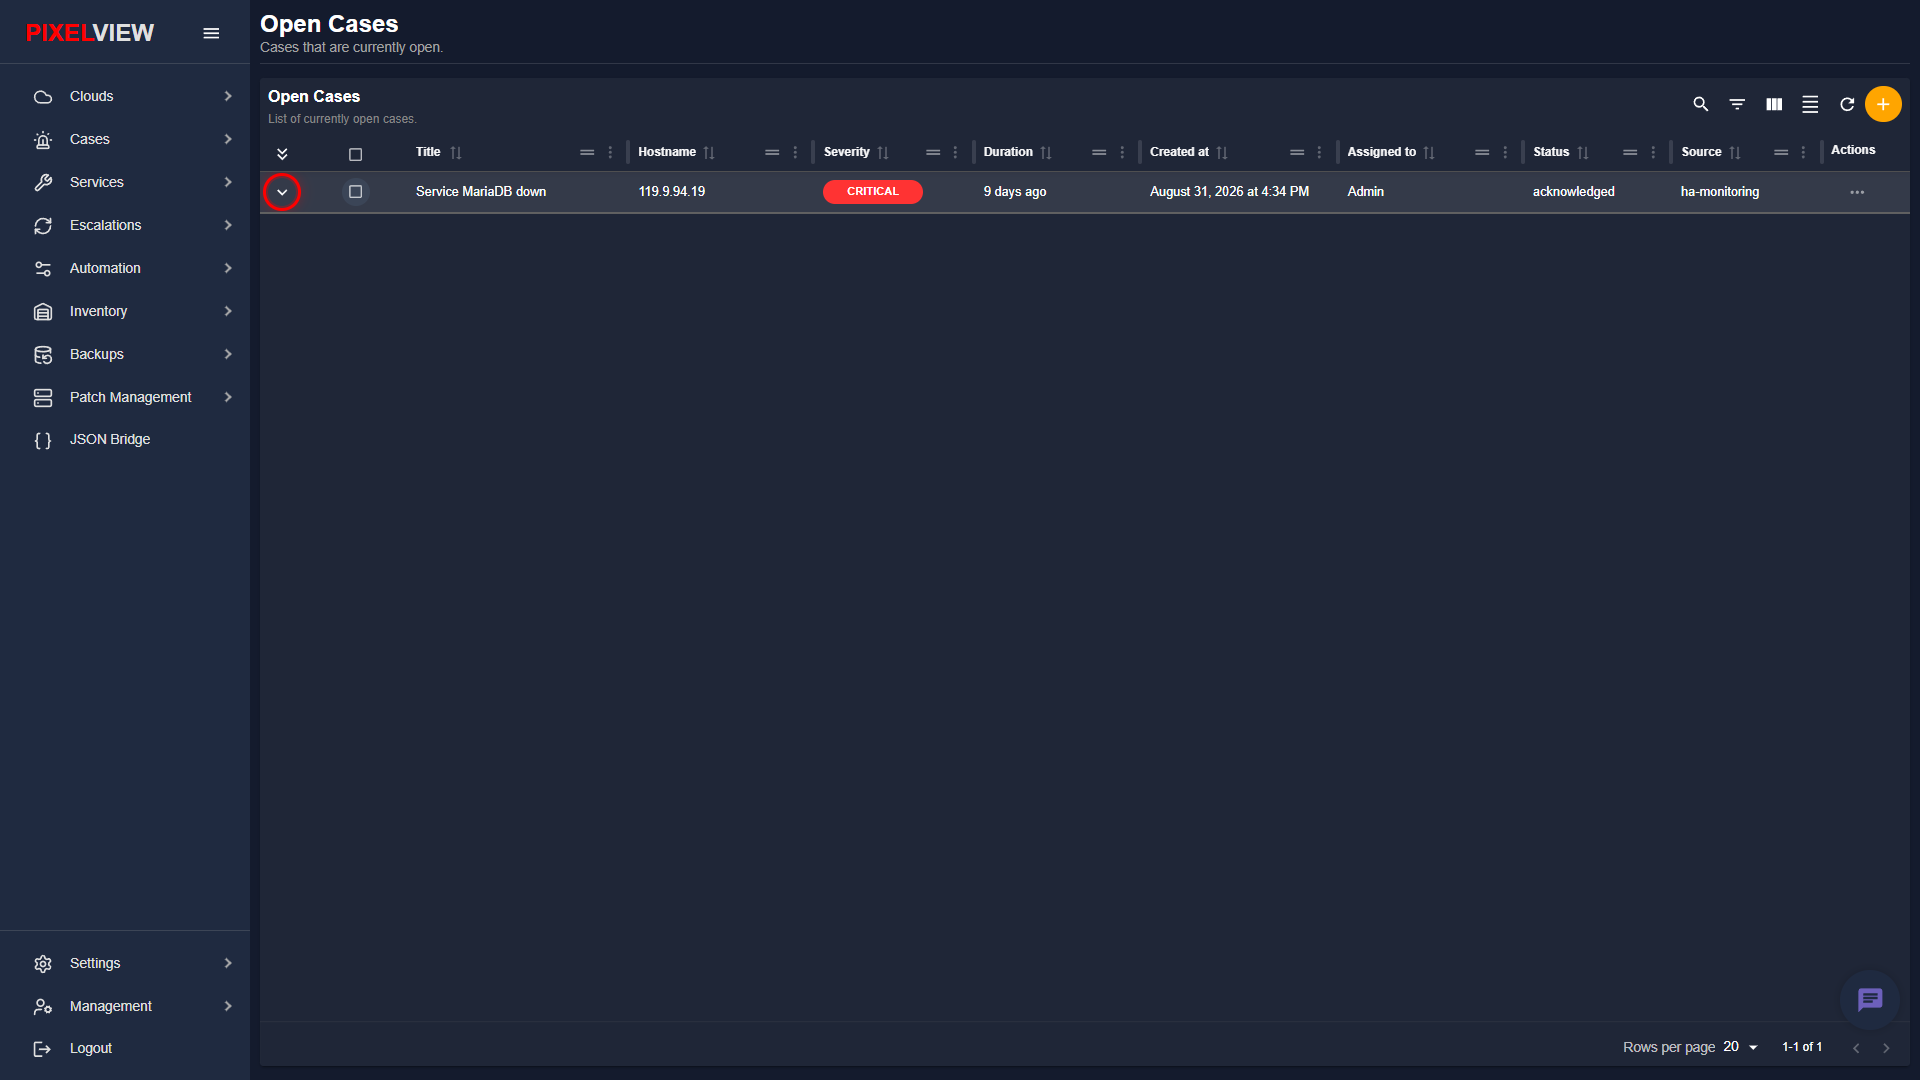
- Click the expand chevron (
v) next to any case:
- The row expands inline to expose a quick-reply comment interface:
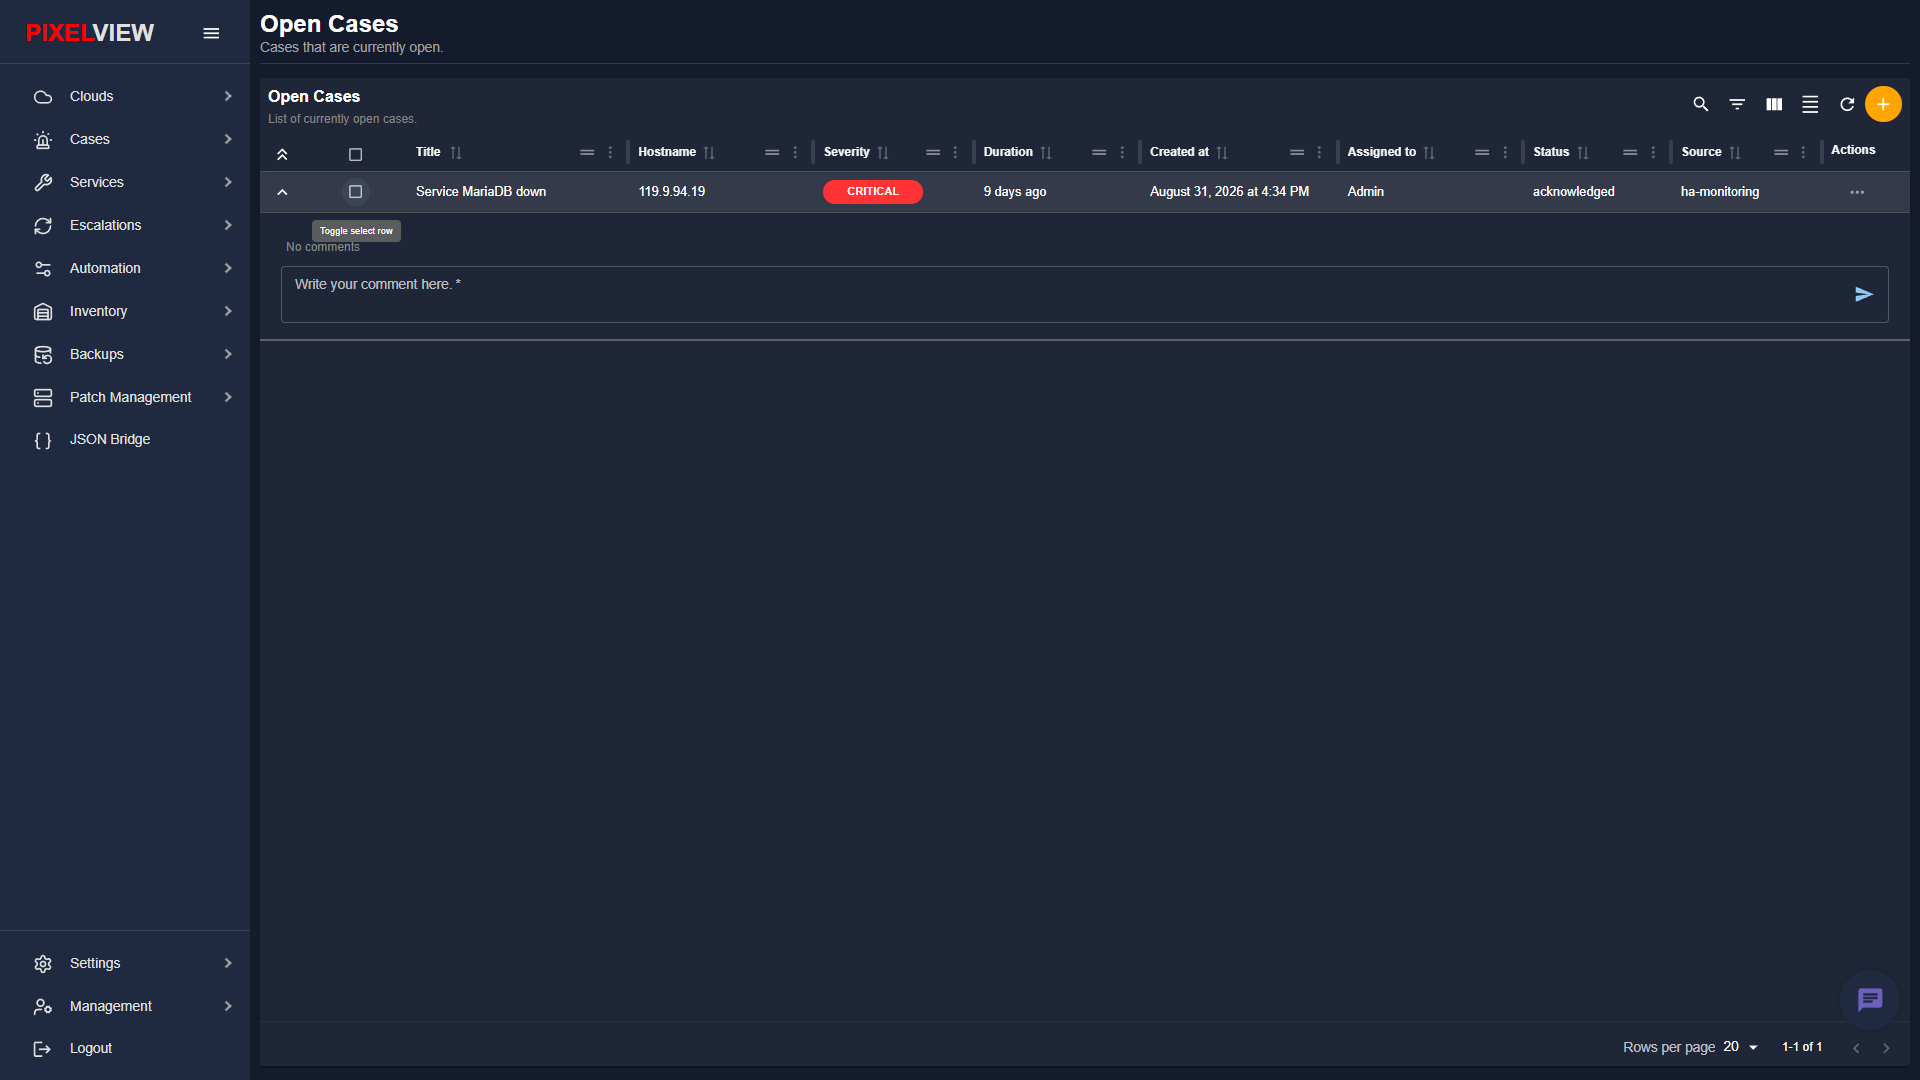
- Type your message into the comment field (
Write your comment here. *) and click the send icon (>) to log notes directly to the case timeline without leaving the main queue.
Detailed Case Dashboard (/case/:id)
Clicking any case title opens the comprehensive investigation console.
The dashboard header displays the case severity badge, title, creation timestamp, and originating monitoring source. On the top right, engineers can immediately perform triage actions:
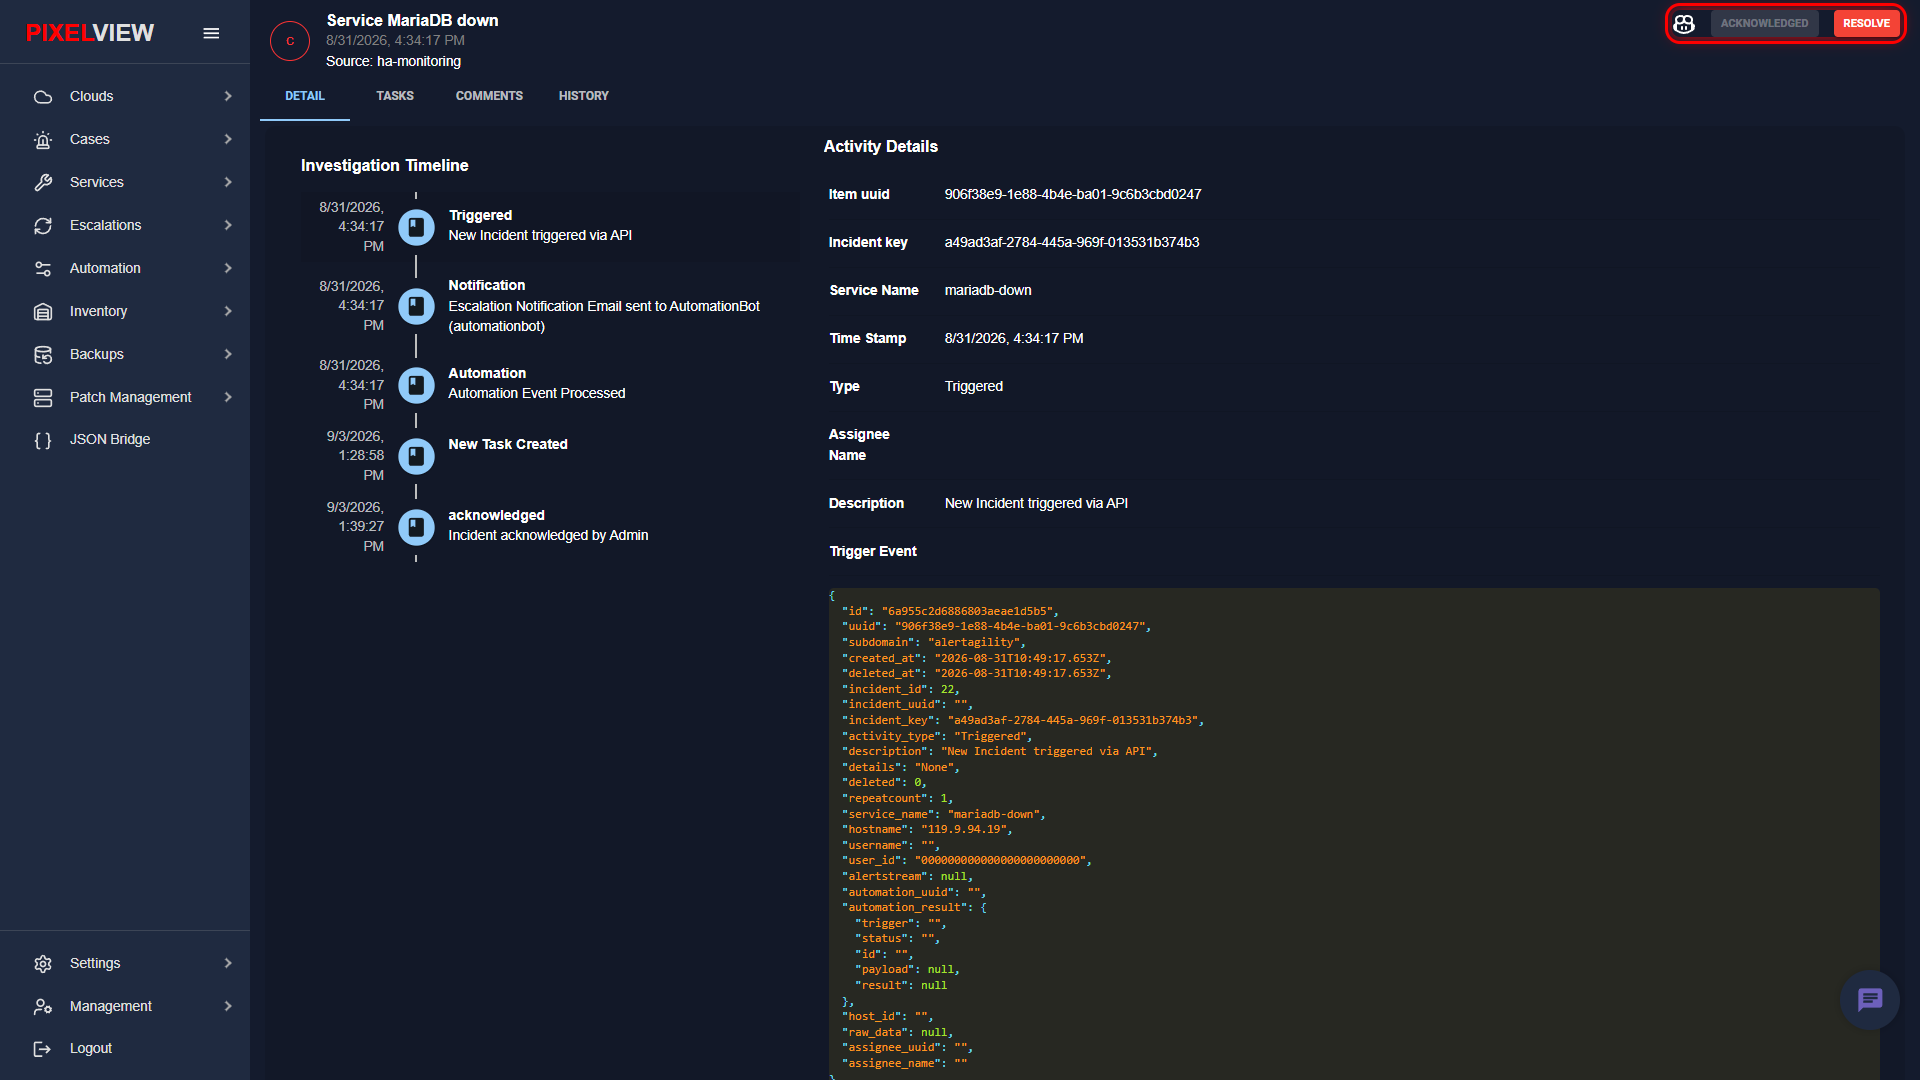
- Team Icon: Inspect team ownership and on-call escalation routing.
- ACKNOWLEDGE / ACKNOWLEDGED: Signal active ownership of the incident.
- RESOLVE: Conclude the incident and log the final resolution timestamp.
The investigation console is organized into four dedicated tabs:
Detail Tab: Investigation Timeline & Telemetry
The DETAIL tab provides a dual-pane analytical breakdown of the incident:
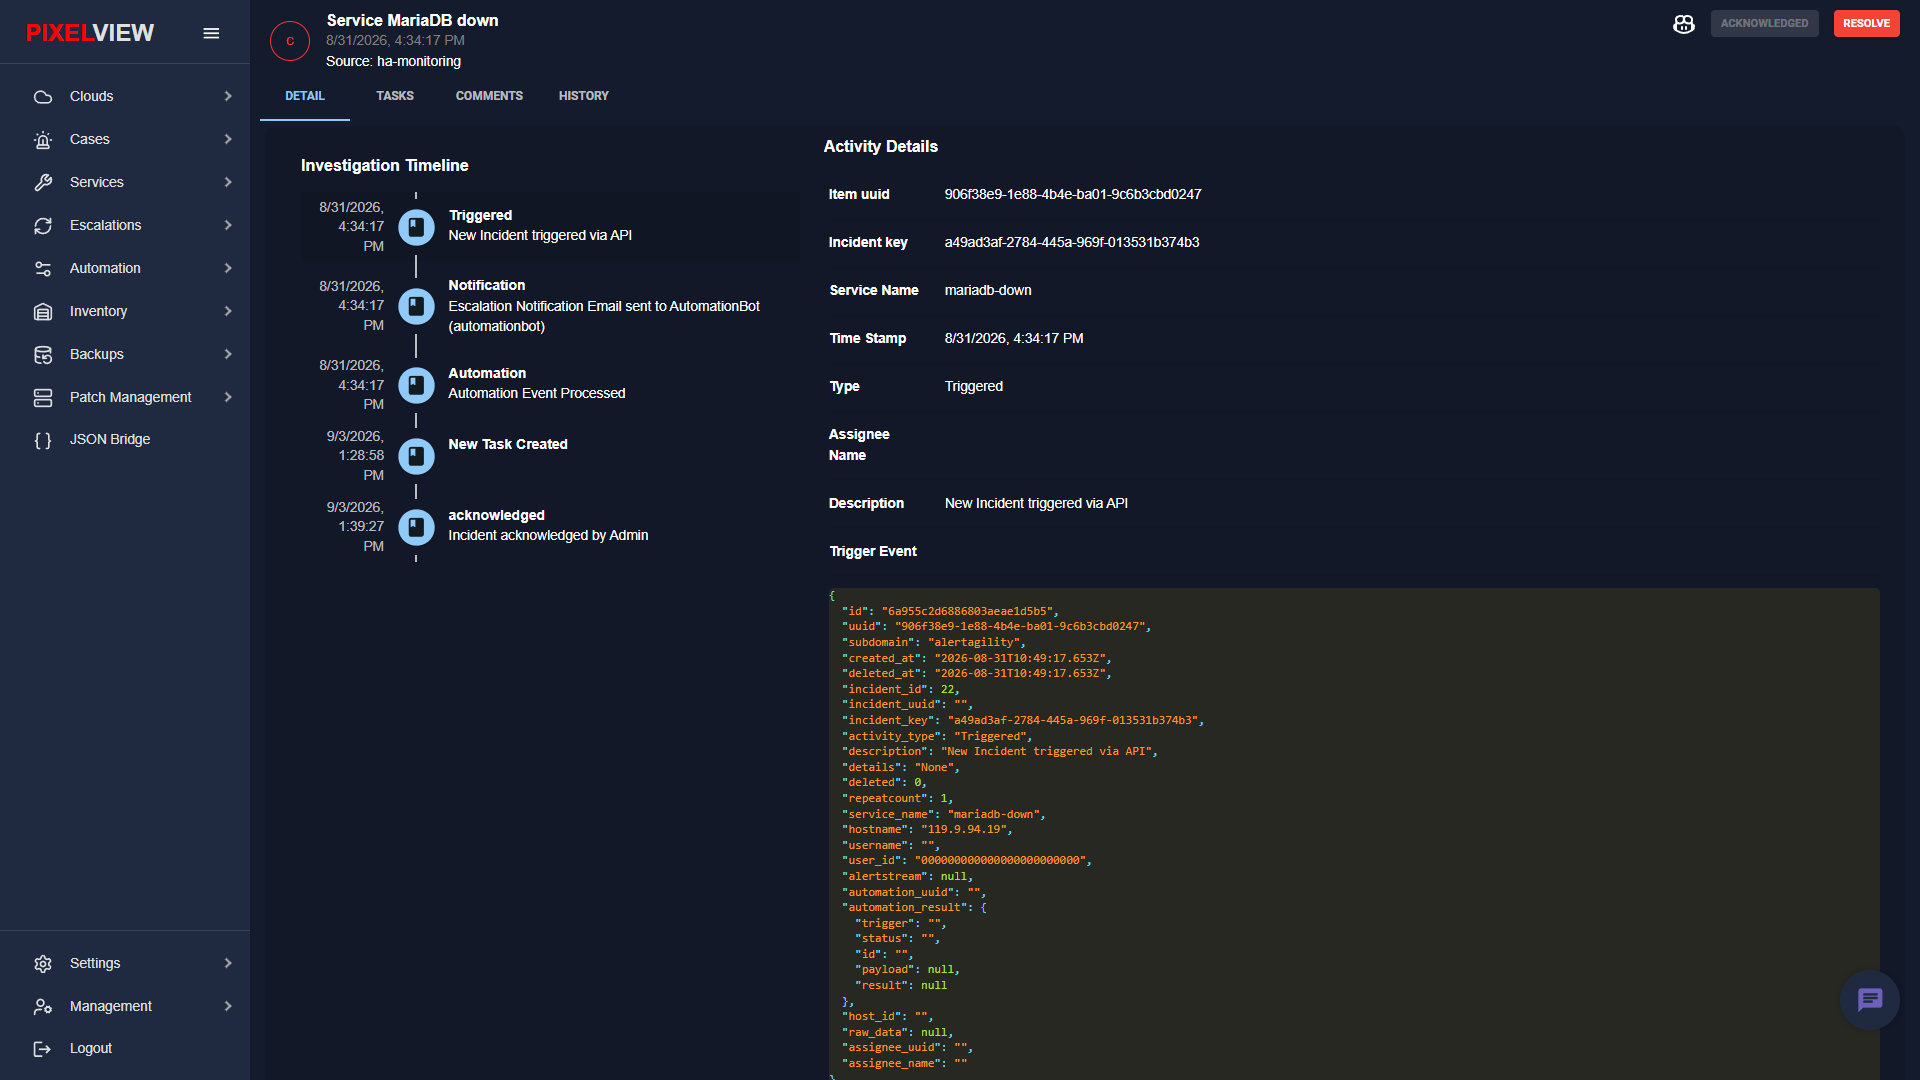
-
Investigation Timeline (Left Pane): A chronological visual audit trail tracking all lifecycle events:
- Triggered: Timestamp when the incident was received via API or webhook.
- Notification: Dispatch logs indicating notifications sent to assignees or escalation bots.
- Automation: Automatic execution logs for triggered self-healing Rules and Workflows.
- New Task Created: Recorded whenever operators delegate sub-tasks.
-
Activity Details (Right Pane): Key operational metadata including Item UUID, Incident Key, target Service Name, Time Stamp, alert Type, Assignee Name, and Description.
-
Trigger Event (Raw JSON Viewer): Full inspection of the inbound monitoring payload, including host variables, trigger condition metrics, repeat counts, and environment subdomains.
Tasks Tab: Action Item Delegation & Management
Complex outages often require delegation across multiple team members (e.g., DBA verification, network checks, rollback authorization). The TASKS tab allows lead responders to break down remediation into structured action items:
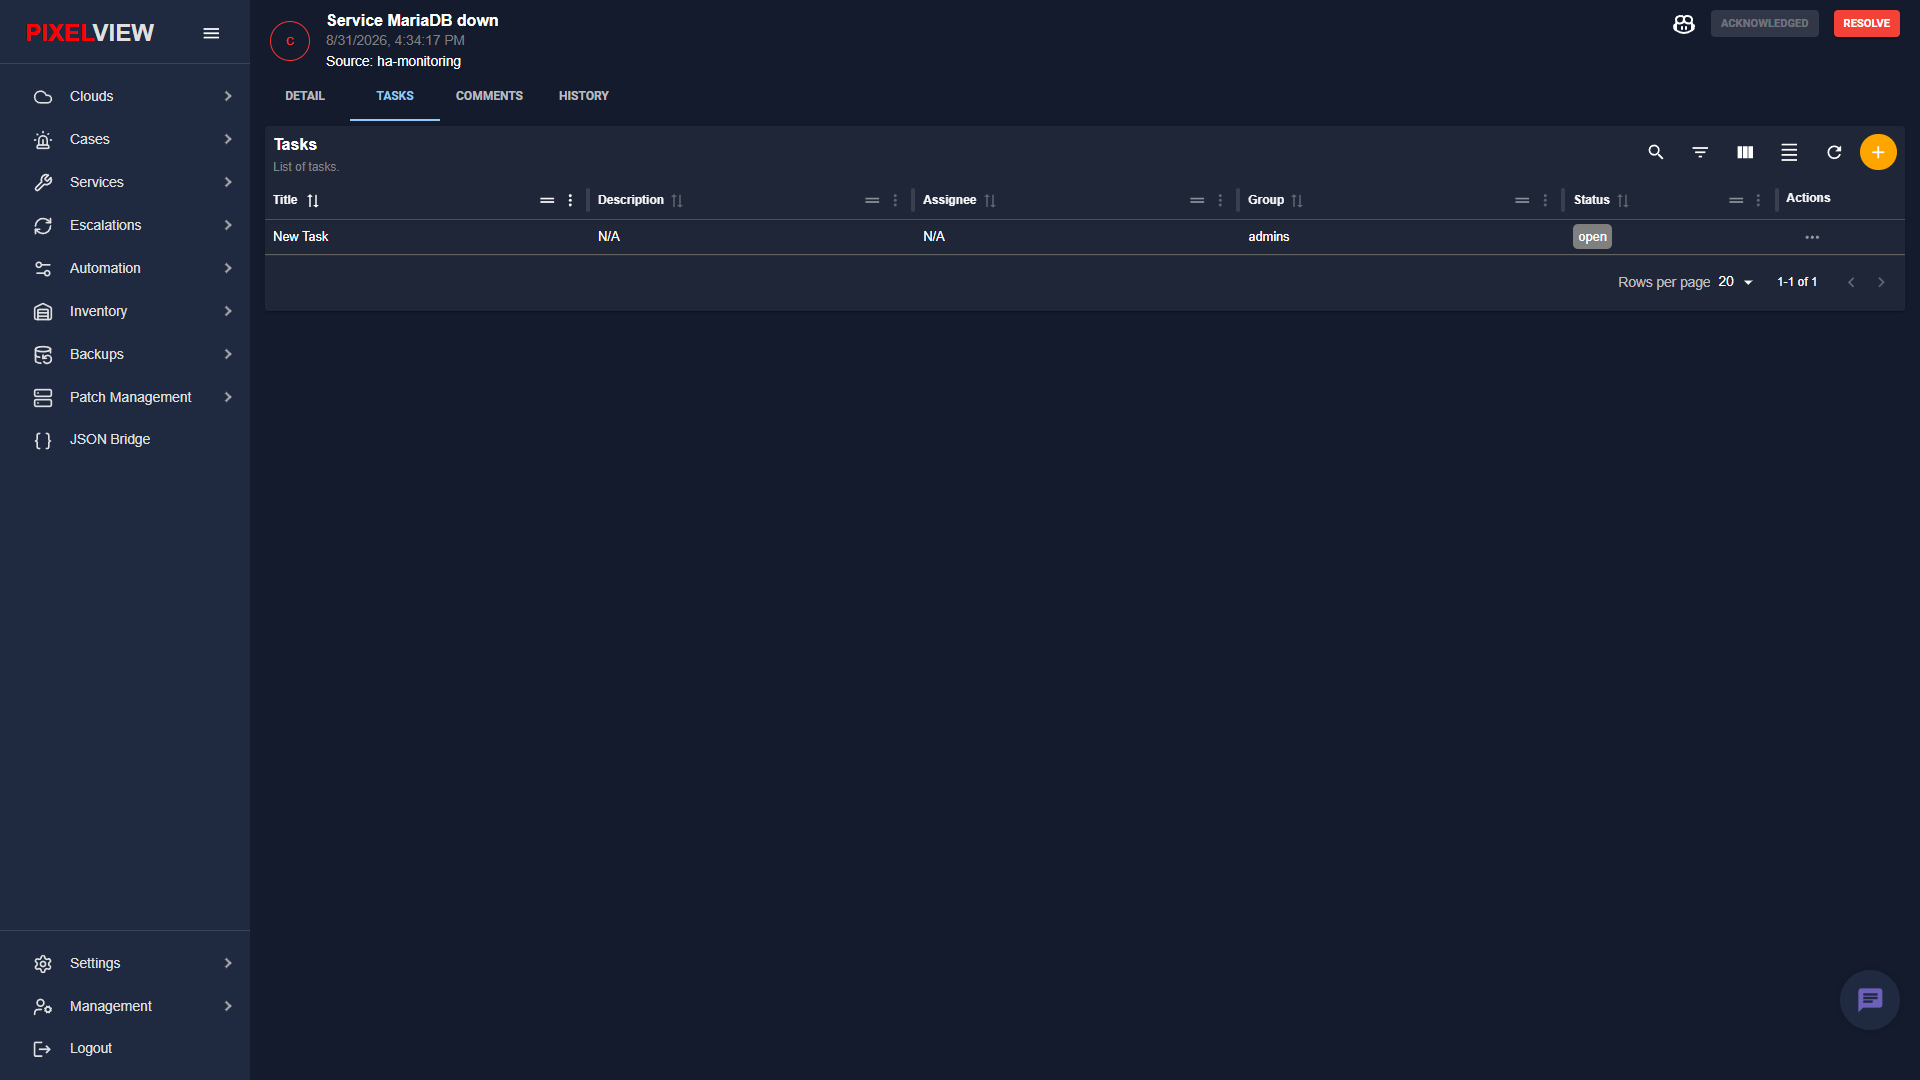
Adding a Sub-Task
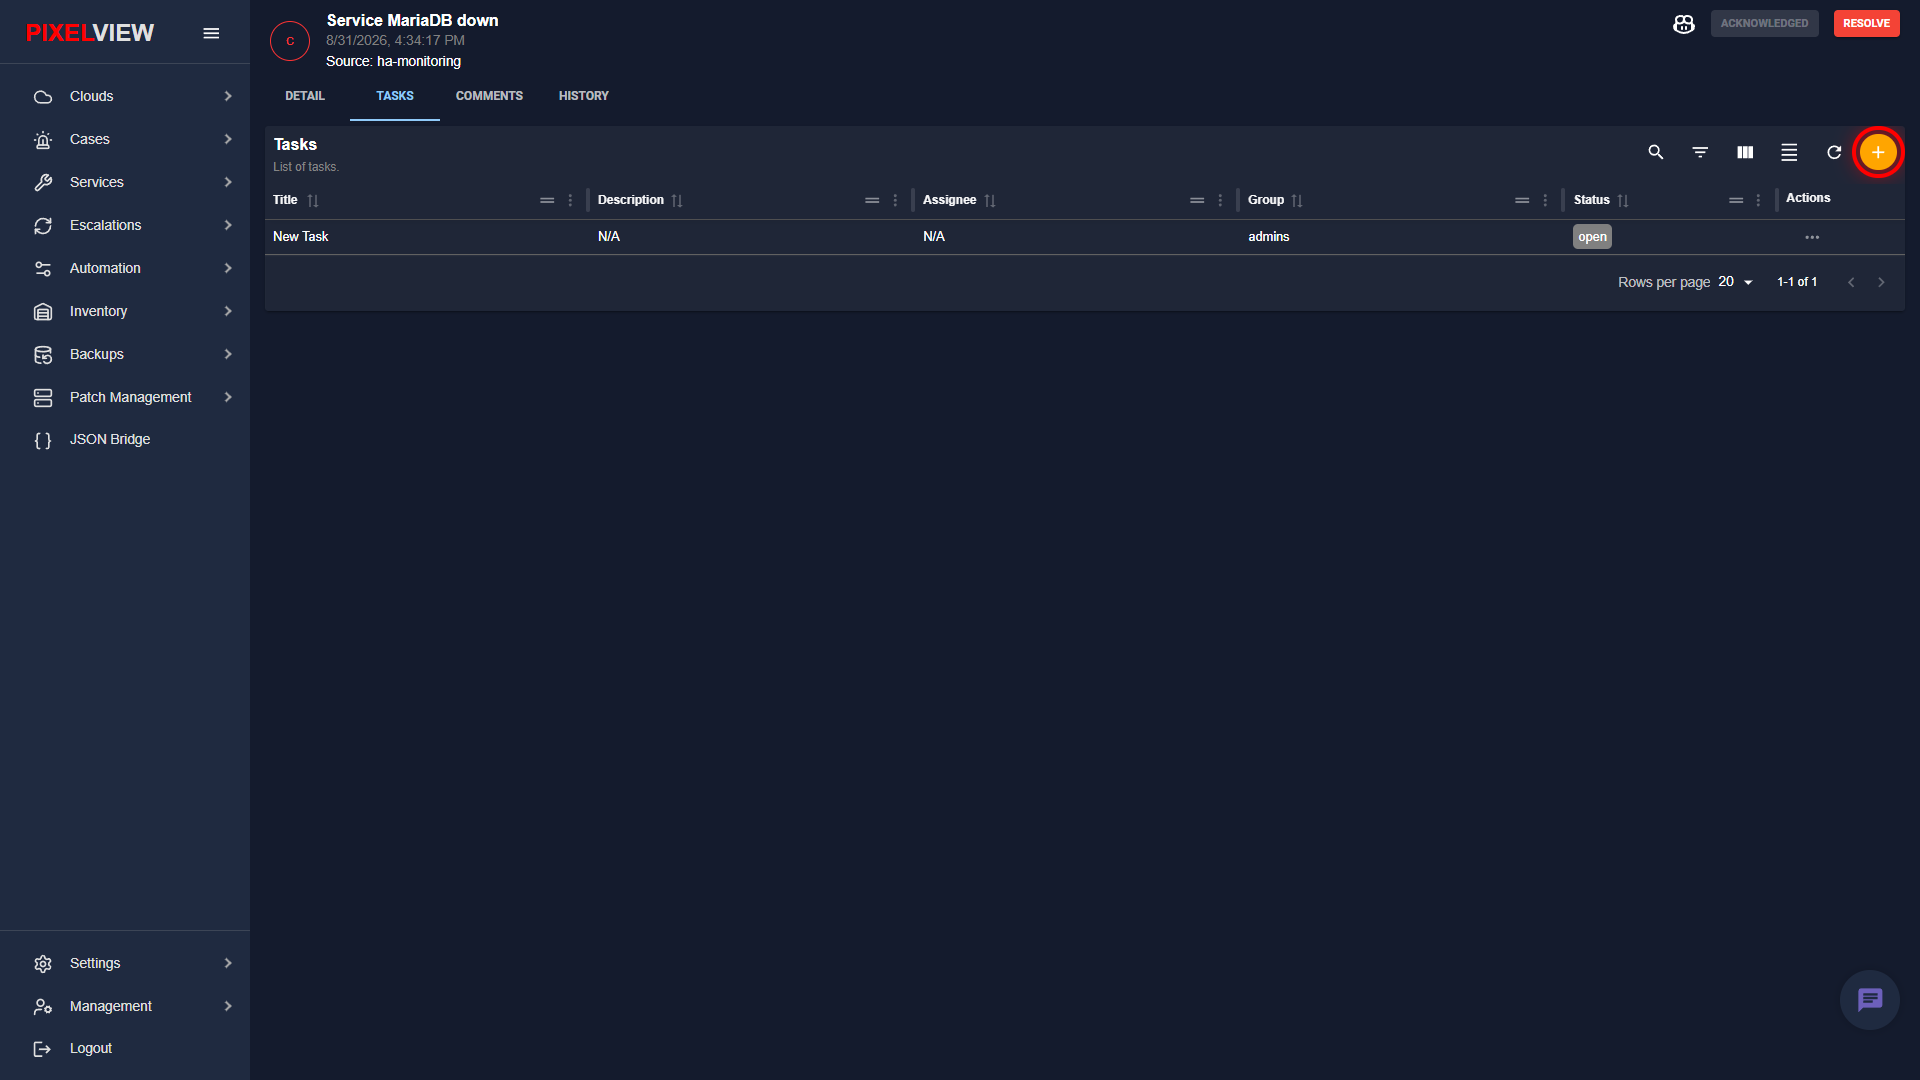
- Click the orange
+(Create task) button on the tasks toolbar:
- The Create Task modal dialog opens:
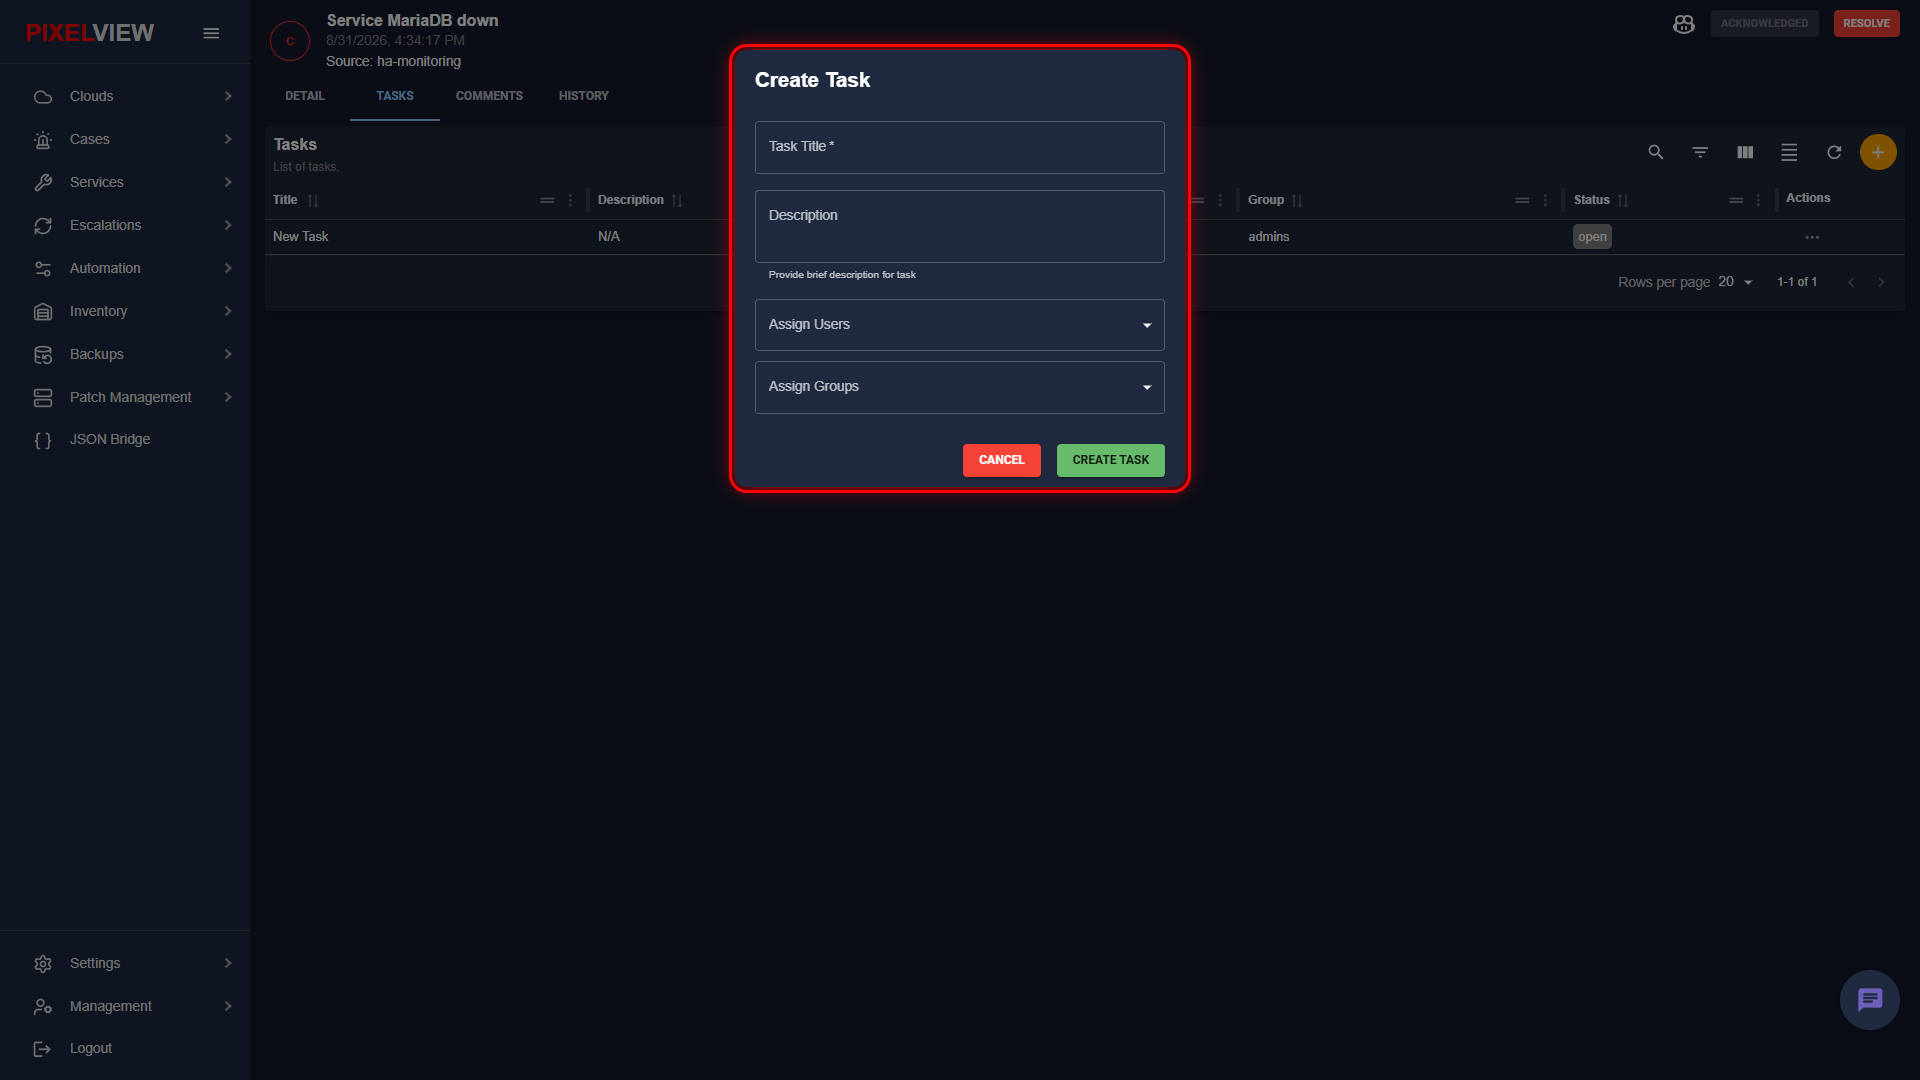
- Task Title (Required): Name of the action item (e.g.,
Restart MariaDB Systemd Service). - Description: Detailed instructions, runbook steps, or command parameters.
- Assign Users: Assign a specific engineer to execute the task.
- Assign Groups: Assign an entire team (e.g.,
admins,dba-team) for collaborative coverage. - Click CREATE TASK to publish the task.
Updating and Editing a Task
- Click the Actions menu (
...) on any task row and select Edit:
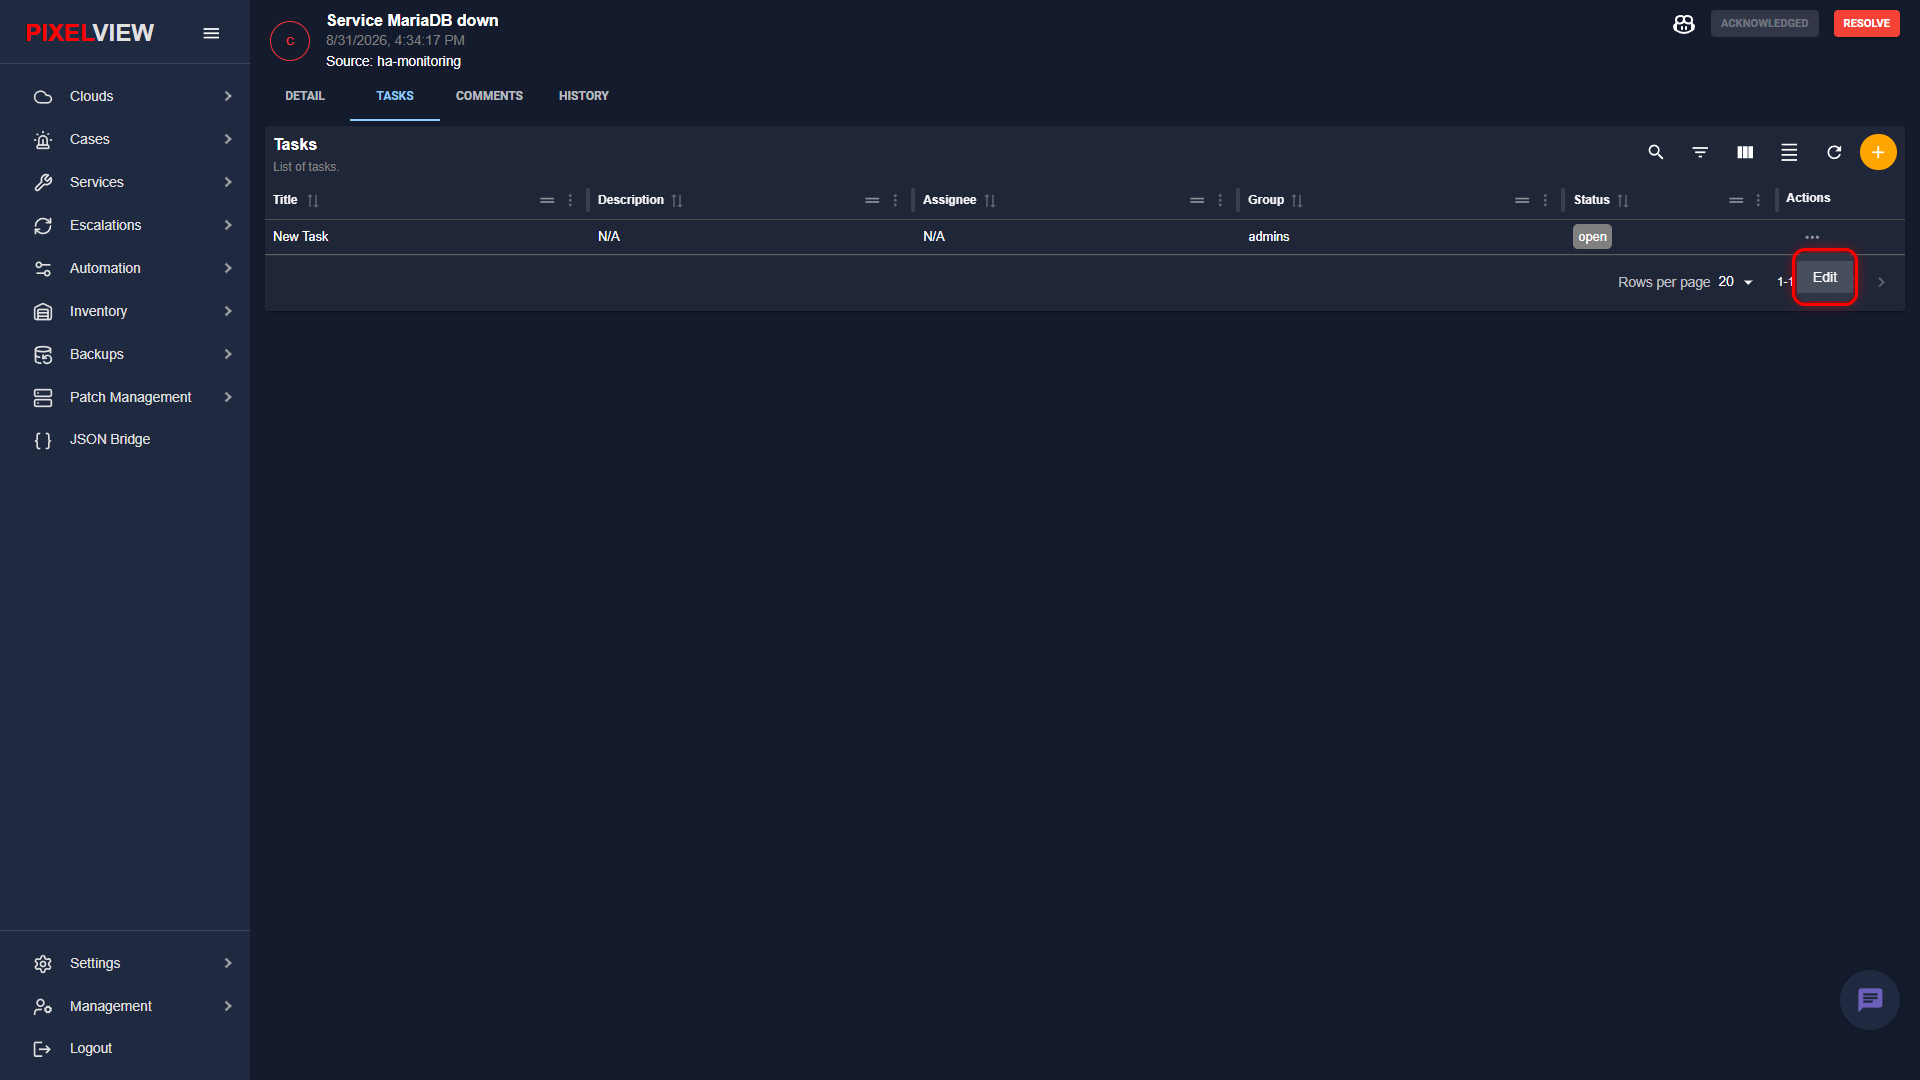
- The Update Task modal dialog opens:
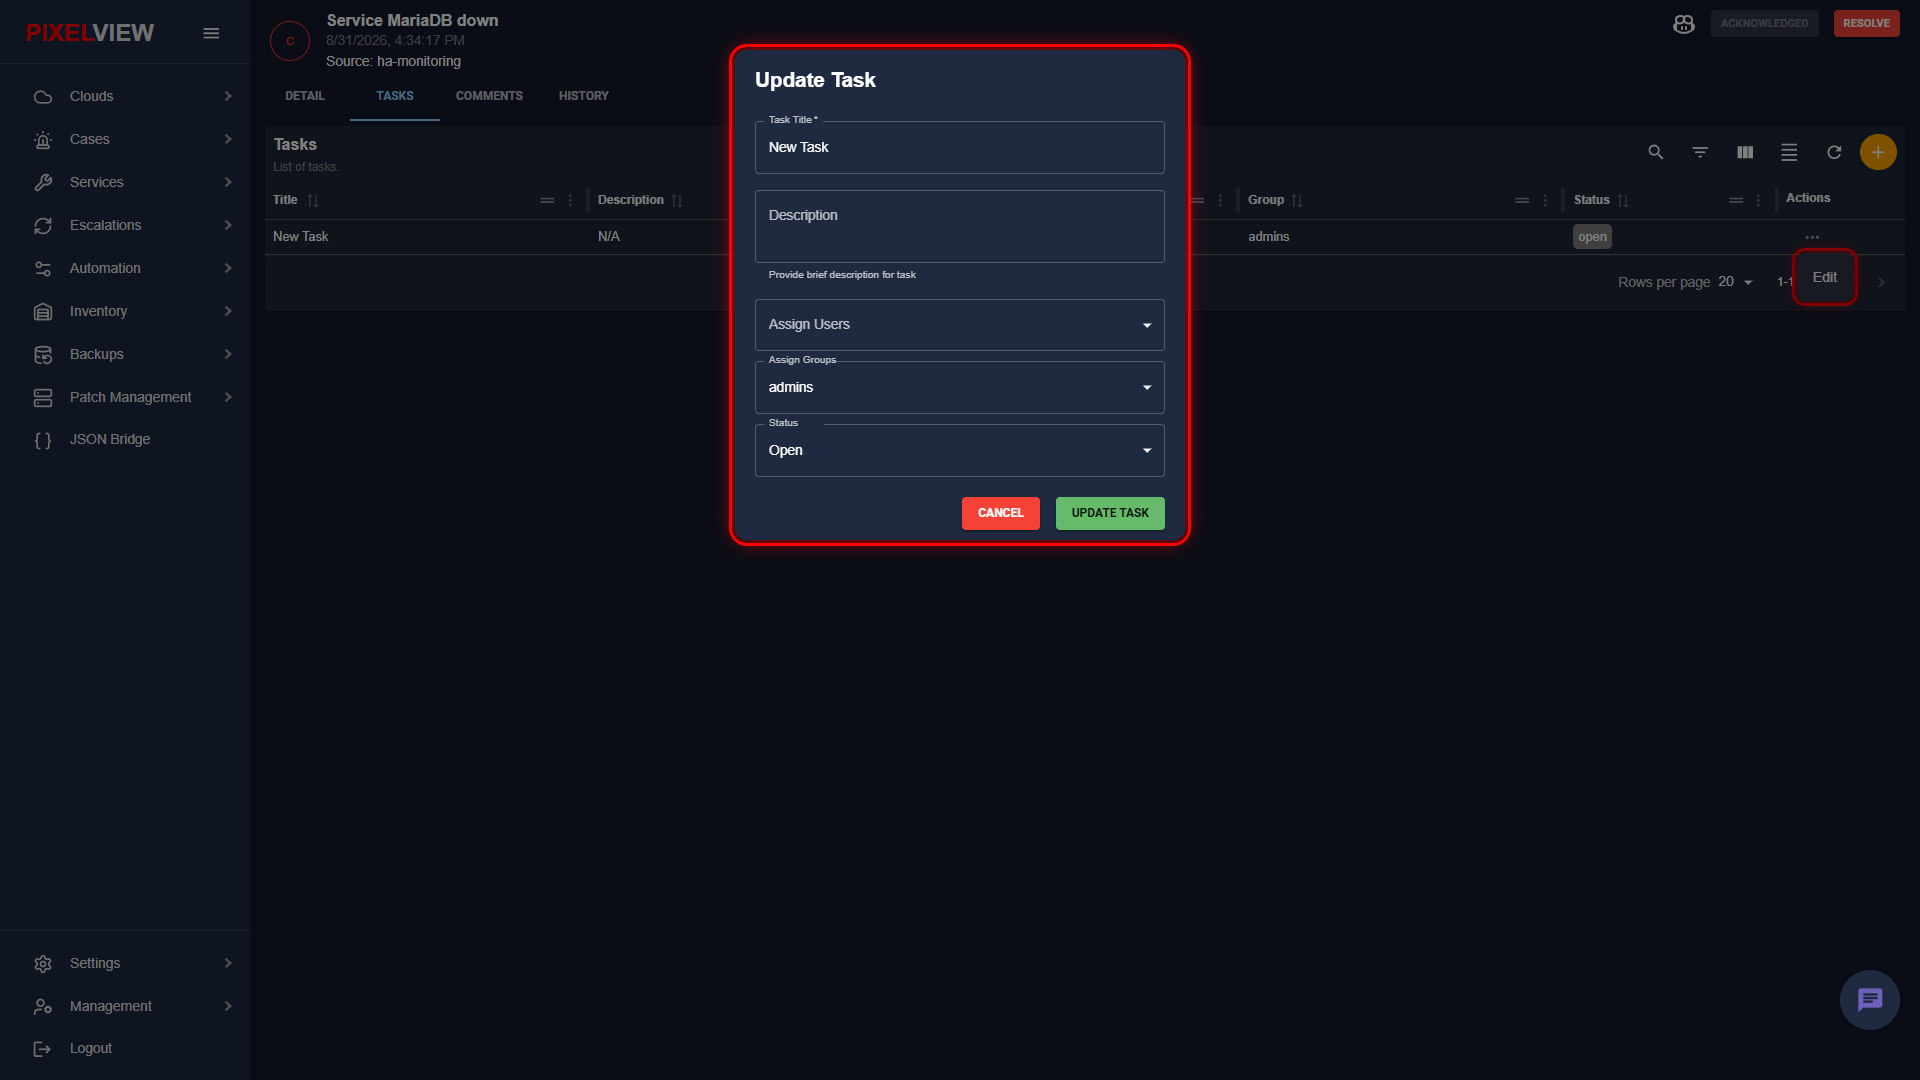
- Modify the title, description, assignees, or update the task Status (Open, Completed).
- Click UPDATE TASK to apply updates.
Single Task Detail View
- Click on any task row:
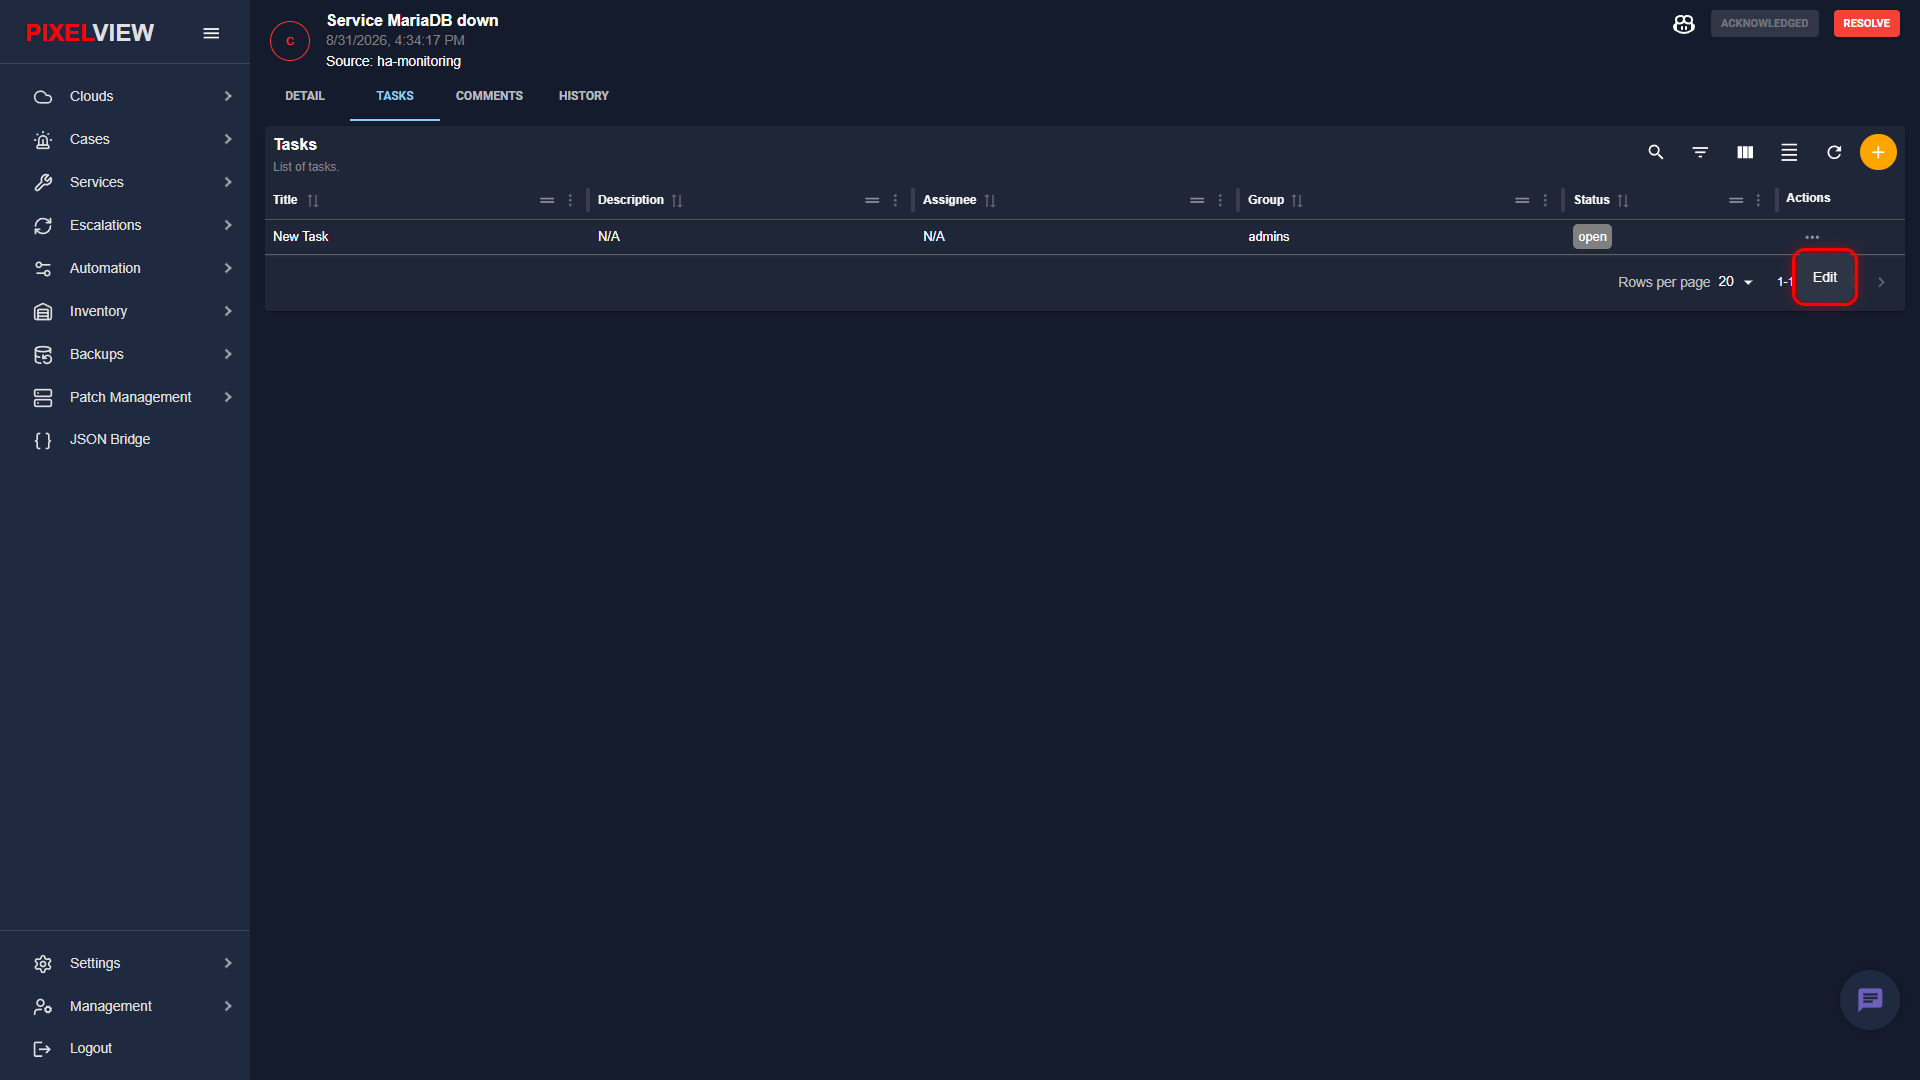
- The view drills down into the dedicated task details console:
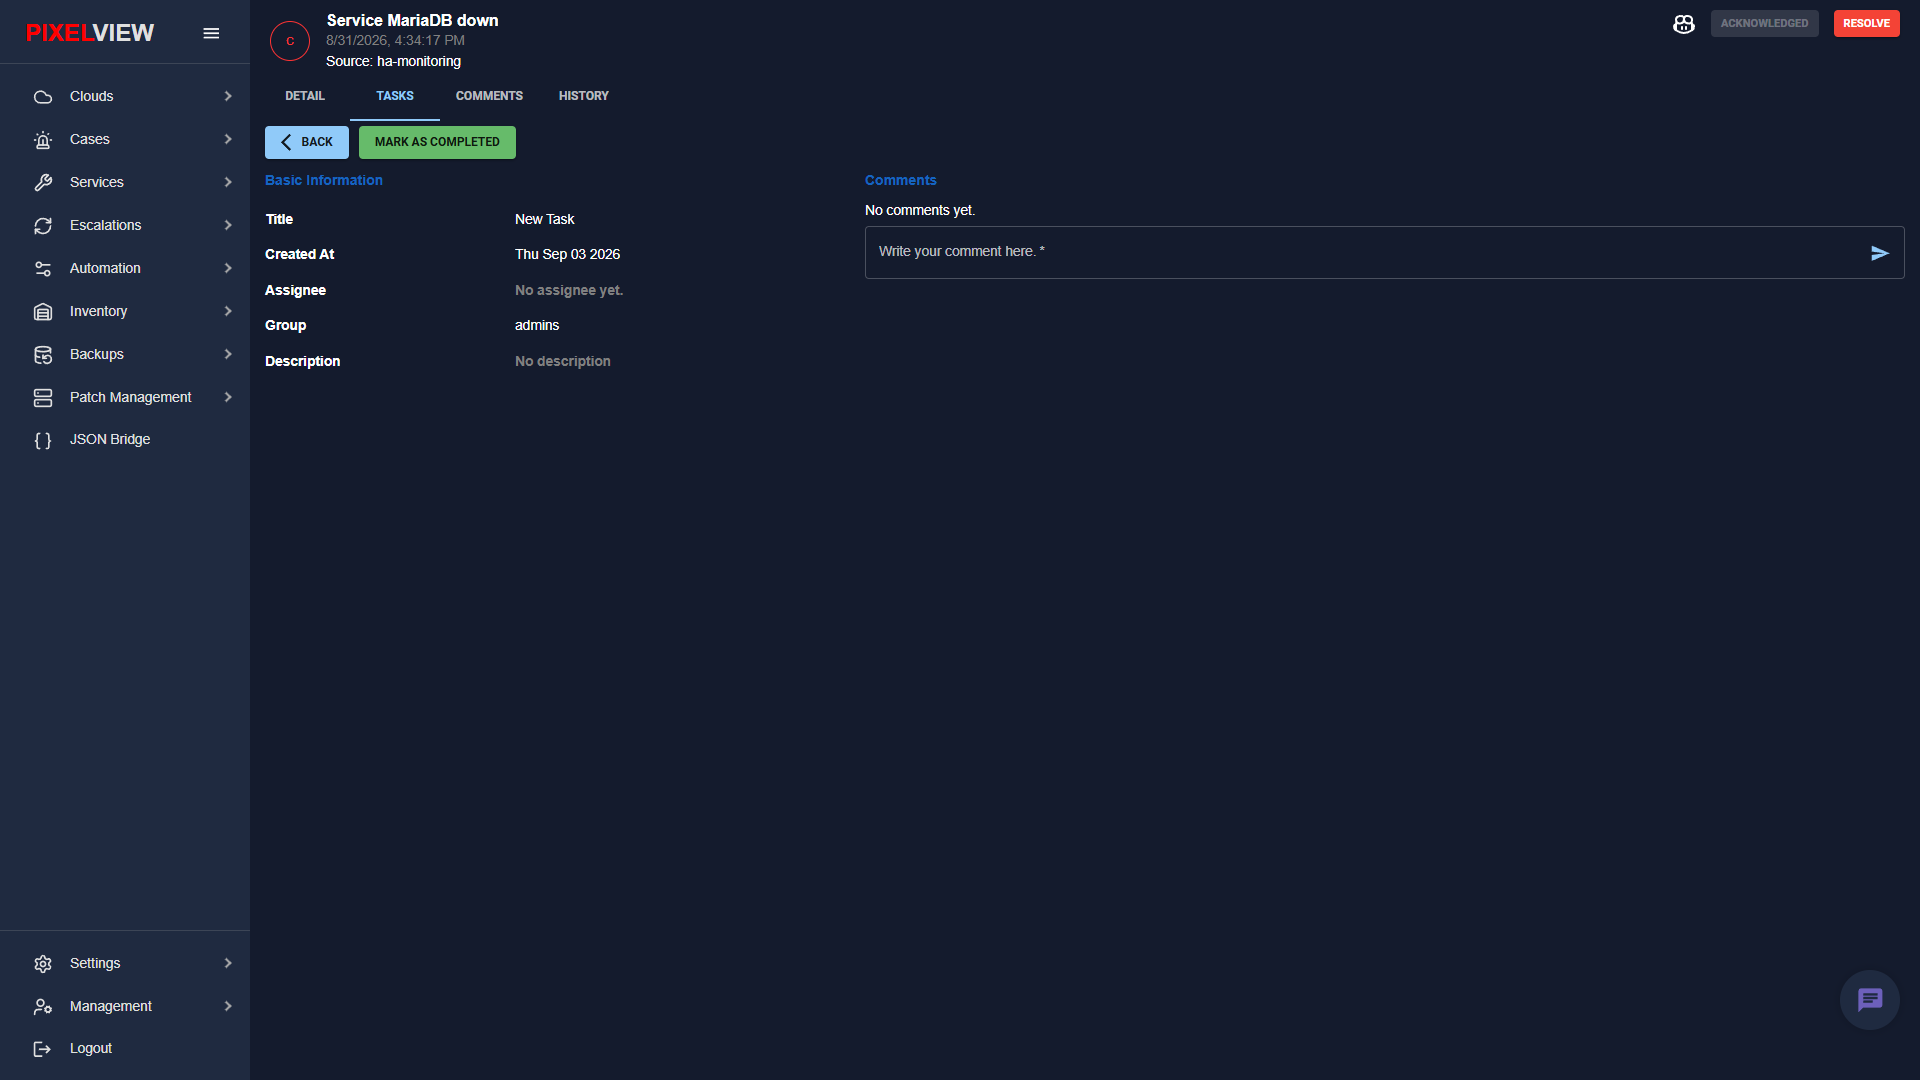
- Basic Information: View assigned group, assignee, creation timestamp, and description.
- MARK AS COMPLETED: Click the green button to close out the task once verification succeeds.
- Task Comments: Maintain a dedicated threaded chat stream for this specific sub-task without cluttering the main case discussion.
- BACK: Return to the main case tasks list.
Comments Tab: Collaborative Incident Stream
The COMMENTS tab provides an interactive discussion feed where incident responders, system administrators, and management can collaborate in real time:
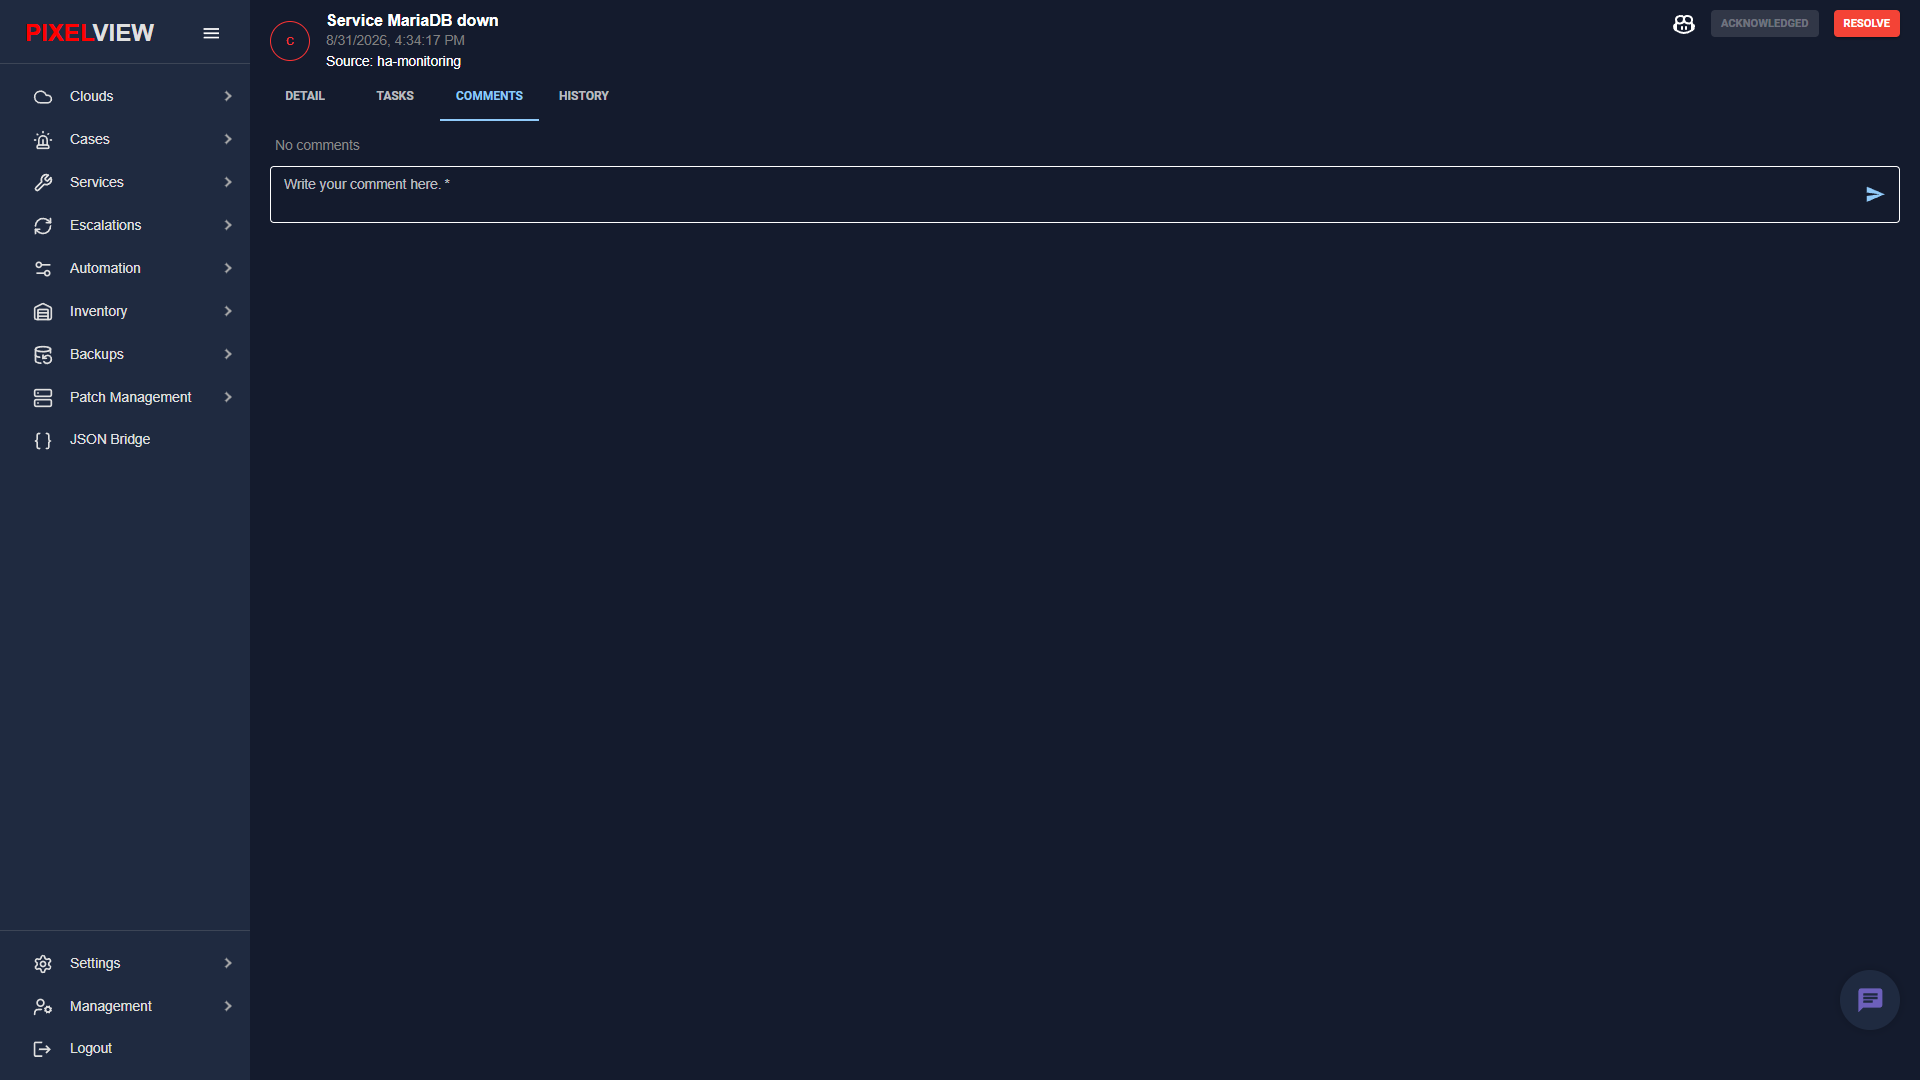
- Post triage findings, terminal output snippets, hypotheses, and handover notes.
- Maintains a permanent audit record preserved through post-mortem reviews.
History Tab: Host Correlation & Pattern Analysis
The HISTORY tab automatically queries PixelView for all past incidents sharing the same infrastructure host:
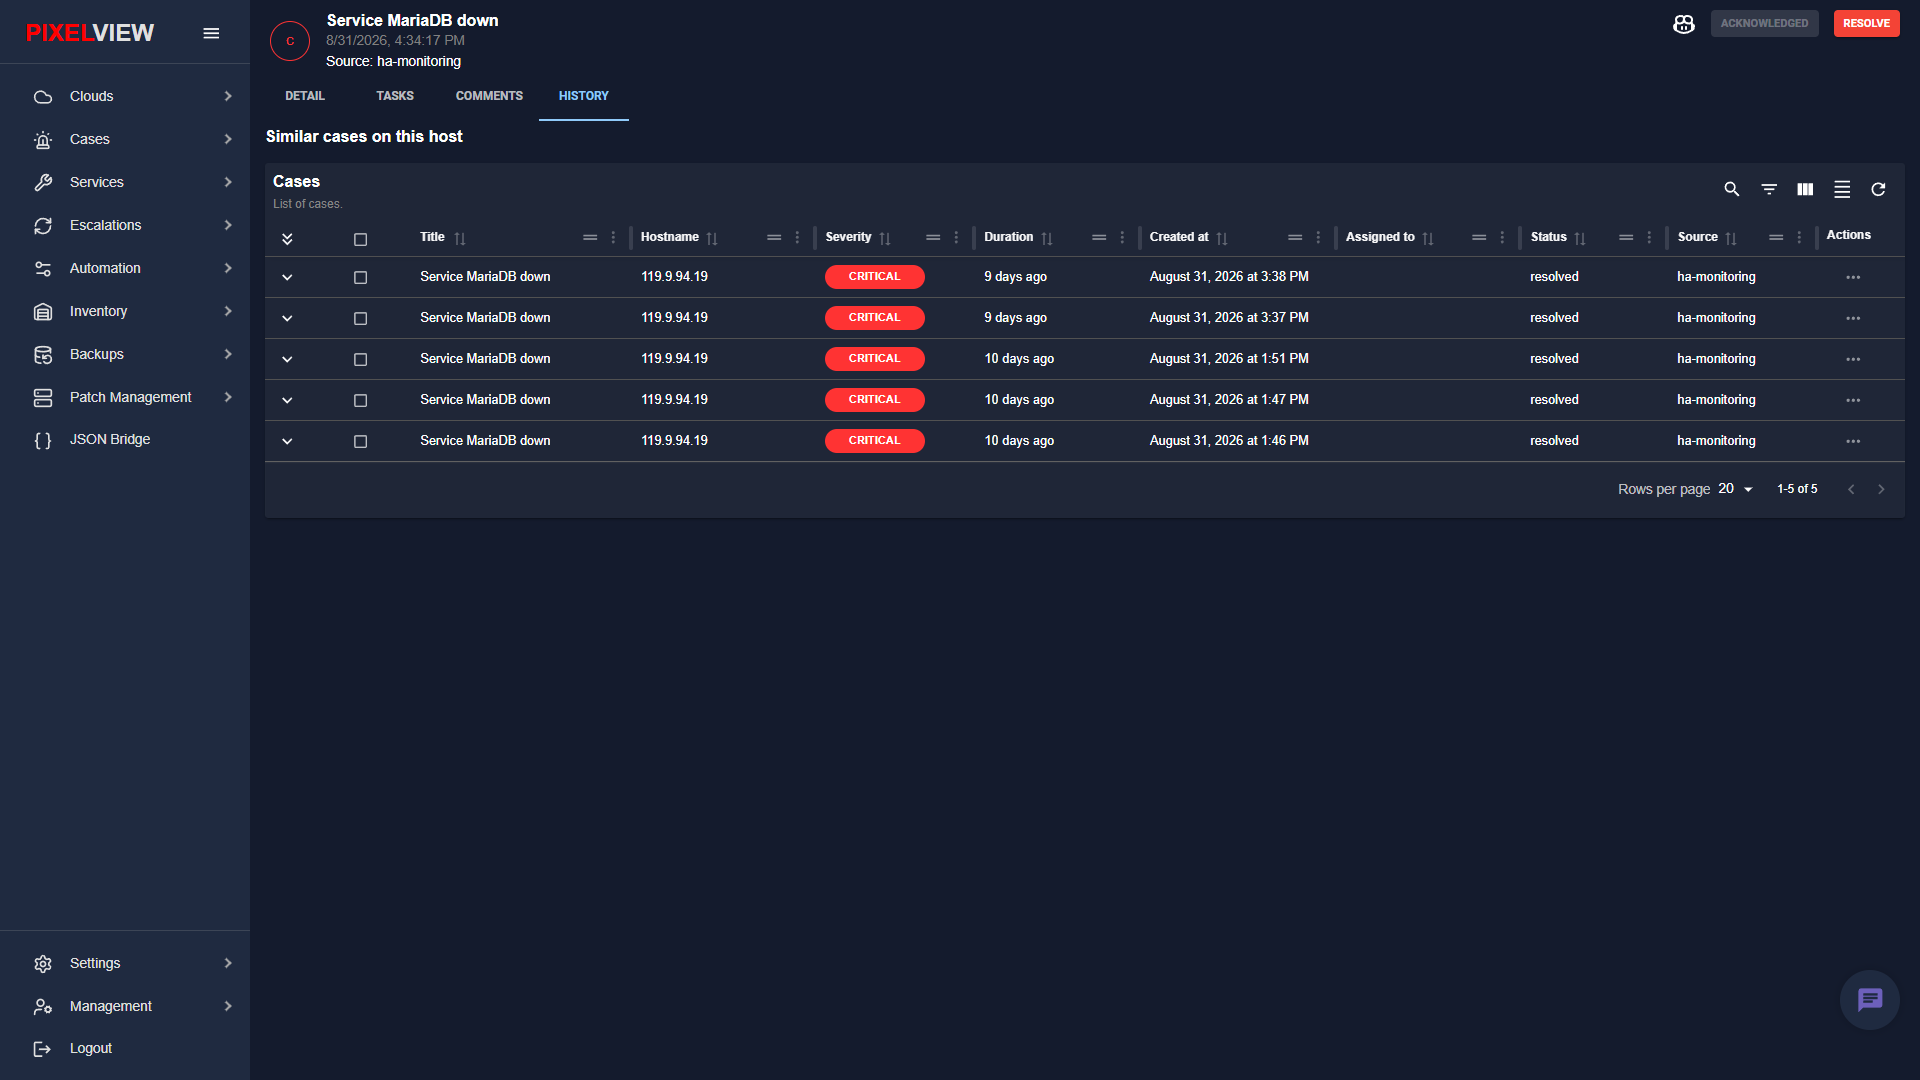
- Similar cases on this host: Lists past alerts for the current node (
119.9.94.19), showing timestamps, severity, and resolution statuses. - Enables engineers to instantly identify flapping services, chronic resource bottlenecks, or recent configuration regression patterns.