Cloud Reporting
Cloud Reporting provides centralized analytics, real-time telemetry, and historical trend monitoring across cloud environments managed within PixelView. Through interactive visual dashboards, system administrators and operations teams can track alert volume patterns over time, analyze daily alert spikes, and identify top alerting hypervisors and host instances.
Cloud Reporting Overview
The Cloud Reporting dashboard aggregates system alerts and operational events into visual charts and interactive tables. Accessible directly from the main navigation sidebar under the Clouds section, the interface gives immediate visibility into platform stability and alert distribution.
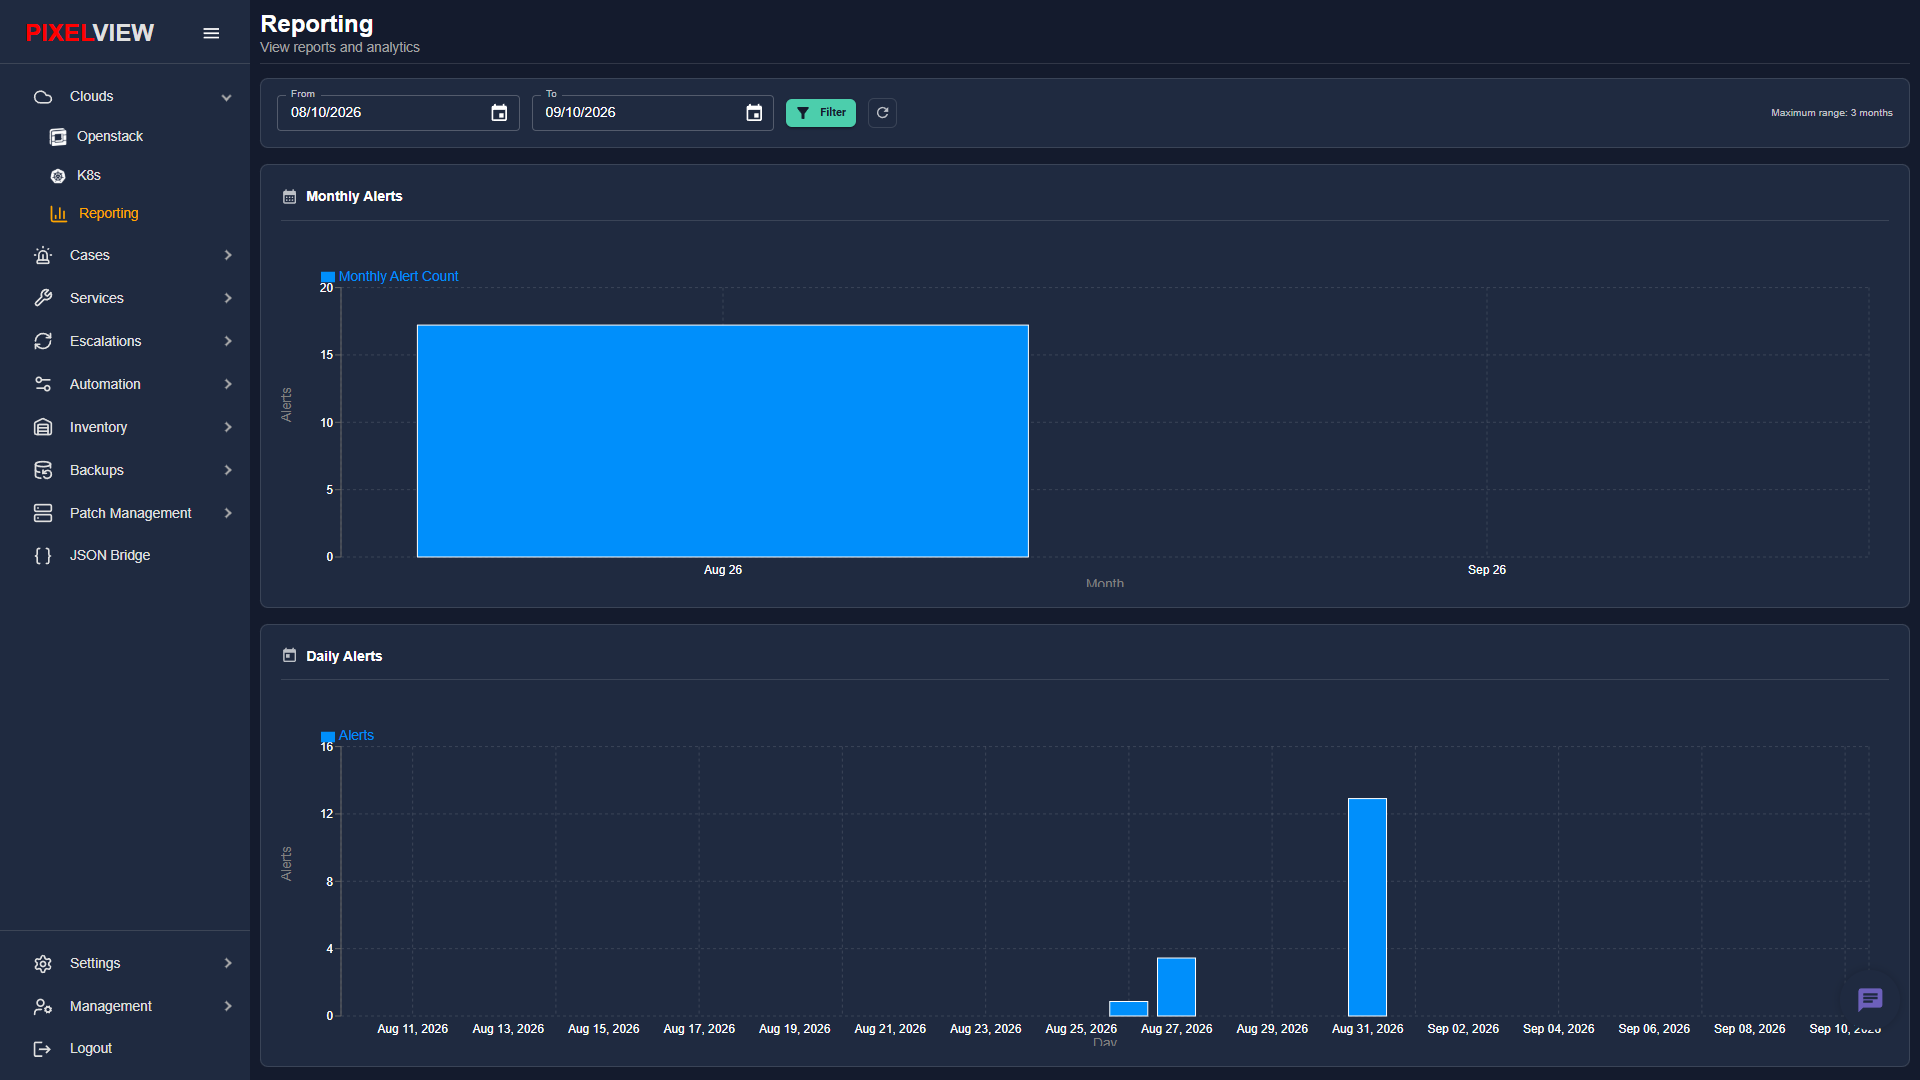
The dashboard consists of four primary functional areas:
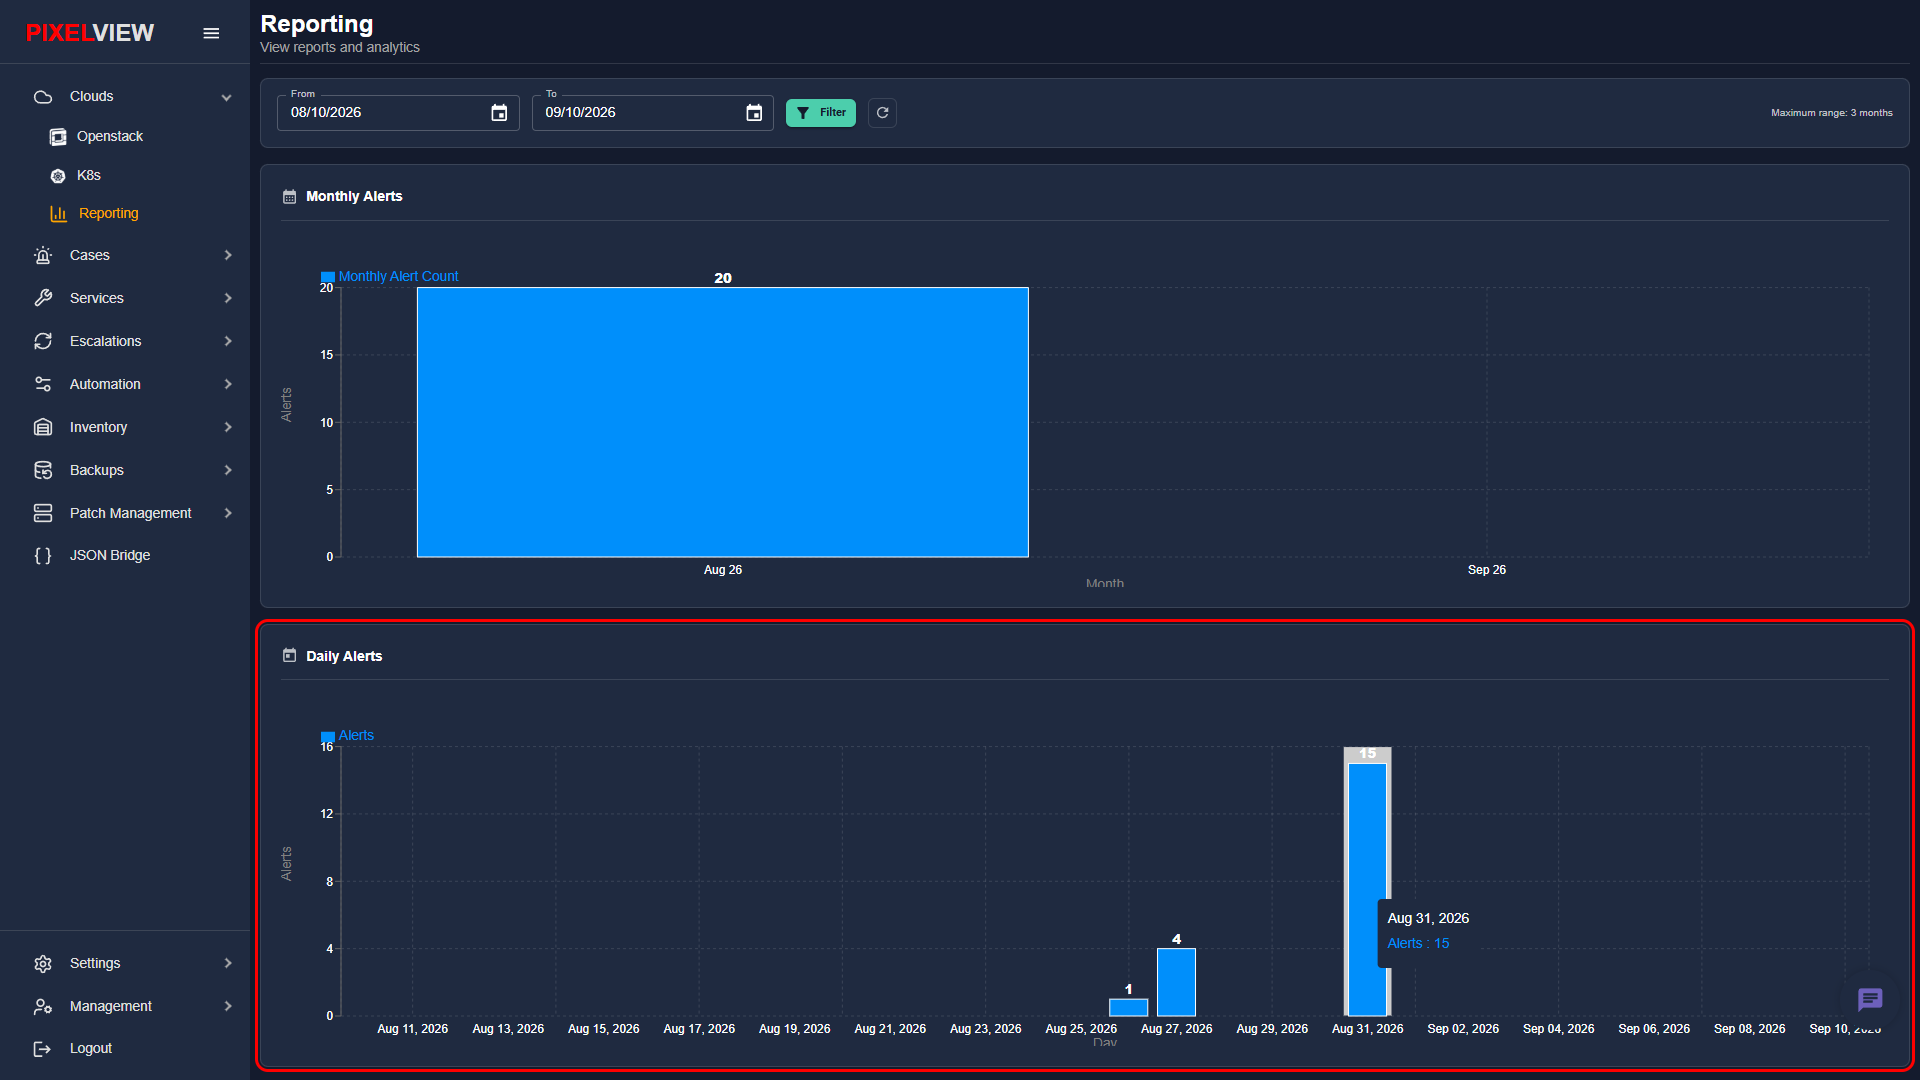
- Date Range Filtering Toolbar: Configure custom reporting intervals up to three months, apply filters, and refresh real-time metrics.
- Monthly Alerts Analytics: Macro-level bar chart displaying aggregated monthly alert volumes across the cloud infrastructure.
- Daily Alerts Trend Analysis: Micro-level daily bar chart tracking date-by-date alert variations and operational spikes.
- Top Alerting Hosts Table: Data grid highlighting hosts with the highest incident counts, complete with multi-column sorting, filtering, and search.
Date Range Filtering
The filtering toolbar allows operators to customize the reporting window to focus on specific operational periods, maintenance windows, or audit timeframes.
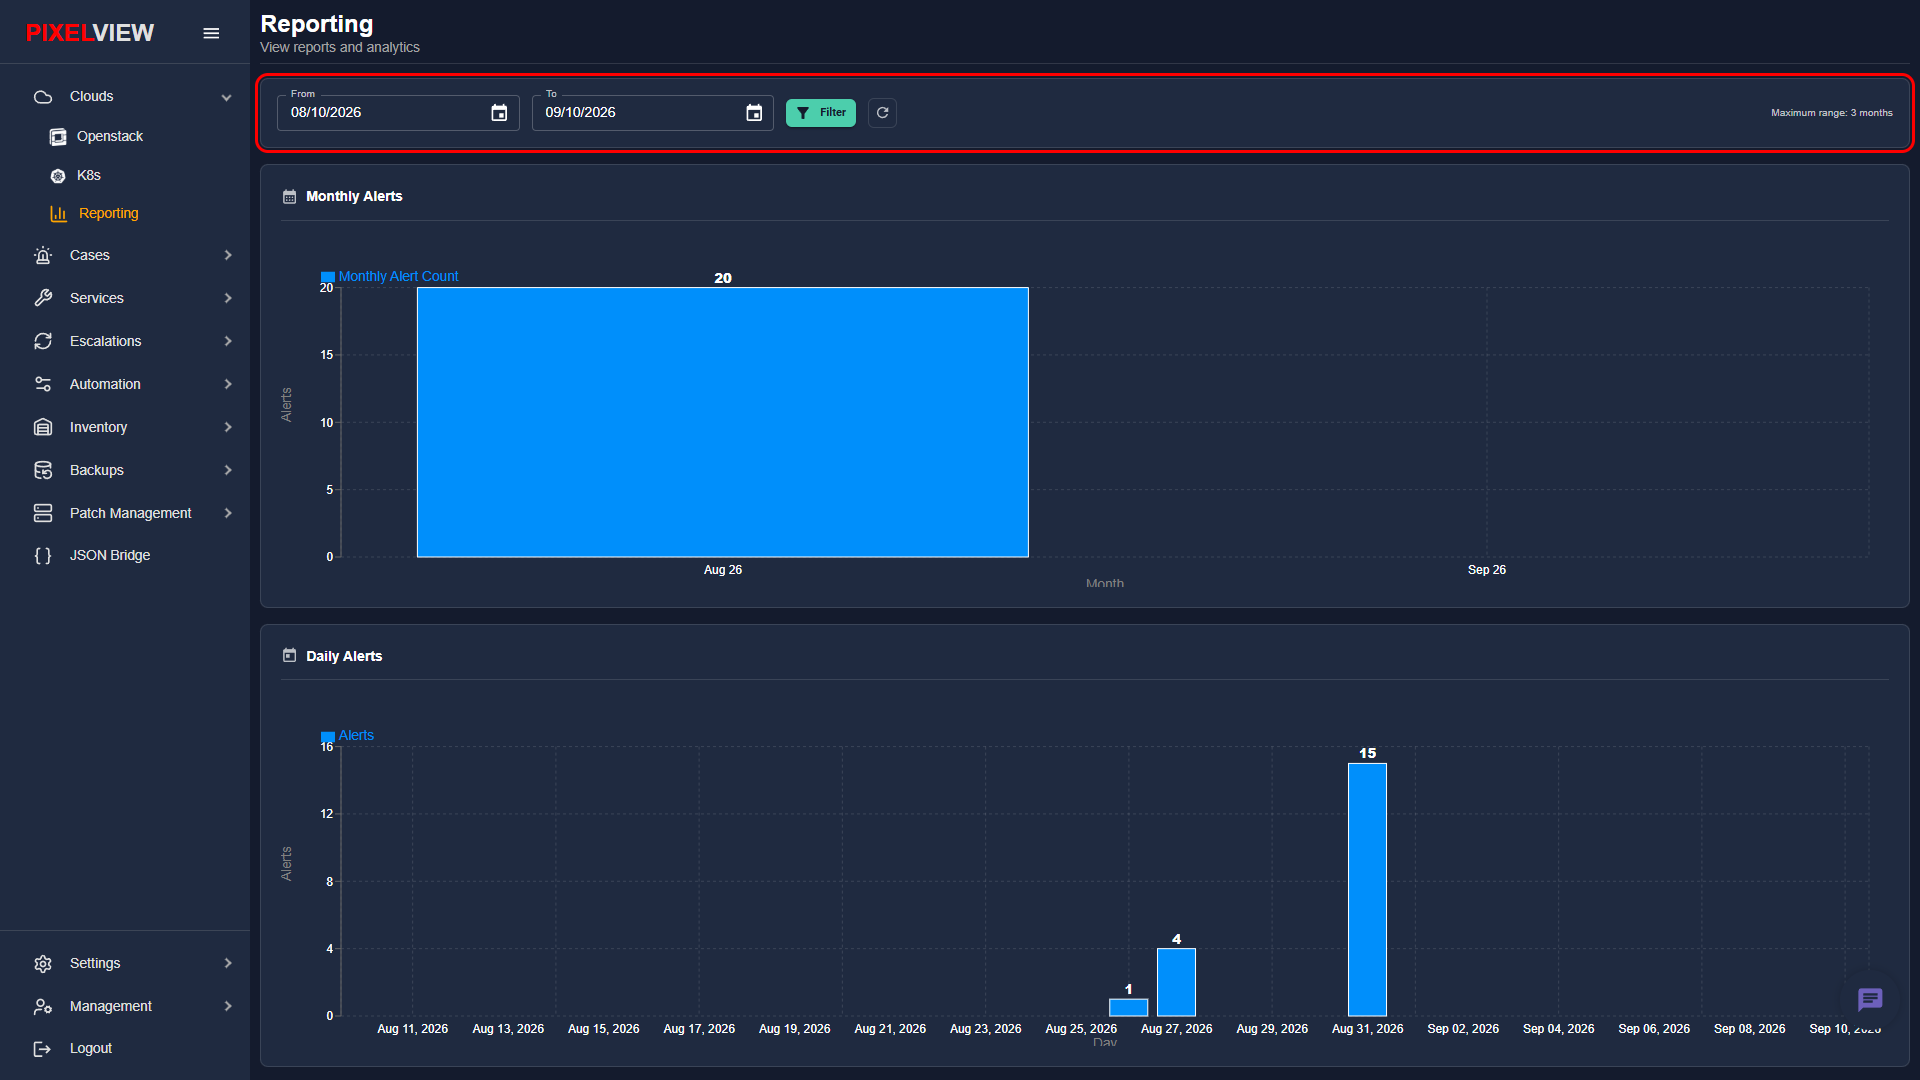
Filter Controls and Parameters
- From: The starting date for the reporting interval. Defaults to exactly one month prior to the current date.
- To: The concluding date for the reporting interval. Defaults to the current date.
- Filter Button: Triggers queries across all reporting endpoints (
getMonthlyAlerts,getDailyAlerts,getTopAlertingHosts) using the selected parameters. - Refresh Data Button: An on-demand refresh icon that synchronizes telemetry without changing the selected date bounds. Displays a continuous rotation animation while network requests are active.
- Maximum Range Notice: Informs users of the maximum supported query window of three months.
Date Range Policy & Validation
The reporting engine enforces strict input validation:
- If the From date is set after the To date, the system displays an error notification: "Start date cannot be greater than end date".
- If the selected range exceeds 90 days (3 months), the system prompts: "Please select a date range of maximum 3 months".
Interactive Date Picker
Clicking either the From or To calendar icon opens an interactive date selection popover for intuitive navigation across months and years.
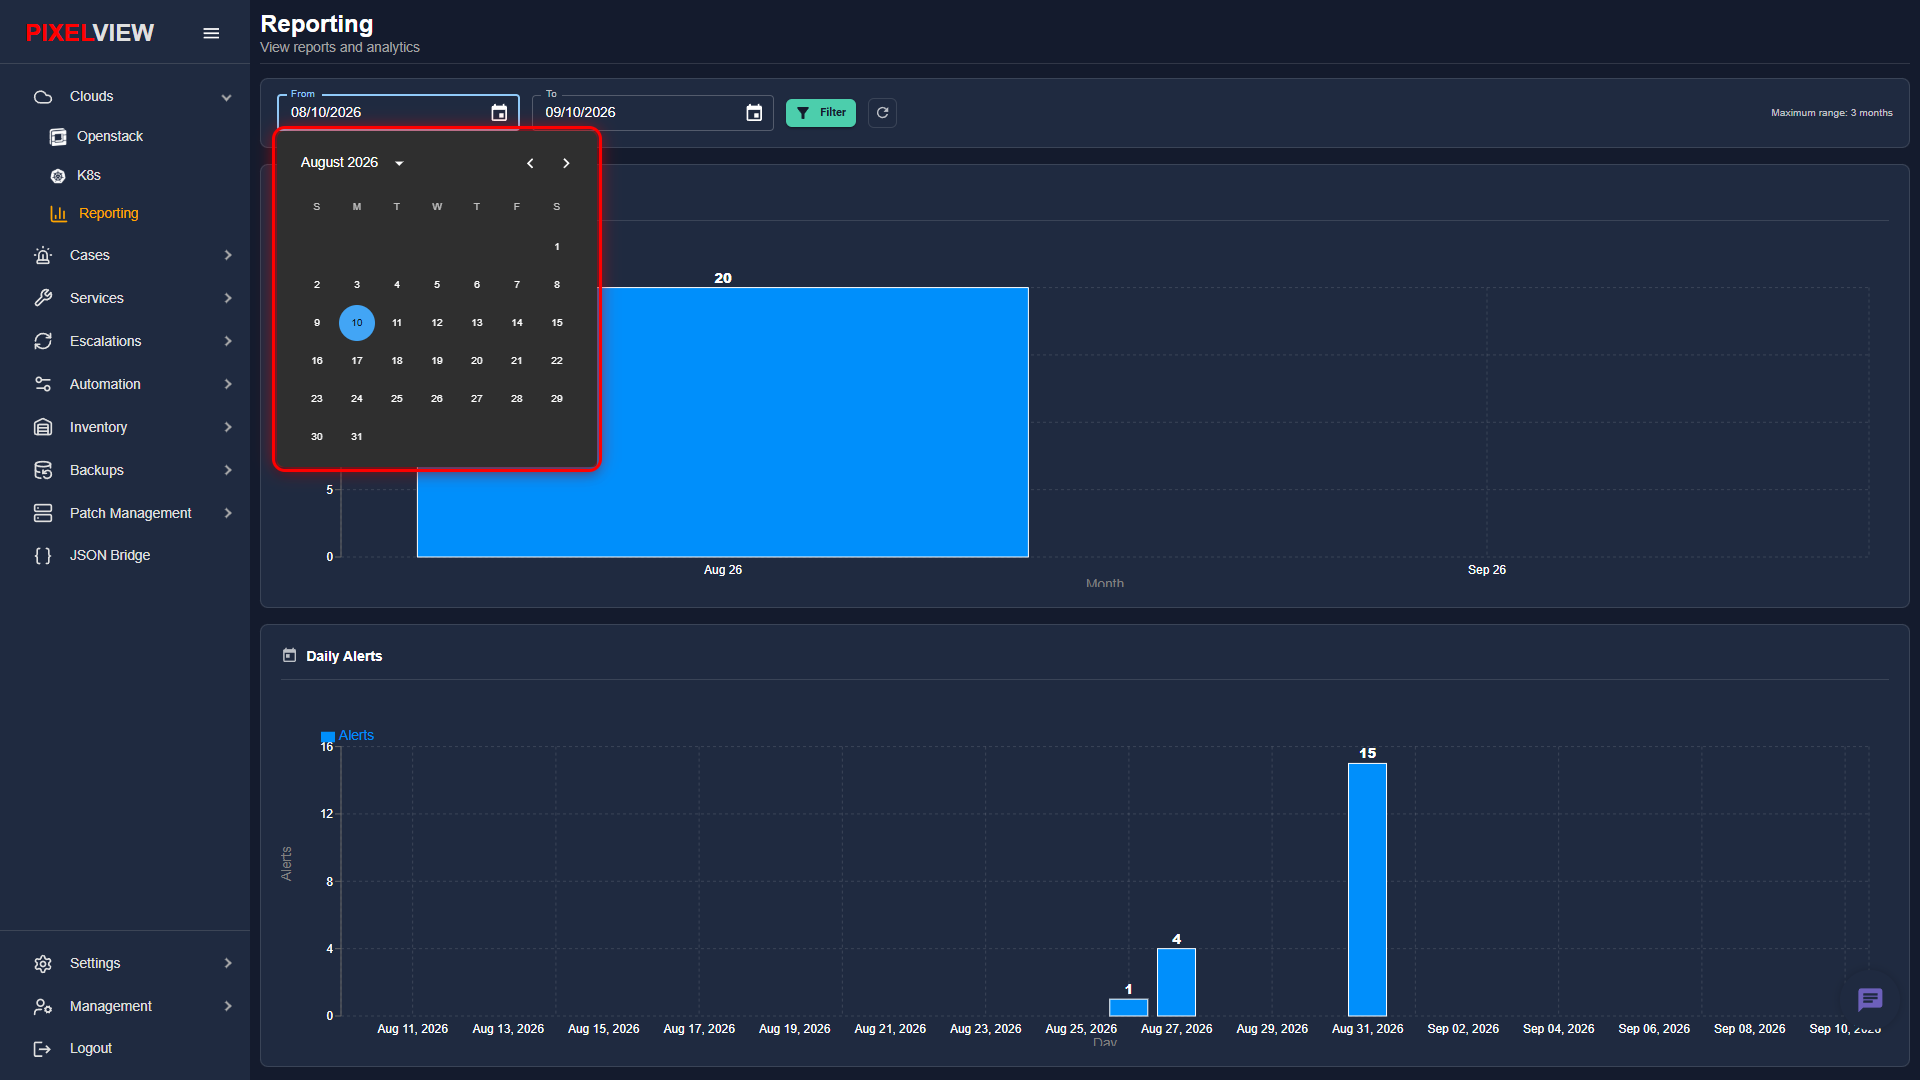
- Month and Year Navigation: Use the directional chevron controls to scroll between calendar months or open the month selector dropdown.
- Day Selection: Click any individual date cell to update the boundary value.
- Automatic Formatting: Selected dates are automatically standardized to the required
DD-MM-YYYYquery format upon filter submission.
Monthly Alerts Analytics
The Monthly Alerts card presents an aggregated macro perspective of all alerts generated across cloud services over calendar months.
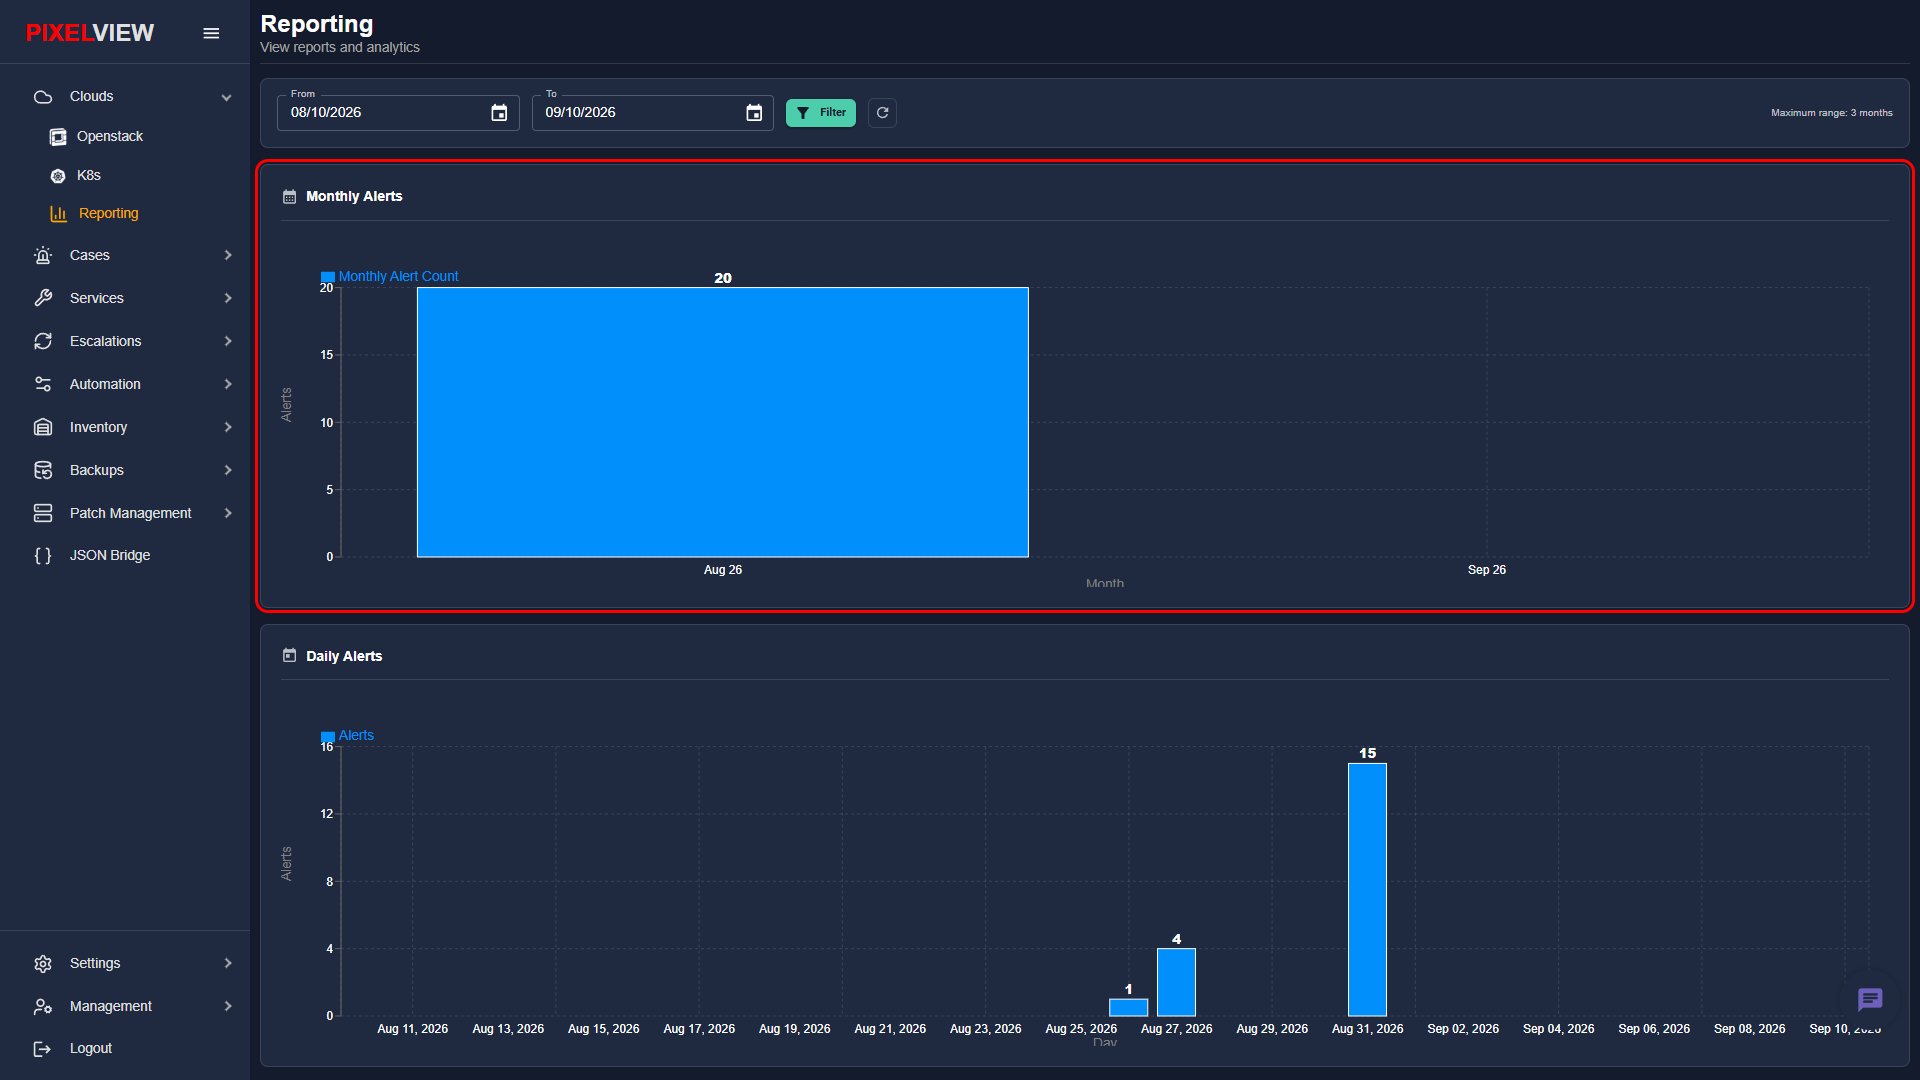
Chart Architecture
- Visual Encoding: Rendered as a stacked vertical bar chart powered by high-performance SVG graphics.
- Series Legend: Displays active metric series indicators (
Monthly Alert Count) with distinct color swatches. - Horizontal Axis (Month): Groups data points chronologically by calendar month (e.g.,
Aug 26,Sep 26). - Vertical Axis (Alerts): Dynamically scaled numerical axis reflecting total incident volume.
- Total Labels: Numerical badges displayed directly above each bar segment provide instant count readouts without requiring manual cursor hovering.
- Automatic Polling: Metrics are configured to poll automatically in the background at 60-second intervals to maintain fresh telemetry.
Daily Alerts Trend Analysis
The Daily Alerts card breaks down alert generation on a per-day cadence, enabling engineers to correlate alert spikes with infrastructure deployments, network anomalies, or scheduled maintenance.
Key Capabilities
- Daily Resolution: Maps alert counts across every calendar day within the active query window (e.g.,
Aug 11, 2026throughSep 10, 2026). - Interactive Tooltips: Hovering the cursor over any daily bar renders a tooltip showing the exact calendar date alongside total alert counts (e.g.,
Aug 31, 2026 - Alerts: 15). - Peak Detection: High-volume days are visually emphasized, making it straightforward to pinpoint specific incident days for deep-dive investigation.
- Grid Guidelines: Subtle horizontal dashed guidelines assist in comparing daily quantities across extended time intervals.
Top Alerting Hosts Table
Located below the analytical charts, the Top Alerting Hosts table details individual infrastructure hosts, hypervisors, and nodes generating the highest volume of alerts.
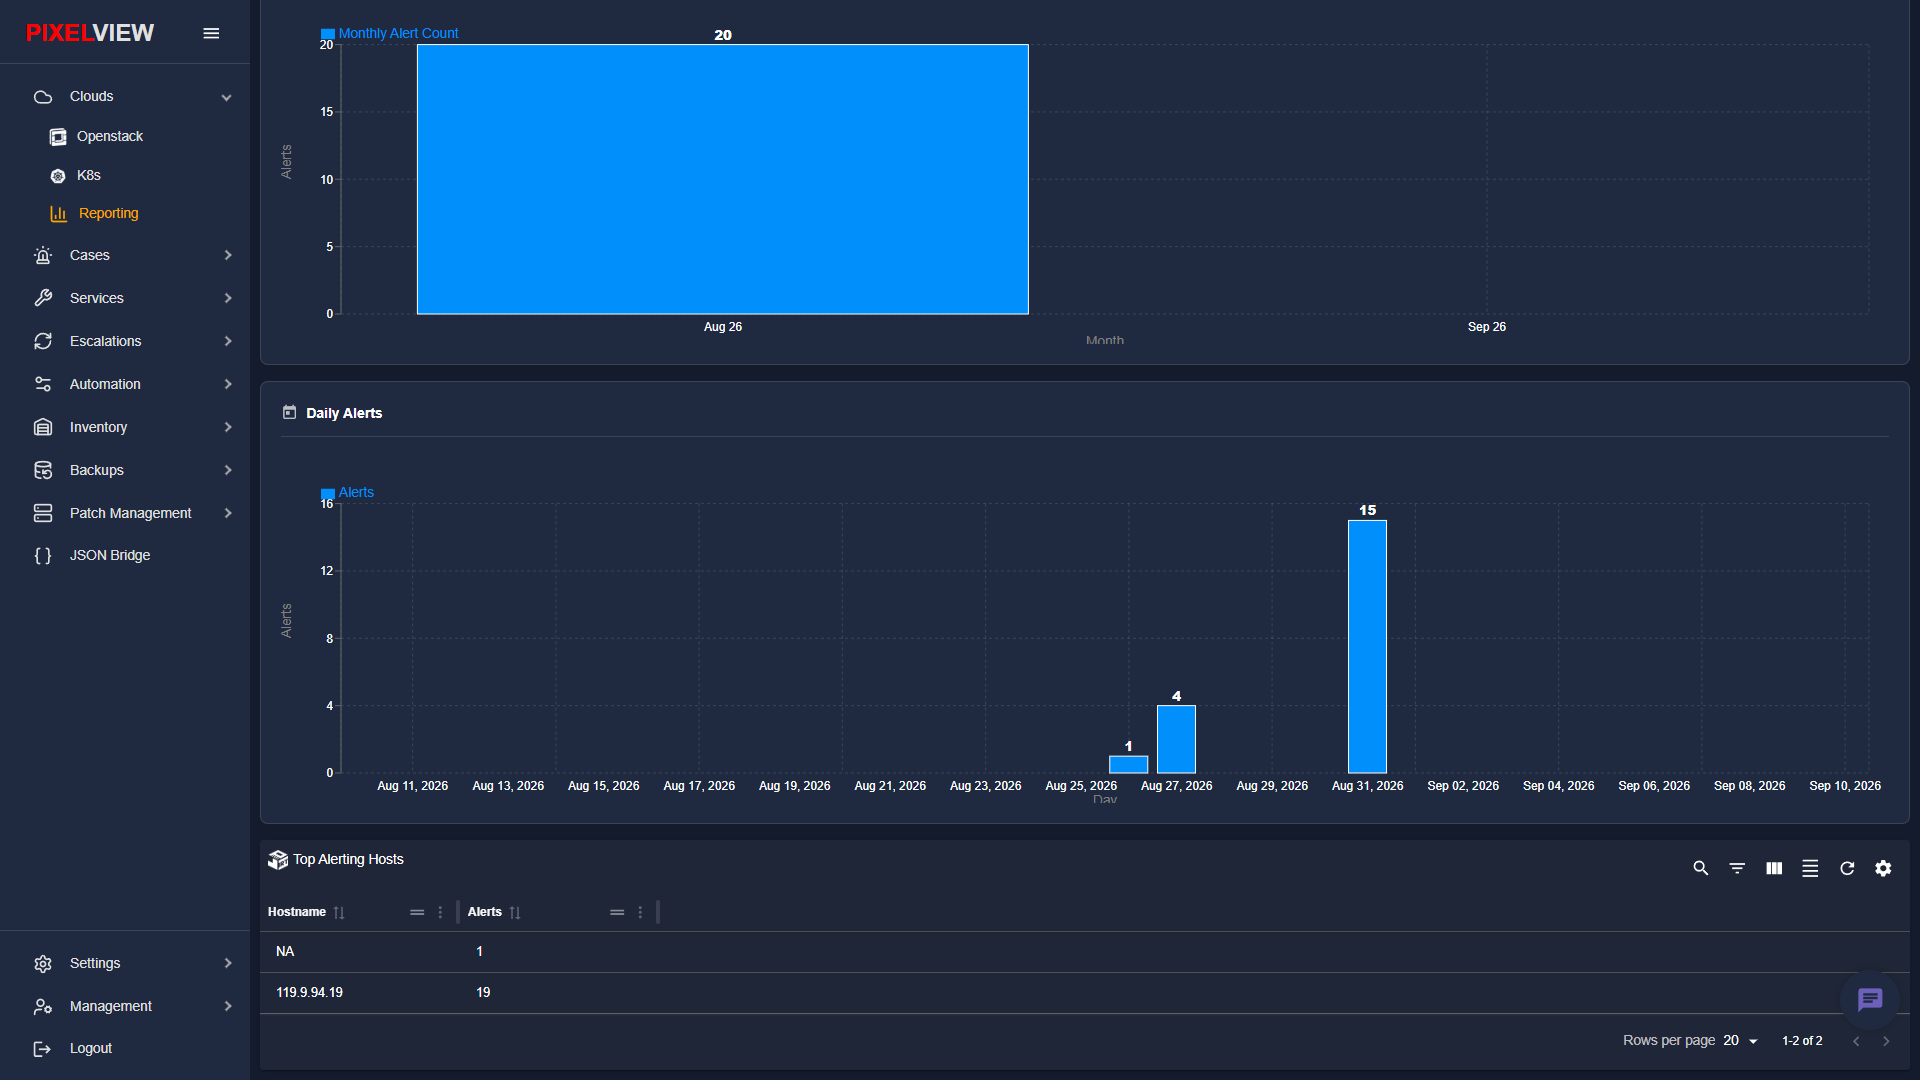
Table Attributes
- Hostname: The hostname or IP address of the alerting server node (e.g.,
119.9.94.19,NAfor unassigned platform-level alerts). - Alerts: The cumulative count of alerts logged by the respective host within the designated date range.
- Column Sorting: Click the column header or sort indicator arrows to toggle between ascending and descending order.
- Pagination Controls: Adjust the page display capacity (defaults to 20 rows per page) and navigate through multi-page host listings using previous and next controls.
Table Search and Filtering
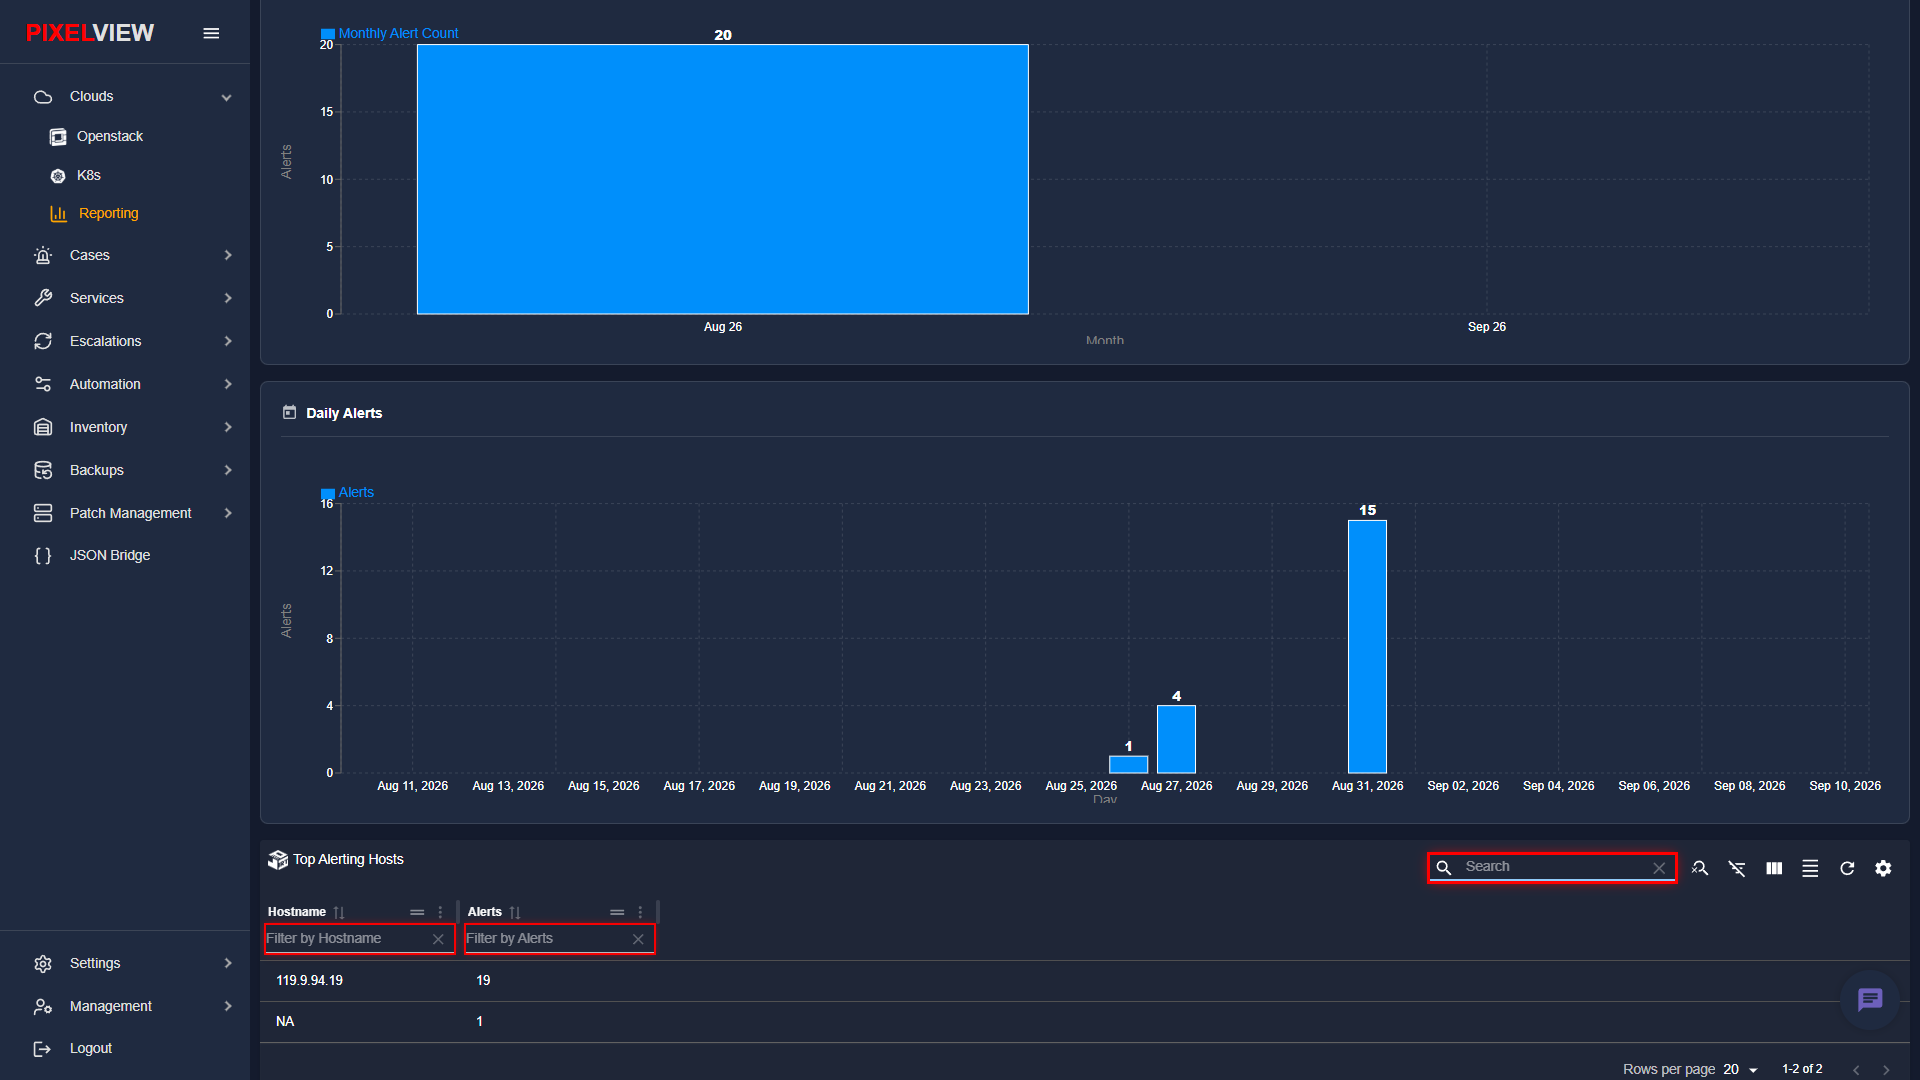
To quickly locate specific nodes or isolate high-incident servers, the table provides built-in search and column filtering capabilities.
Search and Filter Operations
- Show/Hide Search: Click the magnifying glass icon in the table toolbar to open the global search bar. Typing any partial IP address or host string instantly filters the visible rows.
- Clear Search: Click the clear icon (
✕) inside the search input to reset the global filter. - Show/Hide Filters: Click the funnel filter icon to display inline filter inputs directly below column headers.
- Filter by Hostname: Enter text to filter host records matching specific naming conventions or IP subnets.
- Filter by Alerts: Enter numerical thresholds to display only hosts exceeding a specific alert threshold.
Column Visibility Customization
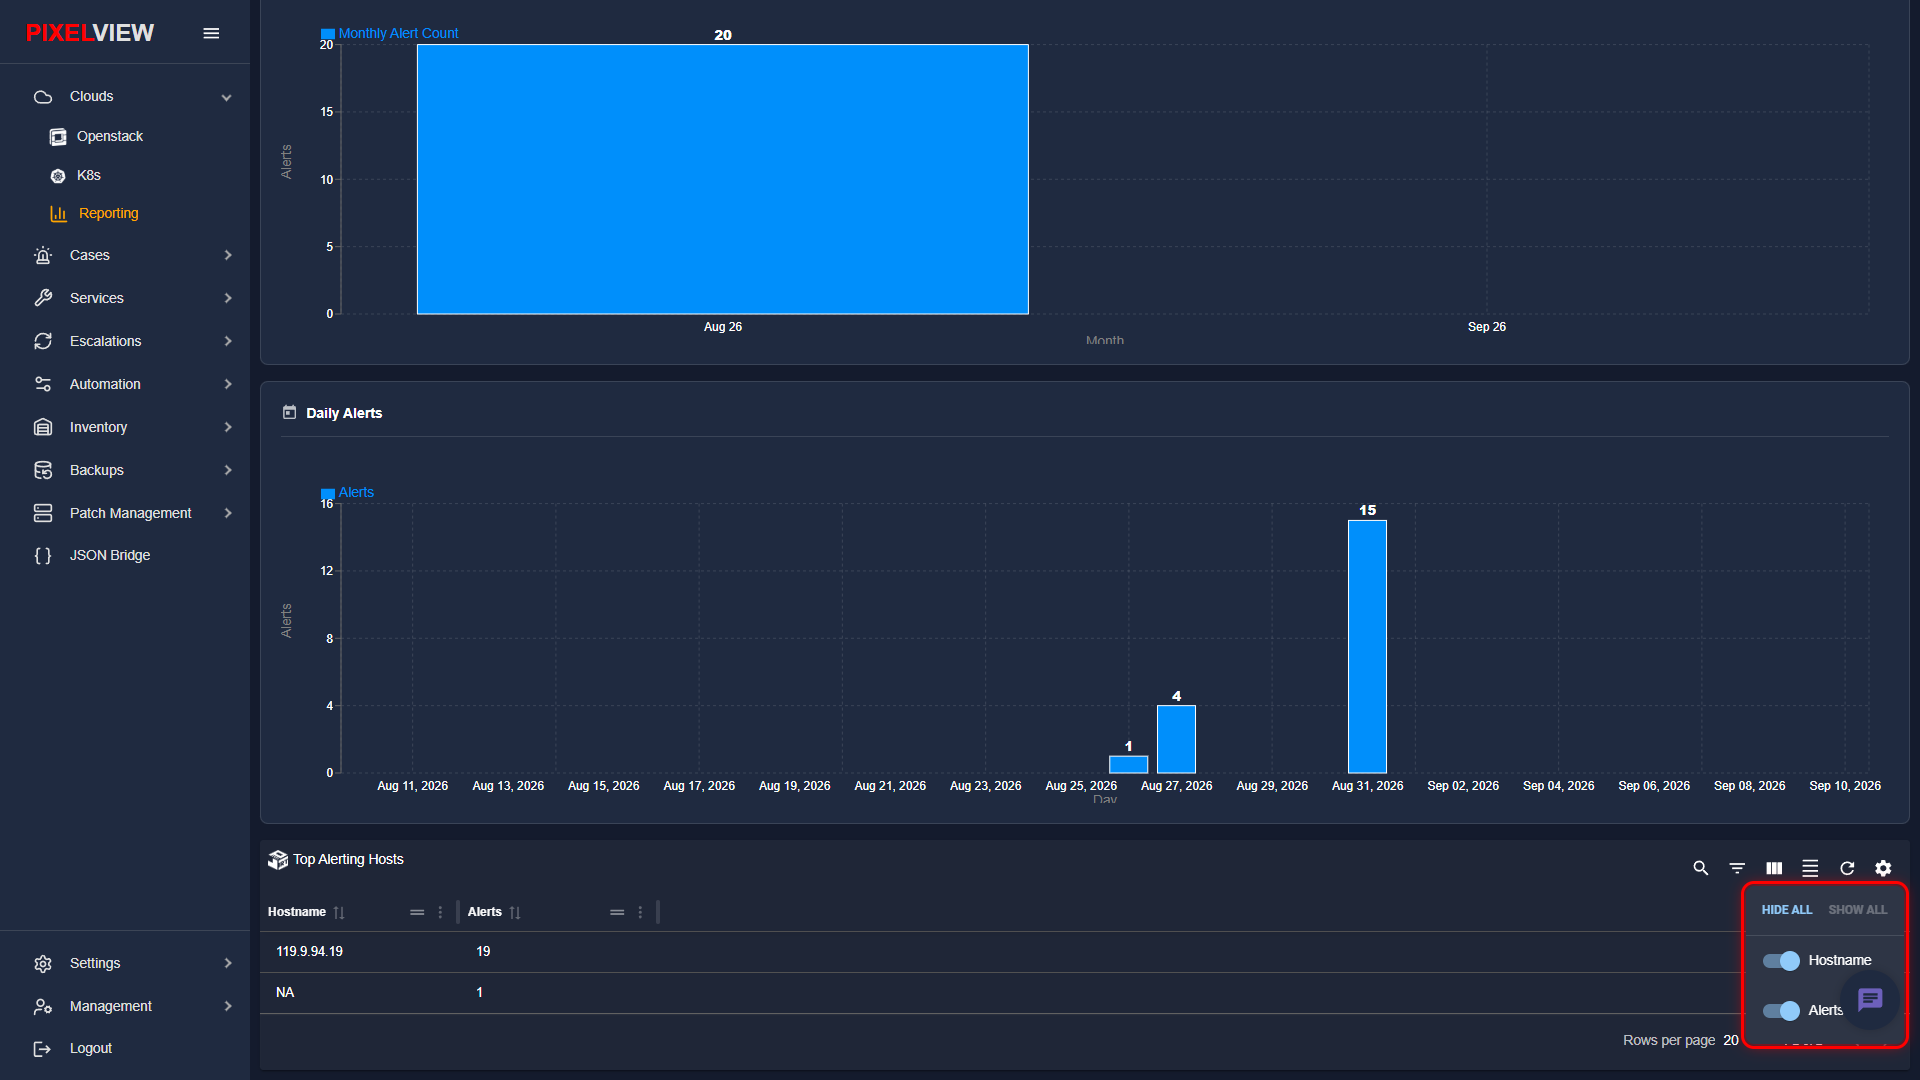
Users can tailor the table presentation to match their operational requirements by configuring column visibility.
Customization Options
- Column Visibility Menu: Click the column icon (vertical columns symbol) in the table toolbar to open the visibility dropdown.
- Hide All / Show All: Bulk buttons to quickly suppress or display all columns simultaneously.
- Individual Column Toggles: Dedicated switches for Hostname and Alerts allow hiding or revealing specific fields on demand.
Column Actions Menu
Each column header features a dedicated actions menu accessible via the three-dot icon (⋮).
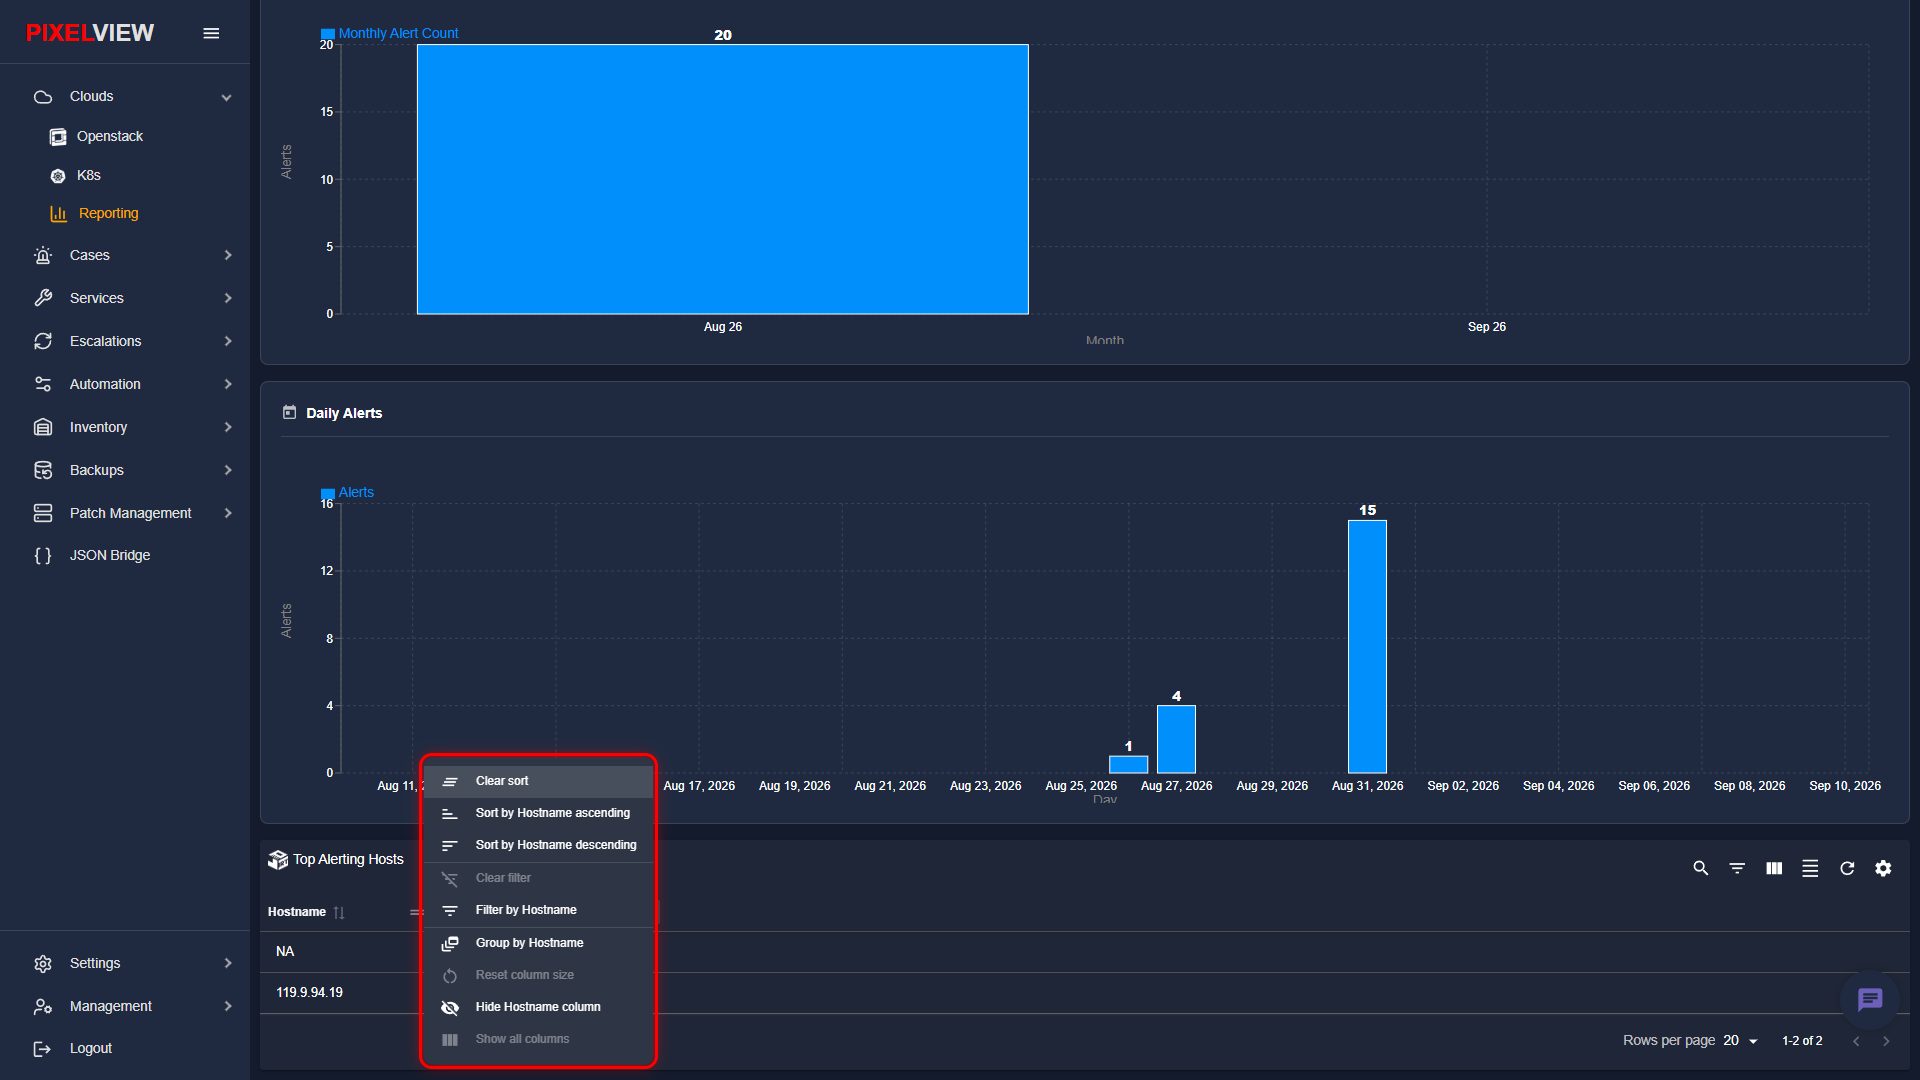
The column actions menu provides granular controls:
- Sort by Hostname Ascending: Sorts all rows in alphabetical or numerical ascending sequence.
- Sort by Hostname Descending: Inverts the sort order to display values in descending order.
- Clear Sort: Removes active sorting rules and restores default retrieval order.
- Filter by Hostname: Directly focuses the inline filter field for the selected column.
- Clear Filter: Erases any active filter criteria on the selected column.
- Group by Hostname: Groups identical host rows together for categorized analysis.
- Reset Column Size: Restores the column width to its default layout dimensions.
- Hide Hostname Column: Instantly hides the column from the view without opening the full column manager.
- Show All Columns: Restores all previously hidden columns.
Table Widget Options
The table header toolbar includes a settings gear icon providing dashboard integration options.
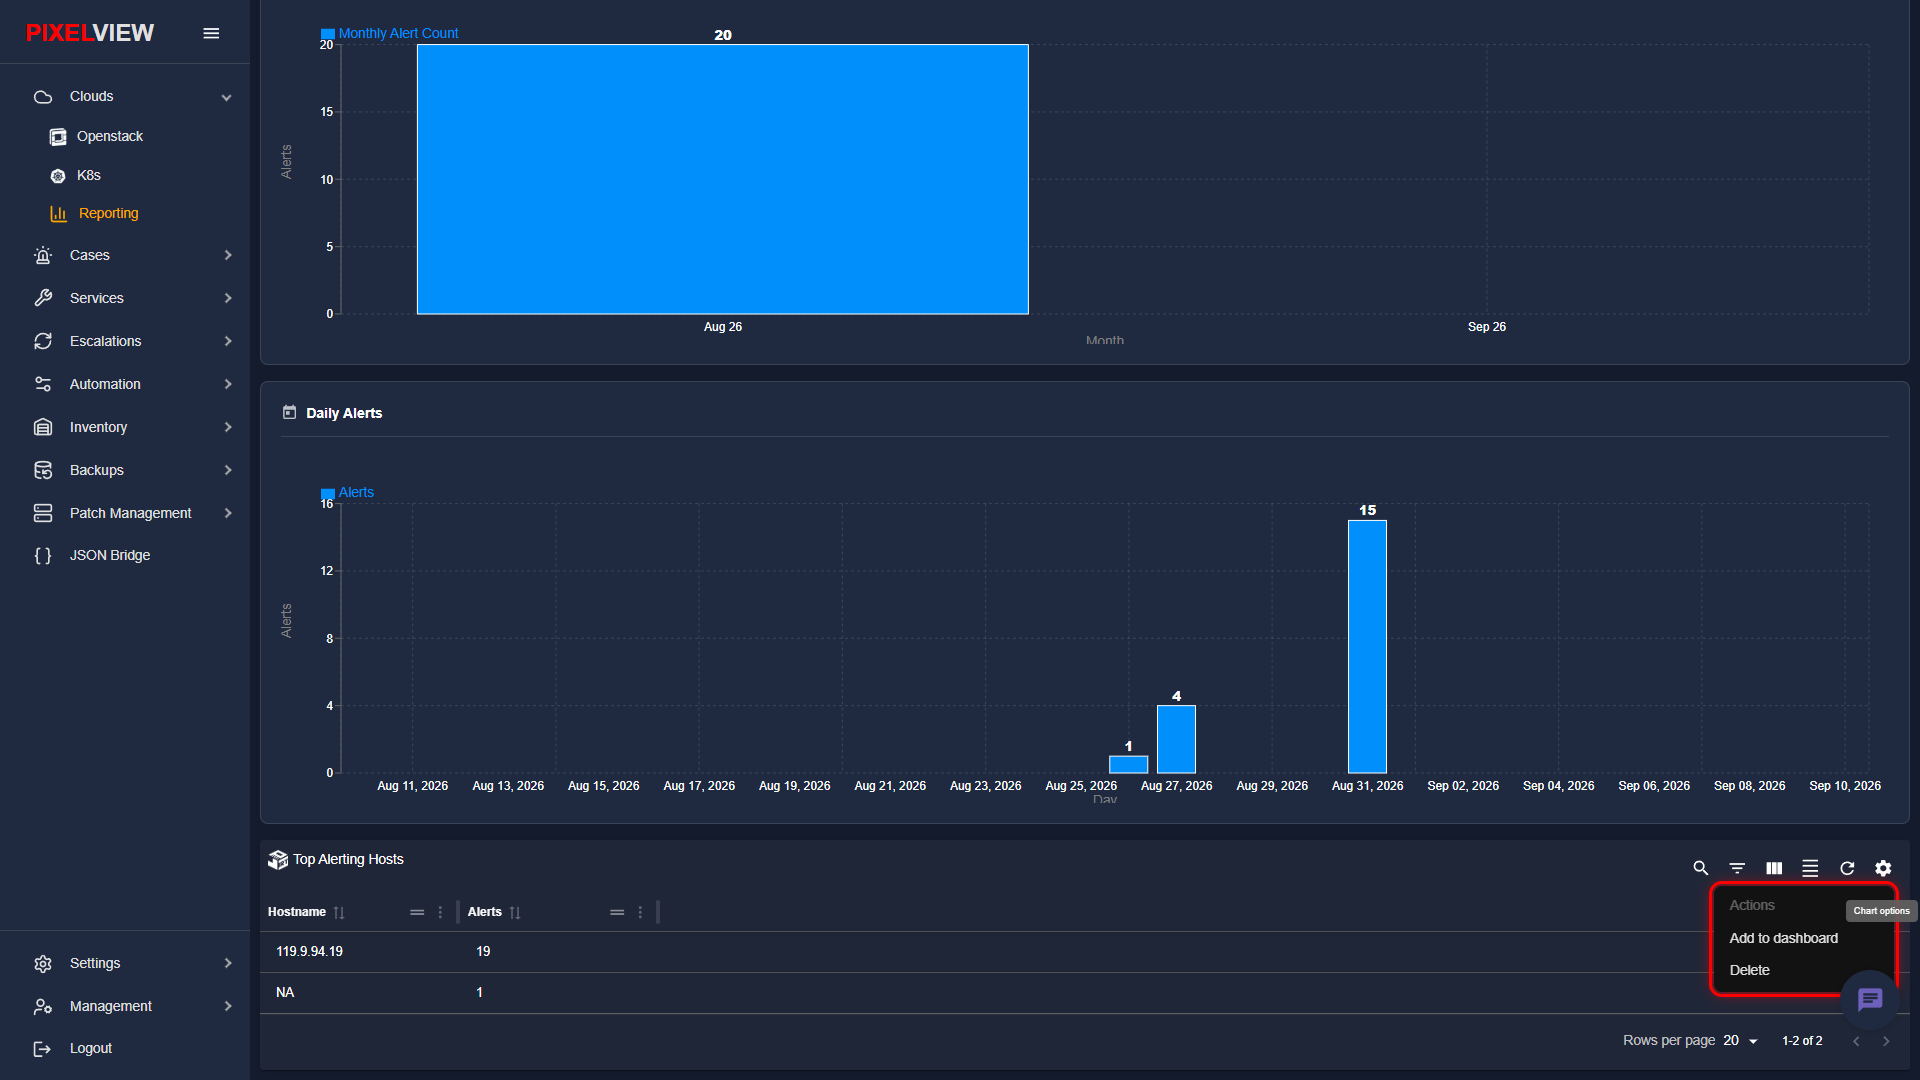
- Add to Dashboard: Pins the Top Alerting Hosts table widget directly to the user's customized overview dashboard for permanent real-time monitoring.
- Delete: Removes or hides the widget card from the current reporting view.