Prometheus Alertmanager Integration
Prometheus and Alertmanager form the core metrics collection and threshold-alerting pipeline for cloud-native infrastructure. Integrating Prometheus Alertmanager with PixelView allows engineering teams to automatically route firing alerts directly into PixelView's incident management, escalation engine, and on-call notification channels.
Integration Overview
The integration functions through authenticated HTTP webhook endpoints: * Prometheus evaluates alert rules against scraped time-series metrics. * When thresholds are breached, Alertmanager groups, deduplicates, and dispatches an alert payload to the PixelView webhook receiver. * PixelView authenticates the incoming payload using a unique Service Key, normalizes the alert labels, and creates an incident case. * If an escalation policy is bound to the service, notification trees and automated remediation workflows execute immediately.
Configuration on PixelView
Creating the Prometheus Service
To register Prometheus as an alerting source:
- In the primary navigation sidebar, navigate to Services → All Services:
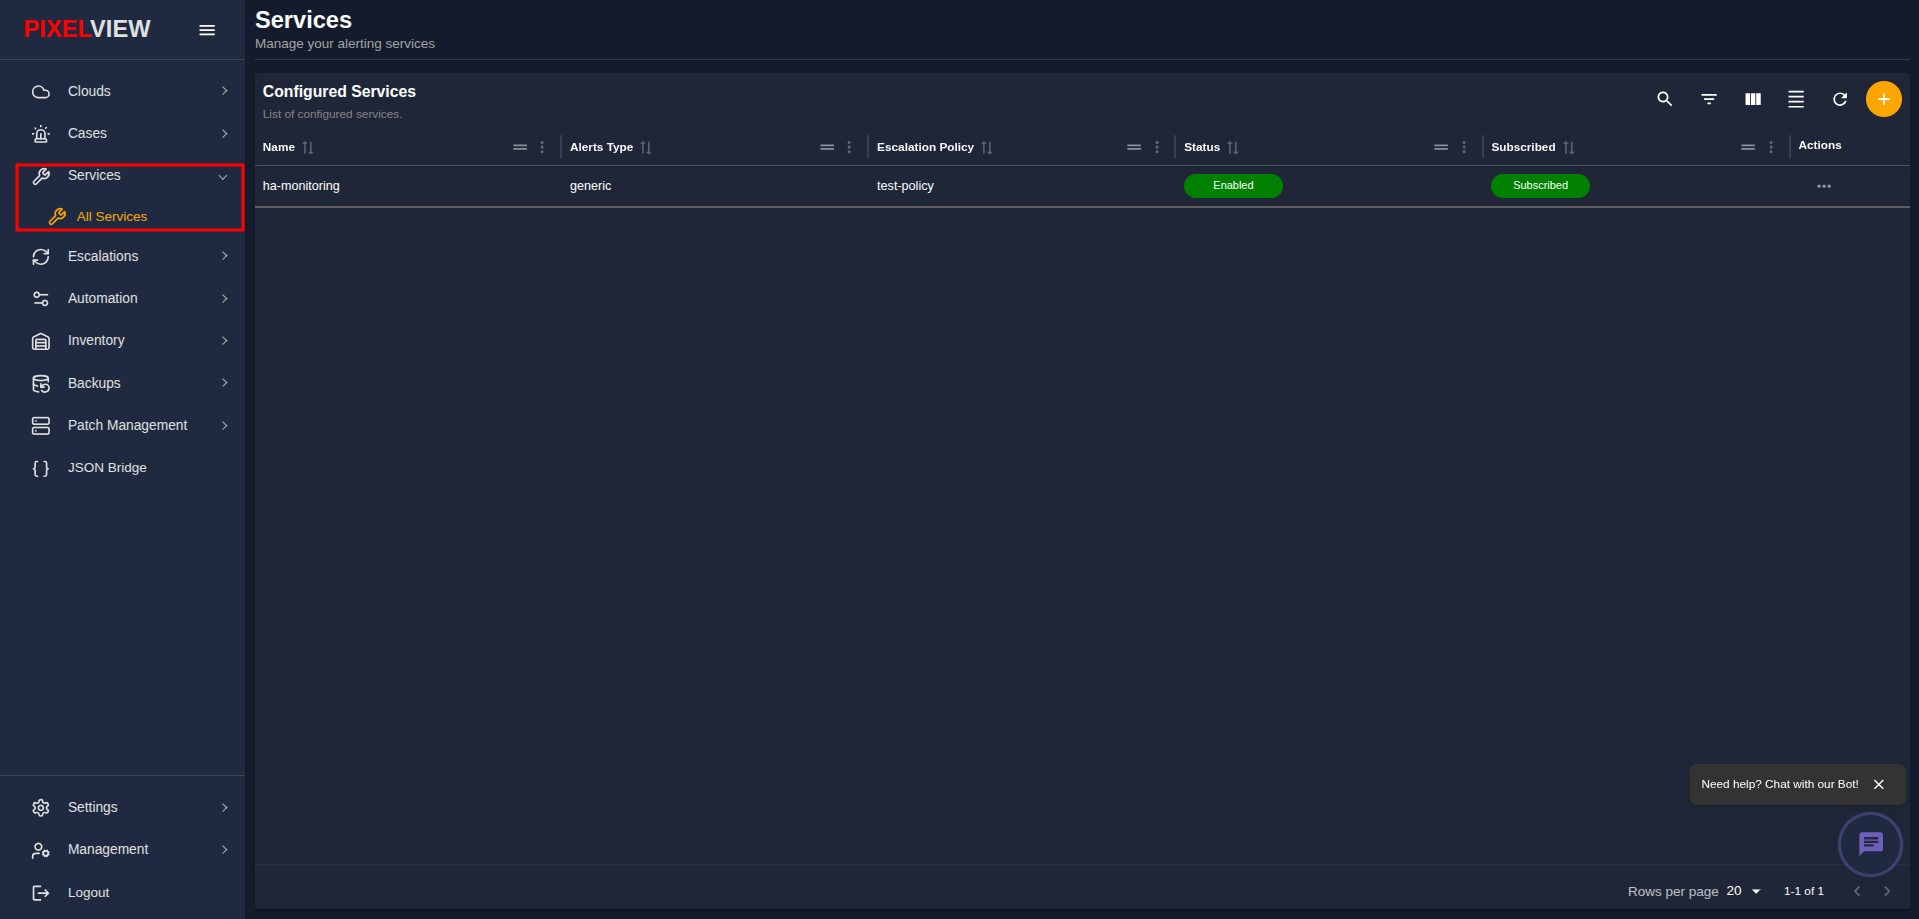
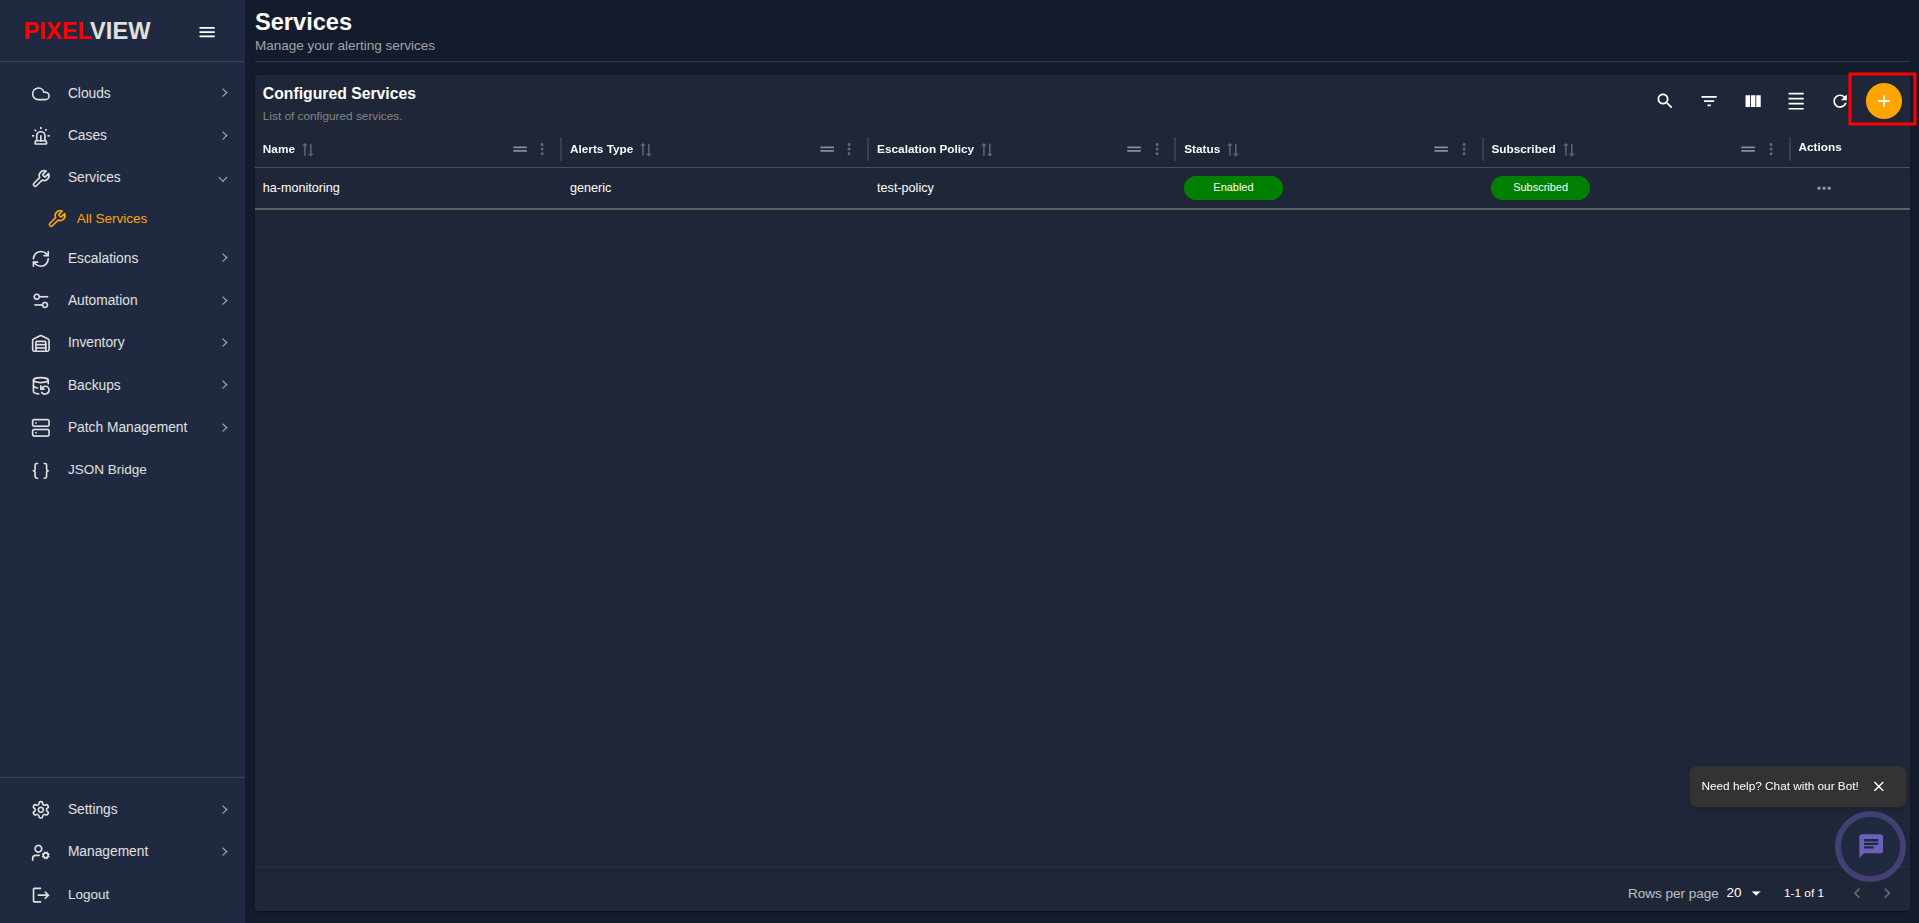
- Click the orange
+(Add Service) button on the top-right toolbar:
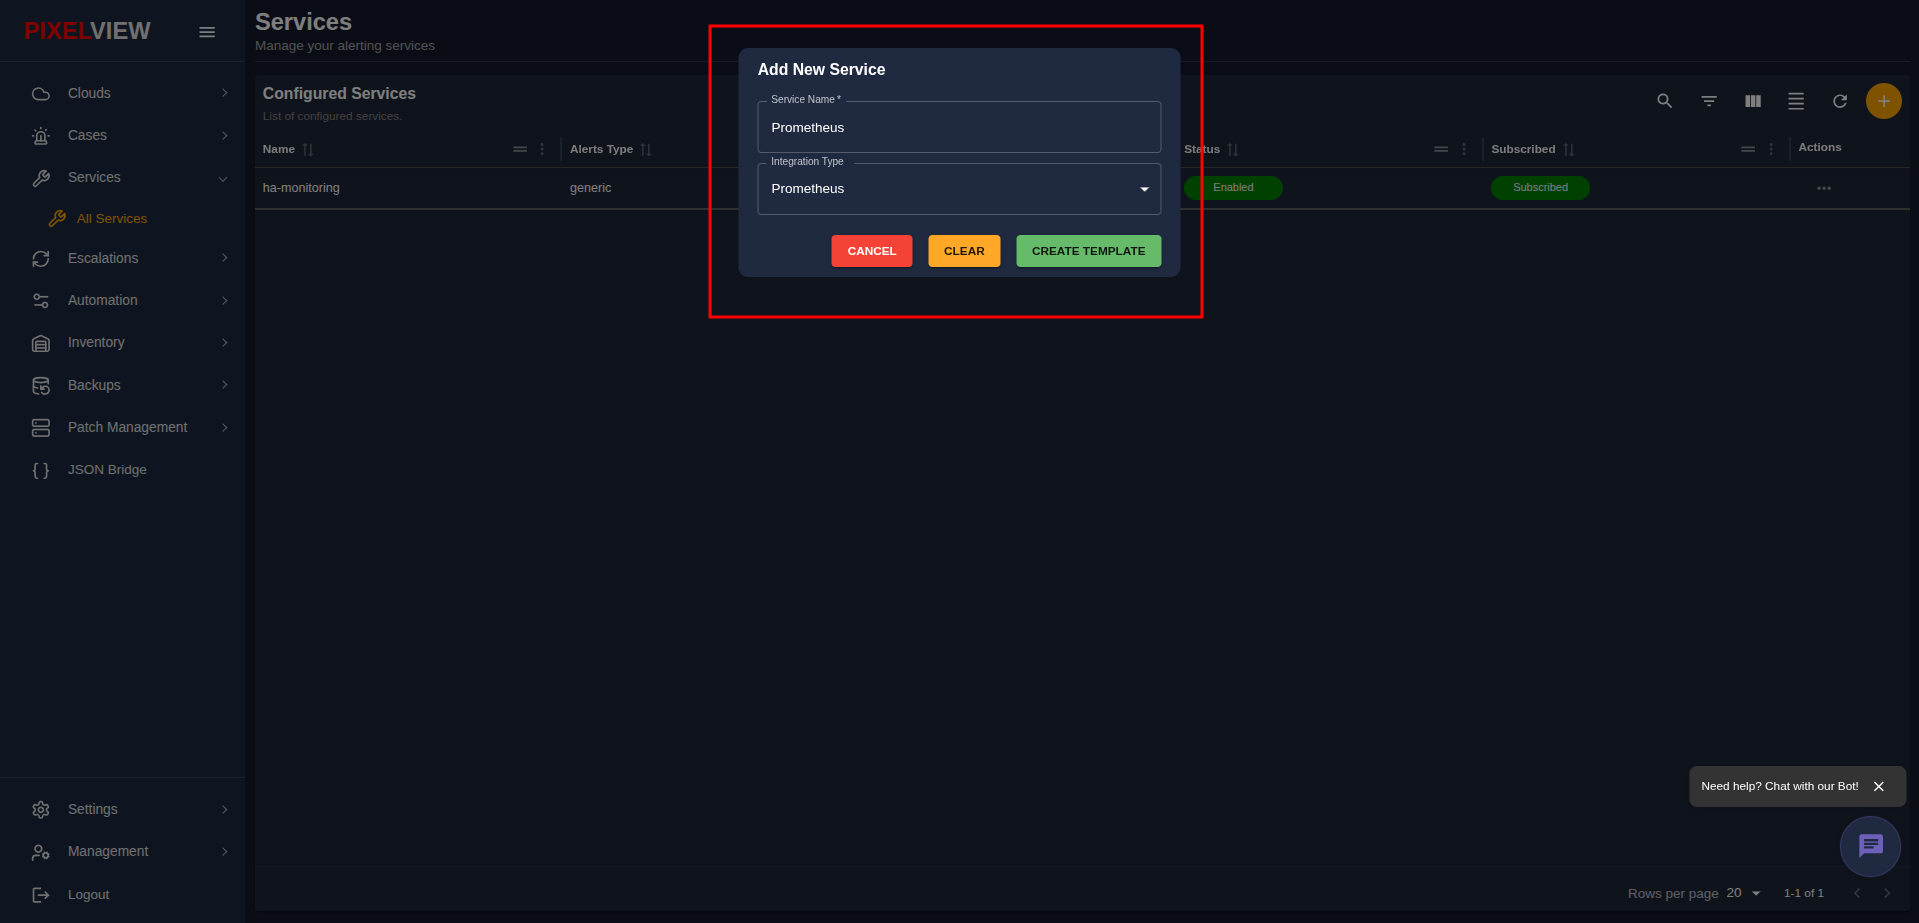
- In the Add New Service dialog:
- Enter a descriptive Service Name (e.g.,
k8s-prometheus-prod,infra-monitoring). - In the Integration Type dropdown, select Prometheus.
- Click CREATE TEMPLATE:
- Enter a descriptive Service Name (e.g.,
Copying the Service Key
Each registered service is provisioned with a cryptographic unique identifier used to authenticate incoming webhooks:
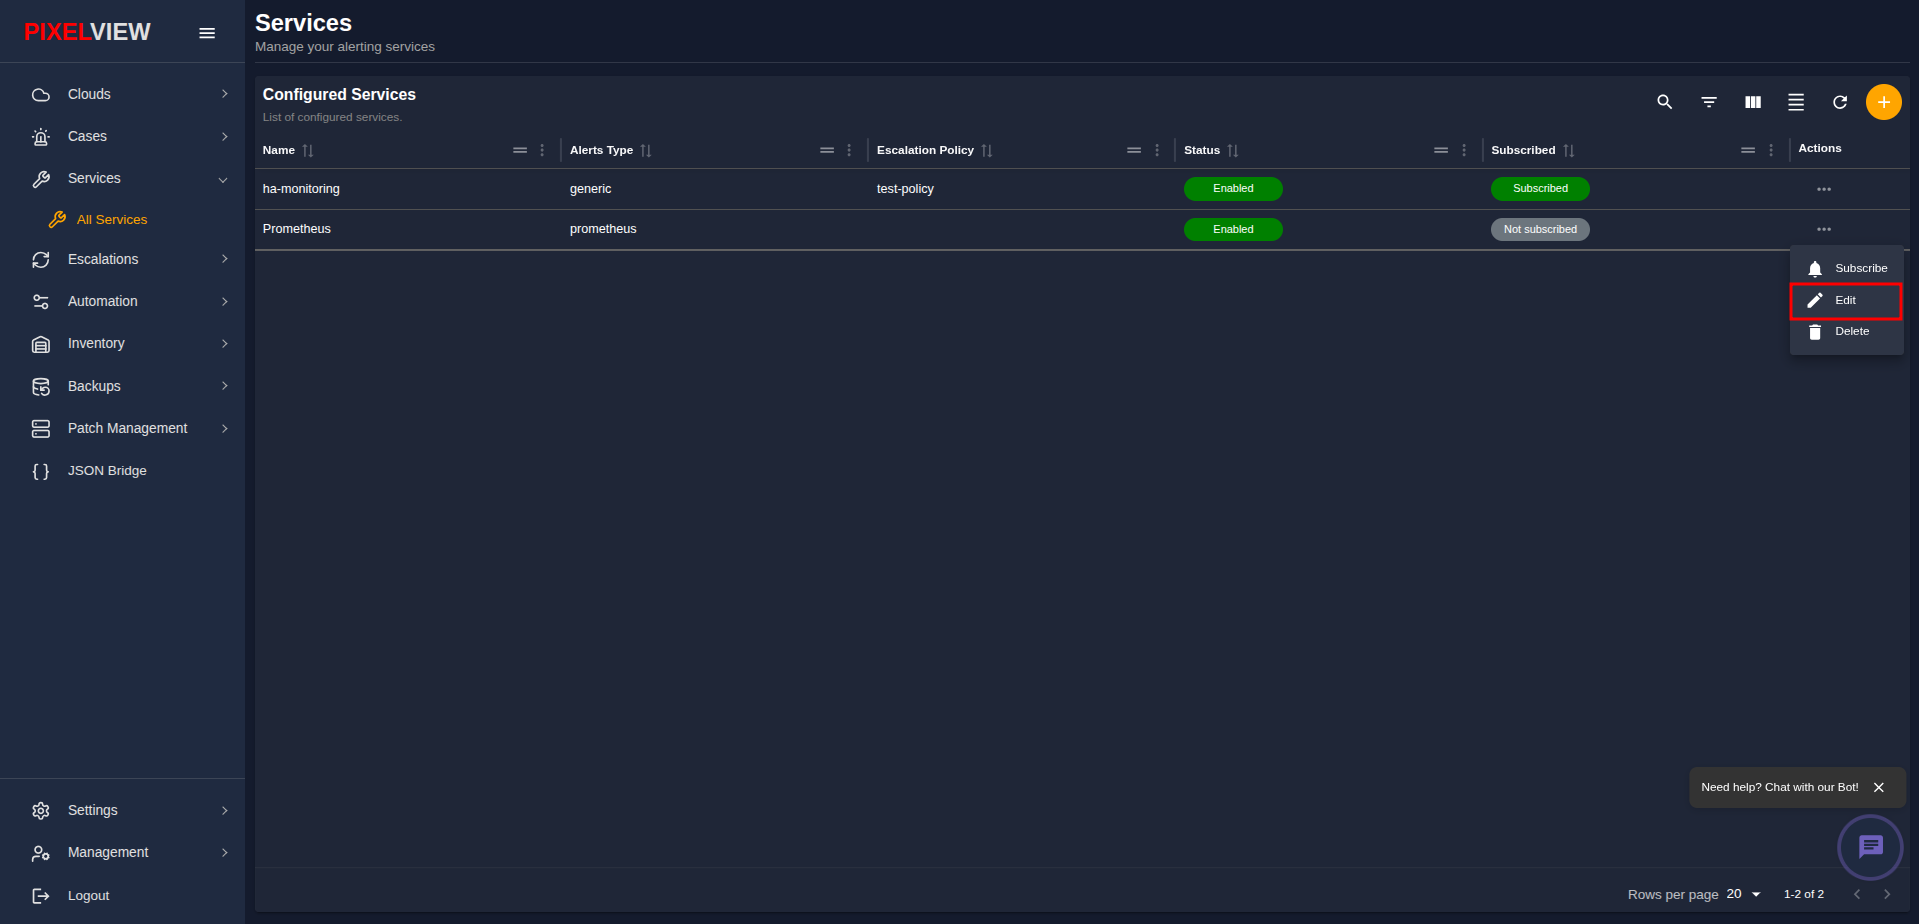
- In the All Services table, locate your newly created Prometheus service.
- Click the action menu (
...) in the Actions column and select Edit:
- In the Edit Service modal, locate the Service Key field and click the Copy icon to copy the key to your clipboard:
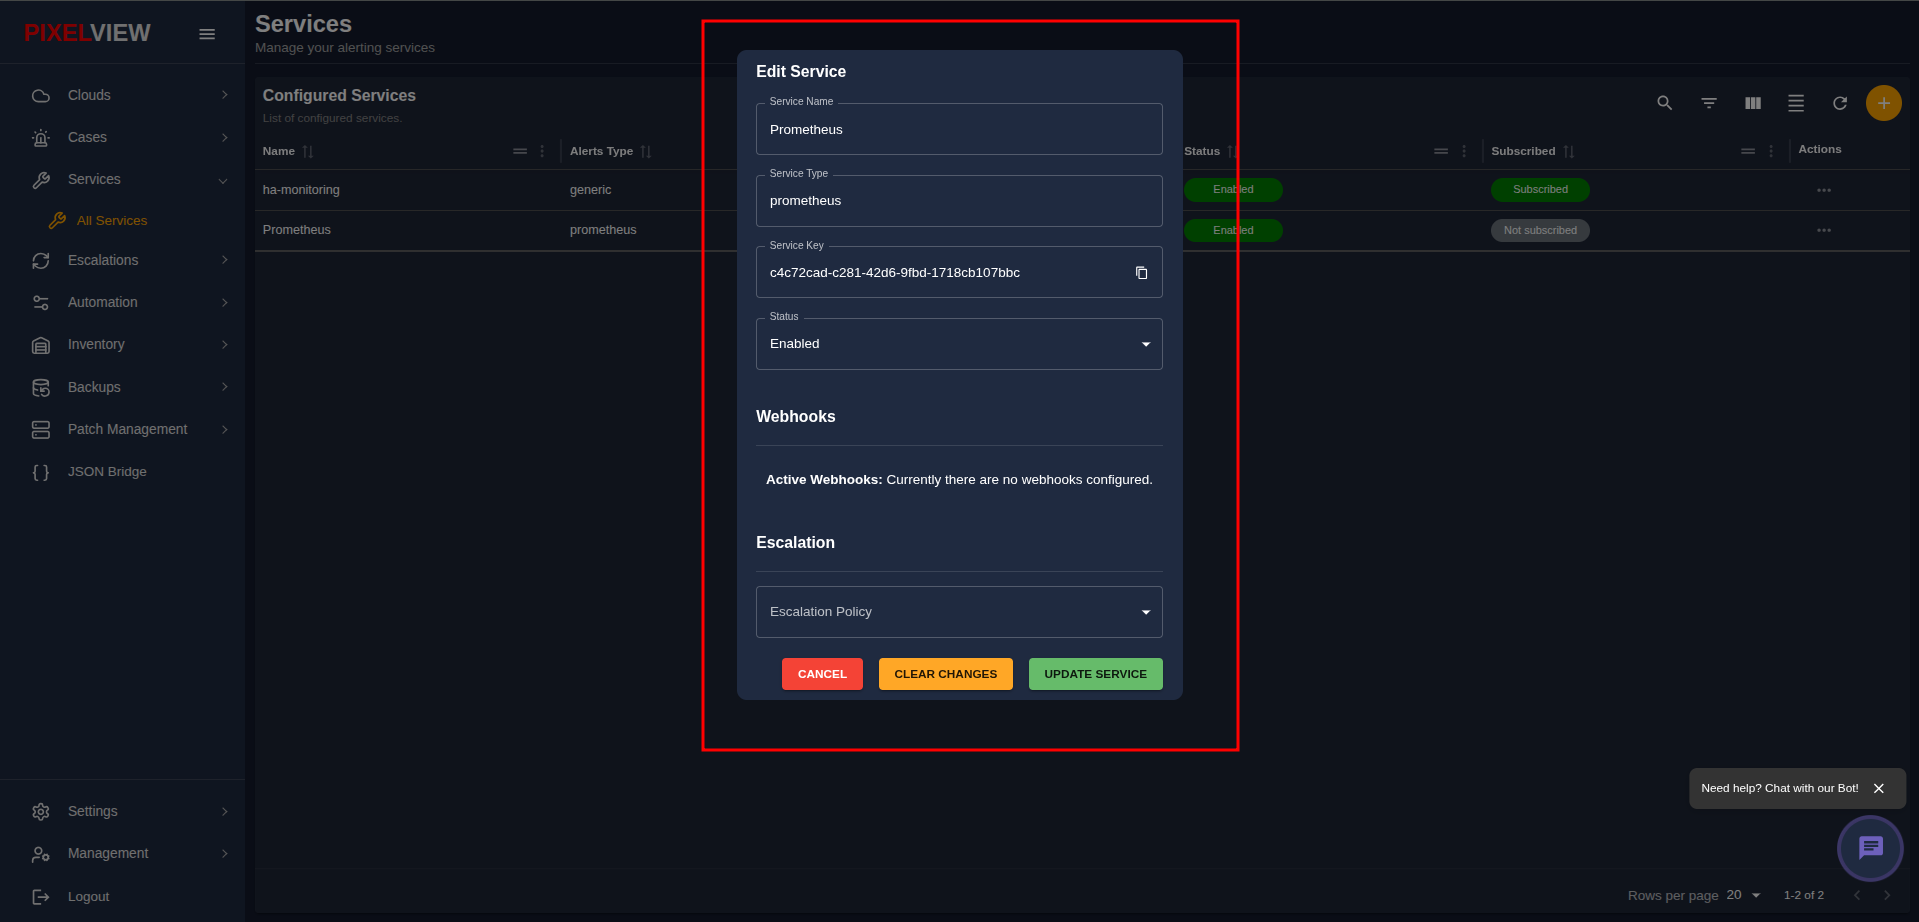
- Click Cancel to close the modal without modifying existing settings.
Subscribing to Alert Notifications
To ensure you receive direct notifications when alerts trigger on this service:
- In the Actions column (
...), click Subscribe:
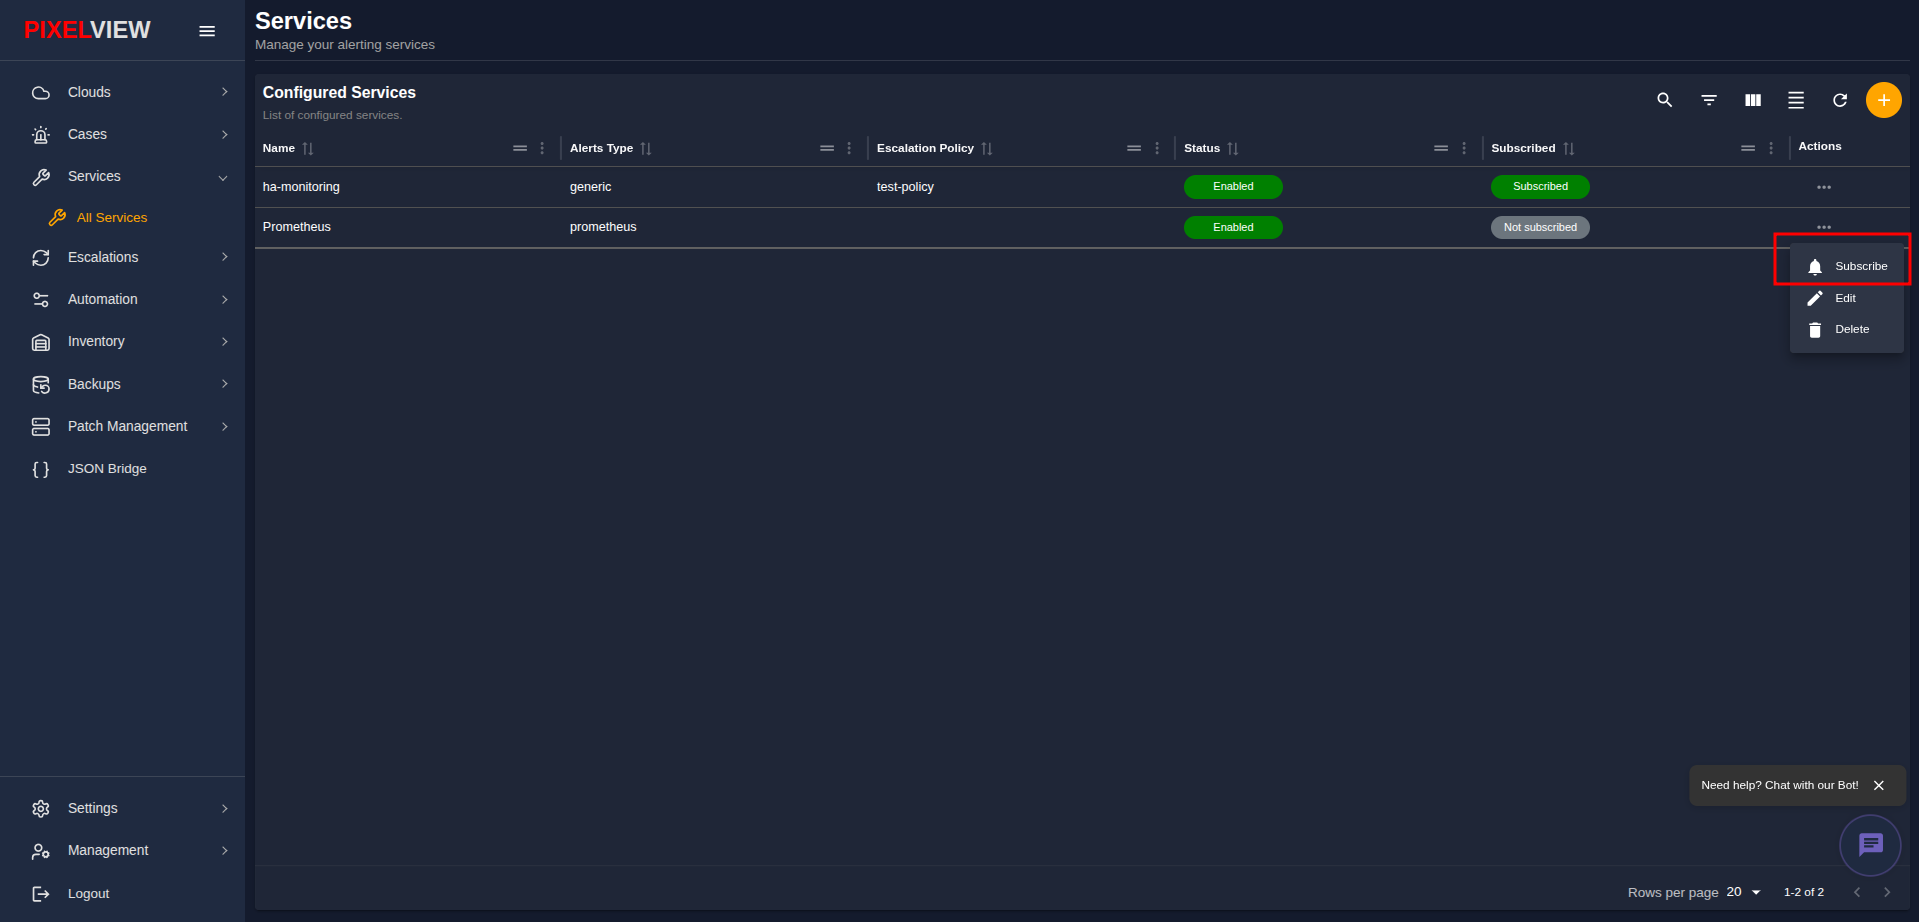
- The subscription status badge updates to Subscribed (green).
Configuring Prometheus Alertmanager
Alertmanager Configuration File (alertmanager.yml)
Add a dedicated webhook receiver to your Alertmanager configuration file (/etc/alertmanager/alertmanager.yml or Kubernetes ConfigMap):
global:
  resolve_timeout: 5m

route:
  group_by: ['alertname', 'cluster', 'service', 'instance']
  group_wait: 30s
  group_interval: 5m
  repeat_interval: 12h
  receiver: 'pixelview-webhook'

receivers:
  - name: 'pixelview-webhook'
    webhook_configs:
      - url: 'http://<pixelview-host>/webhook/prometheus?servicekey=<service_key>'
        send_resolved: true
        http_config:
          follow_redirects: true
Important
- Replace
<pixelview-host>with the fully qualified domain name or IP address of your PixelView instance (e.g.,cloud.pixelvirt.com). - Replace
<service_key>with the exact unique UUID copied from the PixelView service edit dialog. - Enabling
send_resolved: trueensures that when metrics return below thresholds, Alertmanager sends a resolution event that automatically marks the incident as resolved in PixelView.
Reloading Alertmanager Configuration
Apply the updated configuration by sending an HTTP POST request to Alertmanager's reload endpoint:
Or restart the service daemon via systemd:
Production PromQL Alerting Rules Library
To maximize operational visibility, configure standard production alerting rules in your Prometheus rule files (rules.yml):
| Alert Name | PromQL Expression | Severity | Description |
|---|---|---|---|
HostHighCpuSaturation |
100 - (avg by(instance) (rate(node_cpu_seconds_total{mode="idle"}[5m])) * 100) > 85 |
warning |
Sustained CPU utilization exceeds 85% for more than 5 minutes on the specified host. |
HostMemoryExhaustion |
(node_memory_MemAvailable_bytes / node_memory_MemTotal_bytes) * 100 < 10 |
critical |
Available system memory drops below 10% of physical capacity. |
PredictiveDiskExhaustion |
predict_linear(node_filesystem_free_bytes{mountpoint="/"}[1h], 4 * 3600) < 0 |
critical |
Root filesystem is projected to run out of storage space within the next 4 hours based on recent consumption trends. |
K8sPodCrashLooping |
rate(kube_pod_container_status_restarts_total[15m]) * 60 > 2 |
warning |
Kubernetes container pod is restarting rapidly due to application crash loops. |
ServiceEndpointDown |
up == 0 |
critical |
Monitored Prometheus scrape target or exporter daemon is unreachable or down. |
Alert Field Mapping to PixelView Cases
When Alertmanager delivers an alert payload to PixelView, incoming fields are mapped automatically into incident attributes:
| Alertmanager Field | PixelView Case Field | Operational Impact |
|---|---|---|
labels.alertname |
Case Title | Primary identification tag displayed in the open cases registry. |
labels.severity |
Case Severity | Mapped directly to incident severity badges (critical, warning, info). |
labels.instance |
Affected Host | Links the incident directly to physical or virtual inventory hosts in PixelView. |
annotations.summary |
Brief Summary | Quick incident description shown in list views and mobile notifications. |
annotations.description |
Detailed Description | Full technical explanation, threshold values, and metric queries visible in the case detail view. |
status (firing / resolved) |
Case Status | Controls whether a case is marked Open or automatically transitioned to Resolved. |
Verification & Webhook Testing
Testing Delivery with cURL
You can simulate a test Alertmanager alert dispatch using curl to verify network connectivity and Service Key authentication:
curl -X POST "http://<pixelview-host>/webhook/prometheus?servicekey=<service_key>" \
  -H "Content-Type: application/json" \
  -d '[
    {
      "status": "firing",
      "labels": {
        "alertname": "TestAlertConnectivity",
        "severity": "warning",
        "instance": "test-host-01"
      },
      "annotations": {
        "summary": "Manual webhook verification test",
        "description": "Verifying delivery between Alertmanager and PixelView."
      },
      "startsAt": "2026-09-10T16:00:00Z"
    }
  ]'
Verification Checklist
- Case Creation: Navigate to Cases → Open Cases to confirm the
TestAlertConnectivityincident appears. - Notification Dispatch: If subscribed, verify you received a notification bell alert or outbound webhook forward.
- Inspect Alertmanager Logs: If alerts fail to appear, inspect Alertmanager journal logs for delivery errors: