Automation Executions
The Executions section (/executions) under Automation provides a centralized execution console and real-time observability engine for all automated workflows, Ansible playbooks, and Python scripts across PixelView.
Operators can dispatch ad-hoc or scheduled jobs across multi-cloud infrastructure, monitor live task execution via Server-Sent Events (SSE) log streams, inspect granular task telemetry, and re-run failed jobs with automated retry management.
Navigating to Executions
To access automation jobs and execution histories:
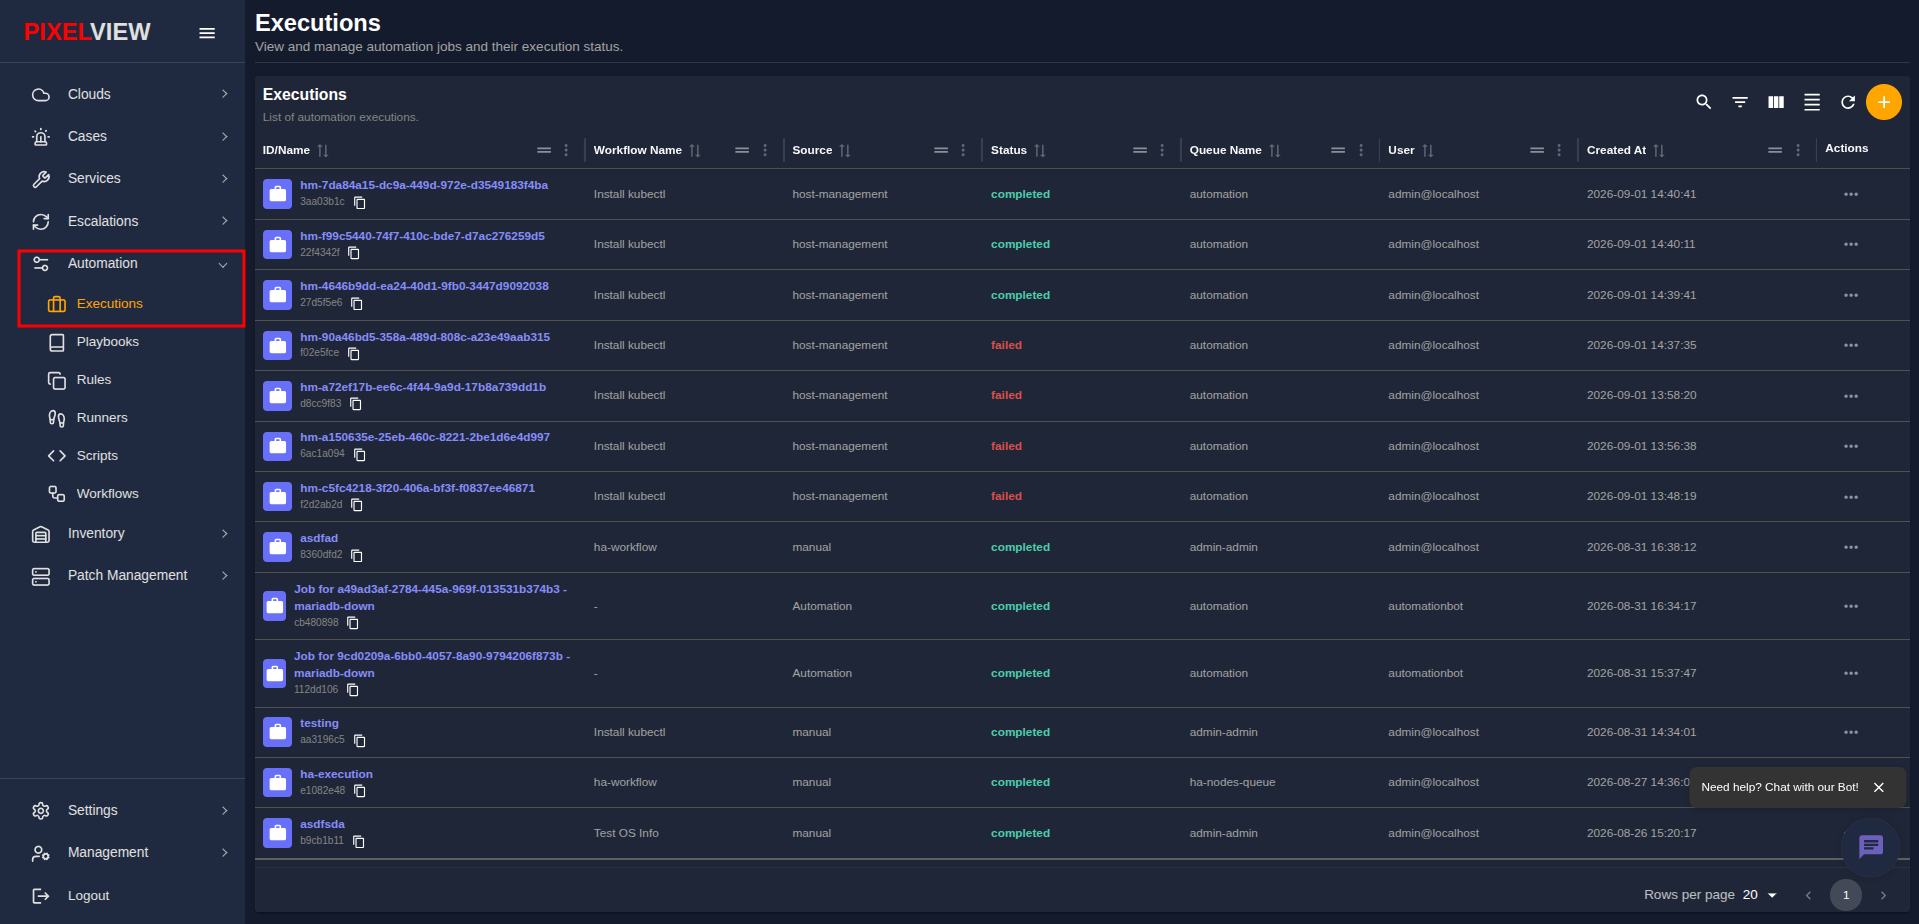
- In the left navigation sidebar under Automation, click Executions:
Executions Table Overview
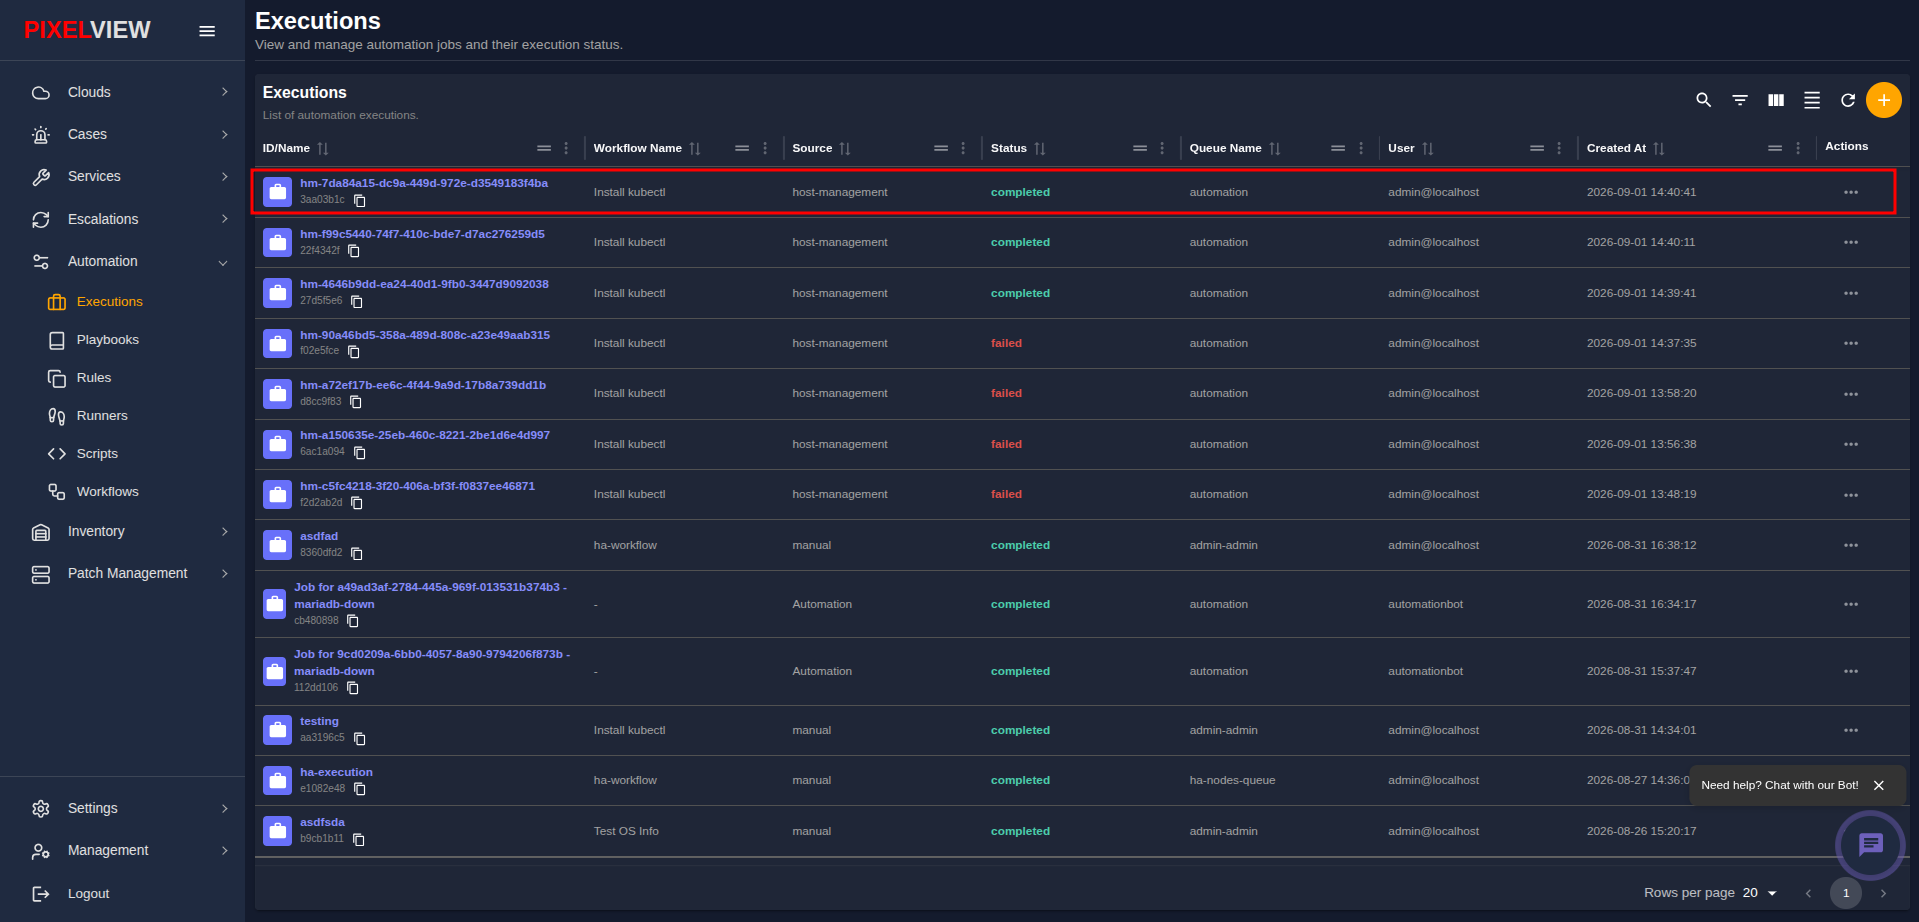
The main table lists all active and completed automation runs with 20-second background polling for synchronized real-time state tracking:
| Column | Description |
|---|---|
| ID/Name | Execution display name (e.g., hm-7da84a15..., testing) with a blue briefcase icon, clickable link to the detailed run dashboard, and copyable UUID chip. |
| Workflow Name | Name of the automation workflow executed (e.g., Install kubectl, ha-workflow, or - for standalone playbooks). |
| Source | Origin that dispatched the execution (host-management, manual, or Automation bot). |
| Status | Real-time execution status badge (completed in green, failed in red, running, retrying, or pending). |
| Queue Name | Dedicated runner or worker queue processing the execution (e.g., automation, admin-admin, ha-nodes-queue). |
| User | User account or automation bot that initiated the run (e.g., admin@localhost, automationbot). |
| Created At | Timestamp marking when the execution was dispatched (YYYY-MM-DD HH:mm:ss). |
| Actions | Context action menu (...) for retrying or deleting executions. |
Table Toolbar Controls
The top-right toolbar provides dynamic Material React Table controls:
- Search / Global Filter: Instant full-text search across all execution names, IDs, workflows, and queues.
- Column Filters: Filter records by specific field values.
- Show/Hide Columns: Toggle table column visibility.
- Density Toggle: Switch between compact and standard row spacing.
- Refresh: Manually re-fetch the latest execution listings.
- Create Execution (
+): Launch the new job execution modal.
Triggering an Execution (Create Jobs)
To manually dispatch a new automation run:
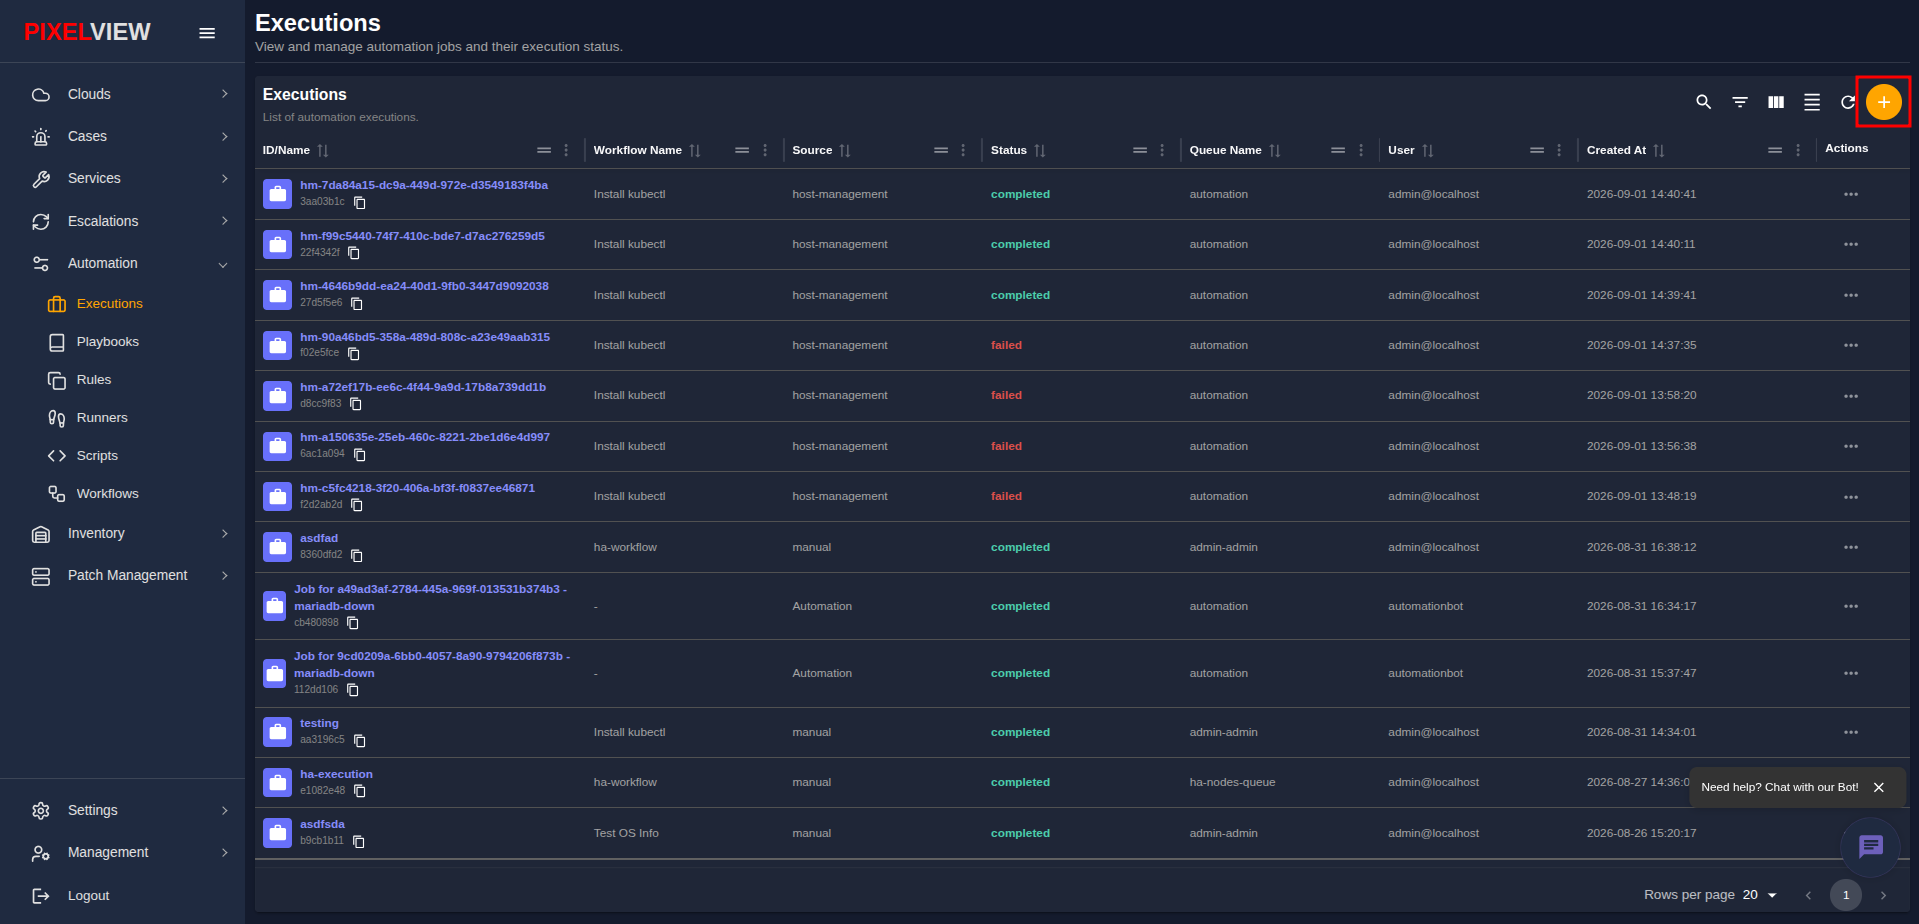
- Click the orange
+(Create Execution) button on the table toolbar:
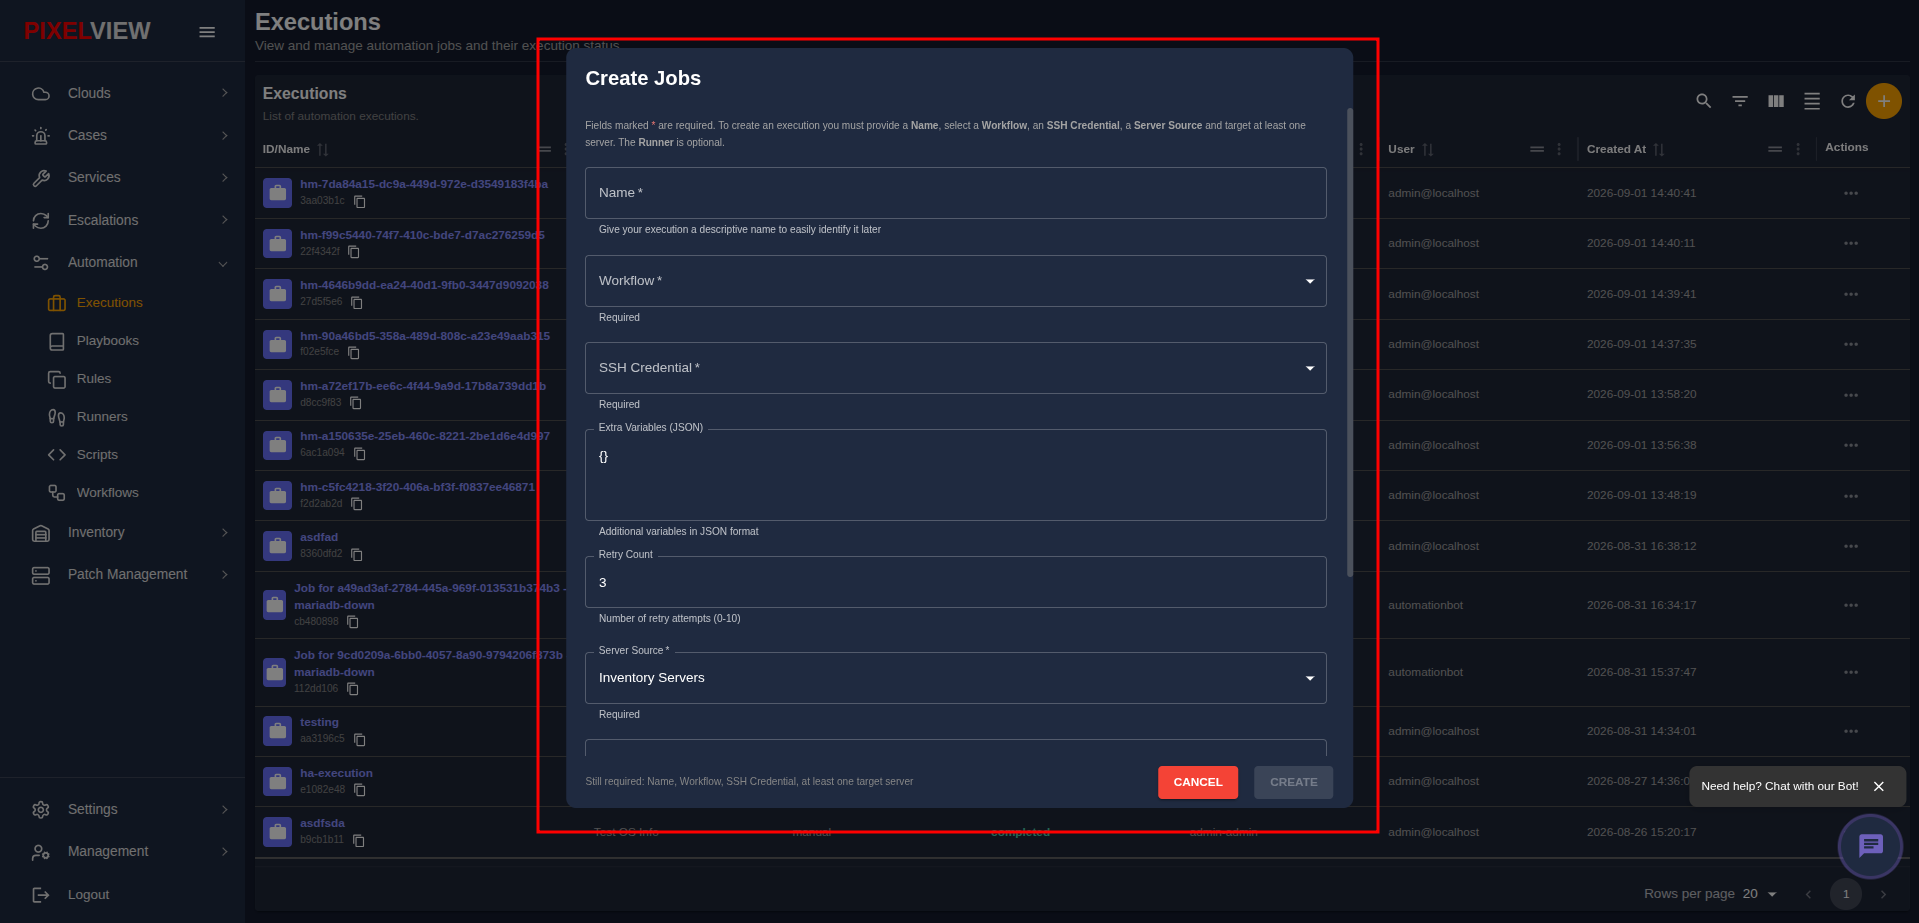
- The Create Jobs modal dialog will open:
Configuration Fields
- Name (Required): Enter a unique, recognizable identifier for the execution run (e.g.,
Weekly Patch Job - Sep 2024). - Workflow (Required): Select the automated workflow containing the playbooks or scripts to run.
- SSH Credential (Required): Choose the stored credential profile from Credentials Management to authenticate against target hosts.
- Extra Variables (JSON) (Optional): Supply custom runtime variables to the playbook or script in valid JSON format (default:
{}). - Retry Count (Default: 3): Configure maximum retry attempts upon task failure (range:
0to10). - Server Source (Required): Choose the inventory origin for target hosts:
- Inventory Servers: Target servers cataloged within PixelView's Cloud Catalogue.
- Cloud Servers: Query live compute instances directly from integrated cloud providers (e.g., OpenStack regions).
- Host Groups: Target pre-configured clusters defined in Host Groups Management.
- Runner (Optional): Select a specific runner instance from Runners, or leave unassigned to route automatically to the source-based queue.
- Cloud (Required): Select the target cloud environment or cluster hosting the desired nodes.
- Select Servers (Required): Select one or more target servers across available regions, or select all in bulk.
Dialog Actions
- CANCEL: Abort execution creation and close the dialog.
- CREATE: Submit and dispatch the execution to the assigned runner queue.
Managing Executions (Retry & Delete)
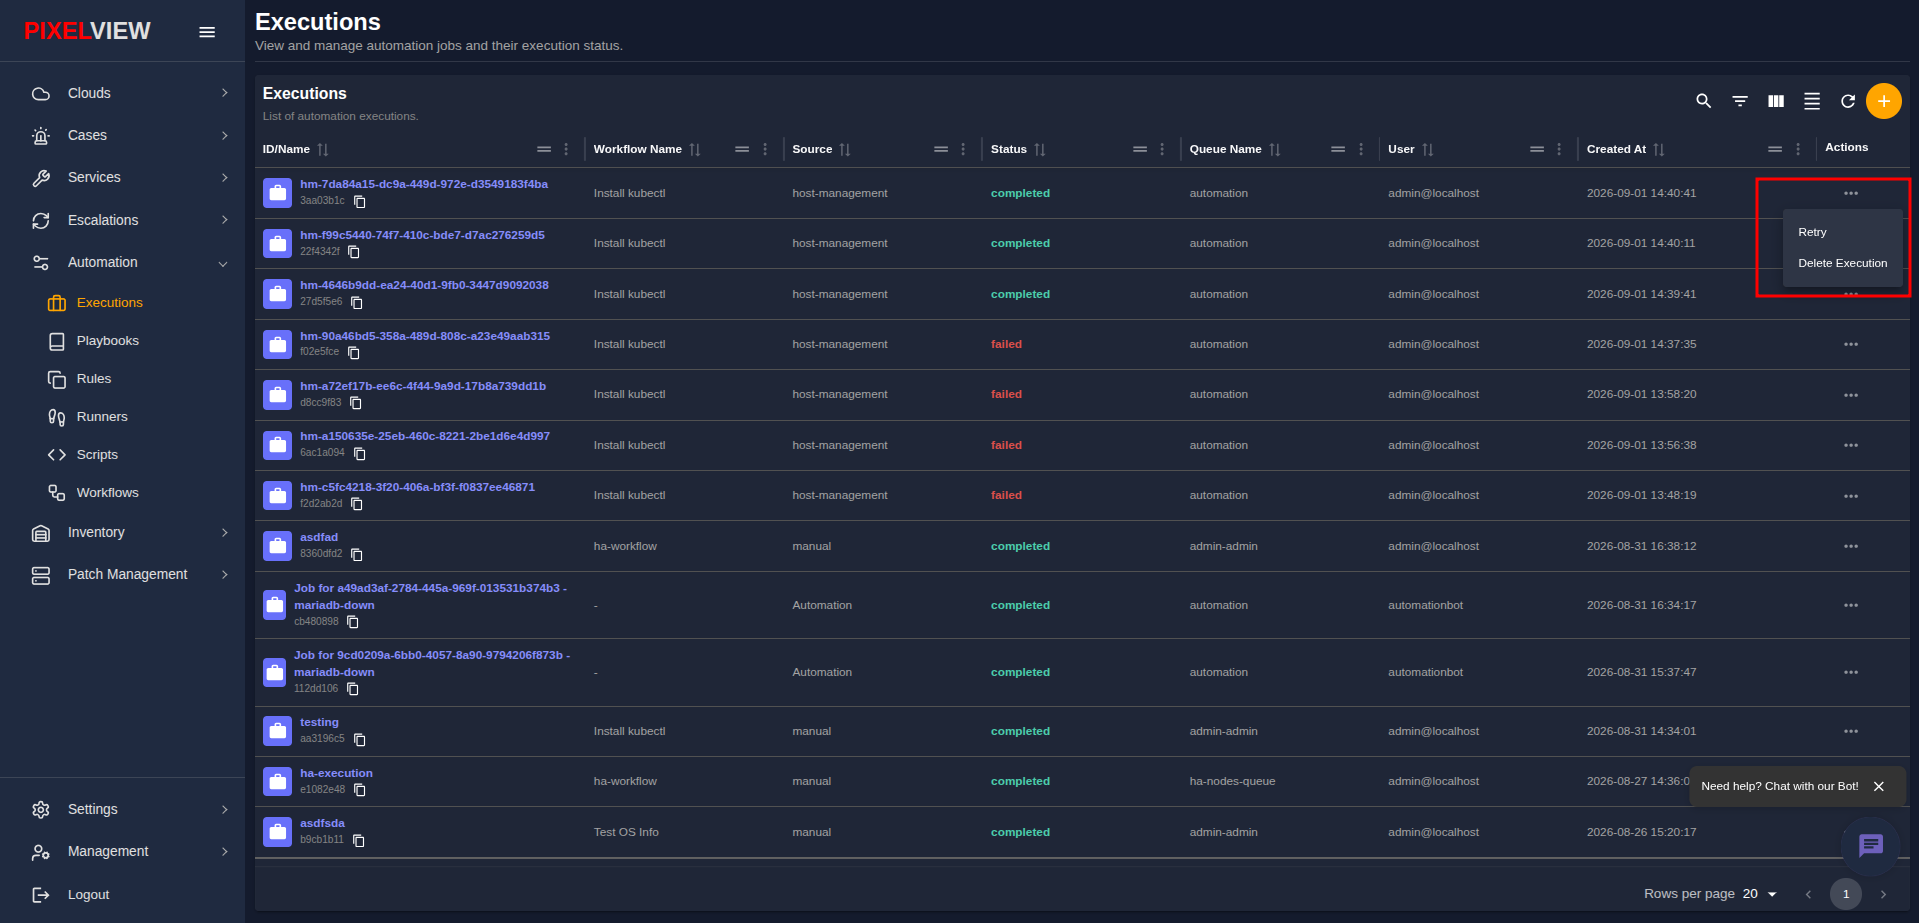
- Locate the target execution row in the table and click the Actions menu (
...):
Available Actions
- Retry: Re-runs the execution using the identical job configuration, host targets, and credentials. PixelView automatically appends
(retry)or(retry N)to the name to maintain a clean audit history. - Delete Execution: Prompts for confirmation (
Are you sure you want to delete the execution [name]?) and permanently removes the execution record and its associated job logs.
Inspecting Execution Details & Live Logs
To inspect per-host execution progress, playbook stdout/stderr, and runtime telemetry:
- Locate the execution row in the table (e.g.,
hm-7da84a15-dc9a...):
- Click on the execution name or ID link to open the Job Executions dashboard (
/executions/:id).
The dashboard displays the Jobs List on the left panel (listing all individual playbook or script jobs with status badges) and four detailed tabs on the right:
Details Tab
The DETAILS tab provides high-level run metadata and operational parameters:
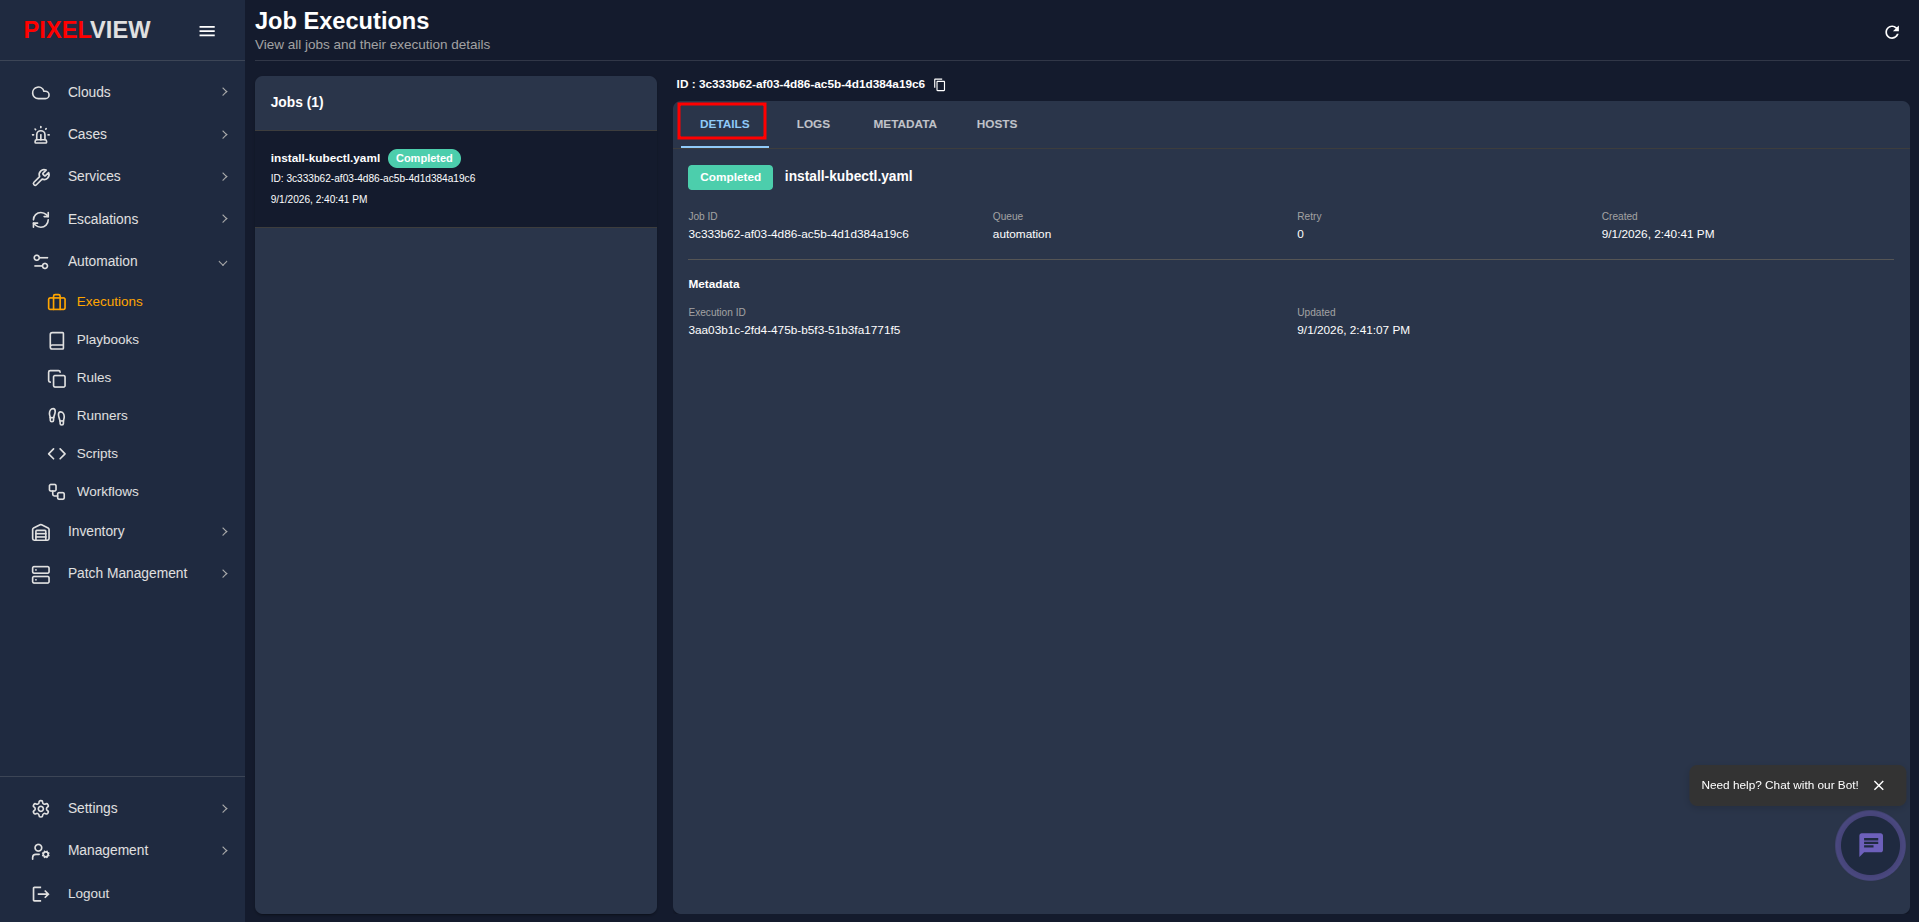
- Status Badge: Current status of the selected job (
Completed,Failed,Running, orPending). - Playbook / Script Name: The specific playbook or script executed (e.g.,
install-kubectl.yaml). - Job ID: Unique UUID identifier for the individual job with quick-copy control.
- Queue: Runner queue assigned to execute this job (e.g.,
automation). - Retry: Current retry attempt index (
0). - Timestamps: Exact creation and last updated timestamps.
- Execution ID: Parent execution identifier linking all concurrent jobs in this run.
Logs Tab (Real-Time SSE Stream)
The LOGS tab provides live, streaming console output of the execution:
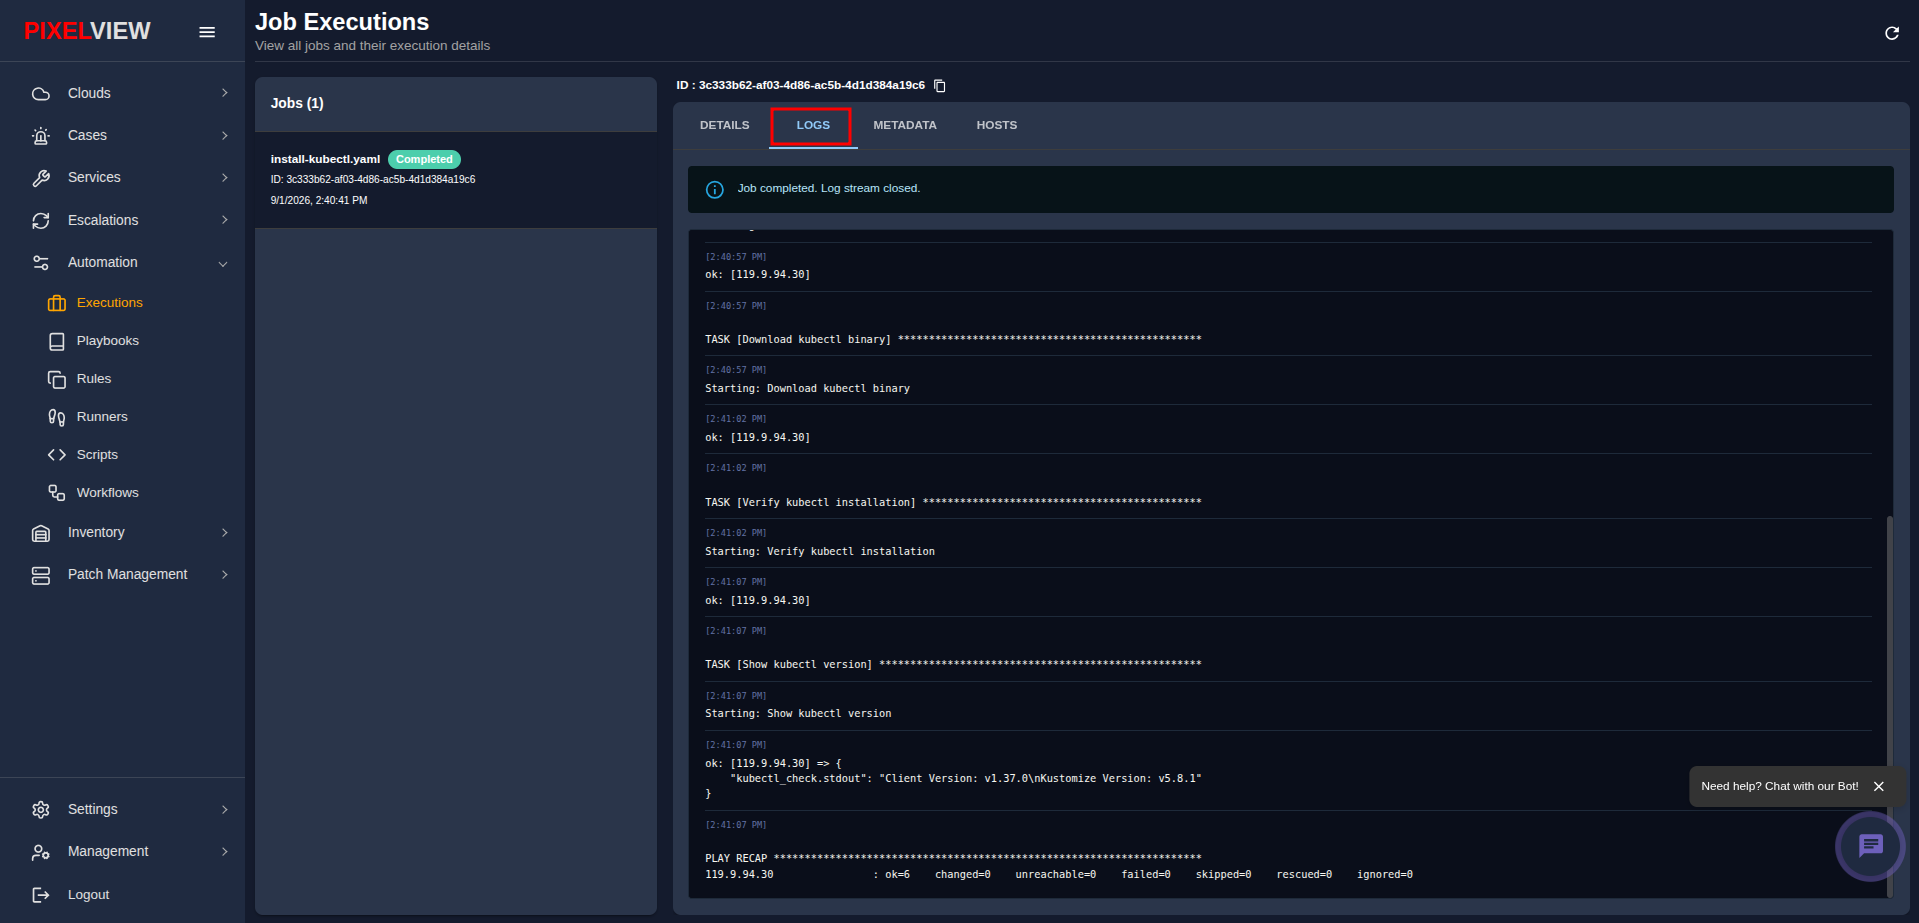
- Live Stream Alert: Displays active connection status (e.g., Job completed. Log stream closed.).
- Task-by-Task Execution: Real-time timestamps and Ansible task output:
- Task dispatch:
TASK [Download kubectl binary] - Host status:
ok: [119.9.94.30] - Task outputs & stdout:
TASK [Show kubectl version] => {"kubectl_version": "v1.37.0"}
- Task dispatch:
- PLAY RECAP: Complete end-of-playbook summary showing host status counters (
ok,changed,unreachable,failed,skipped,rescued,ignored).
Metadata Tab
The METADATA tab displays structured JSON telemetry for auditing and debugging:
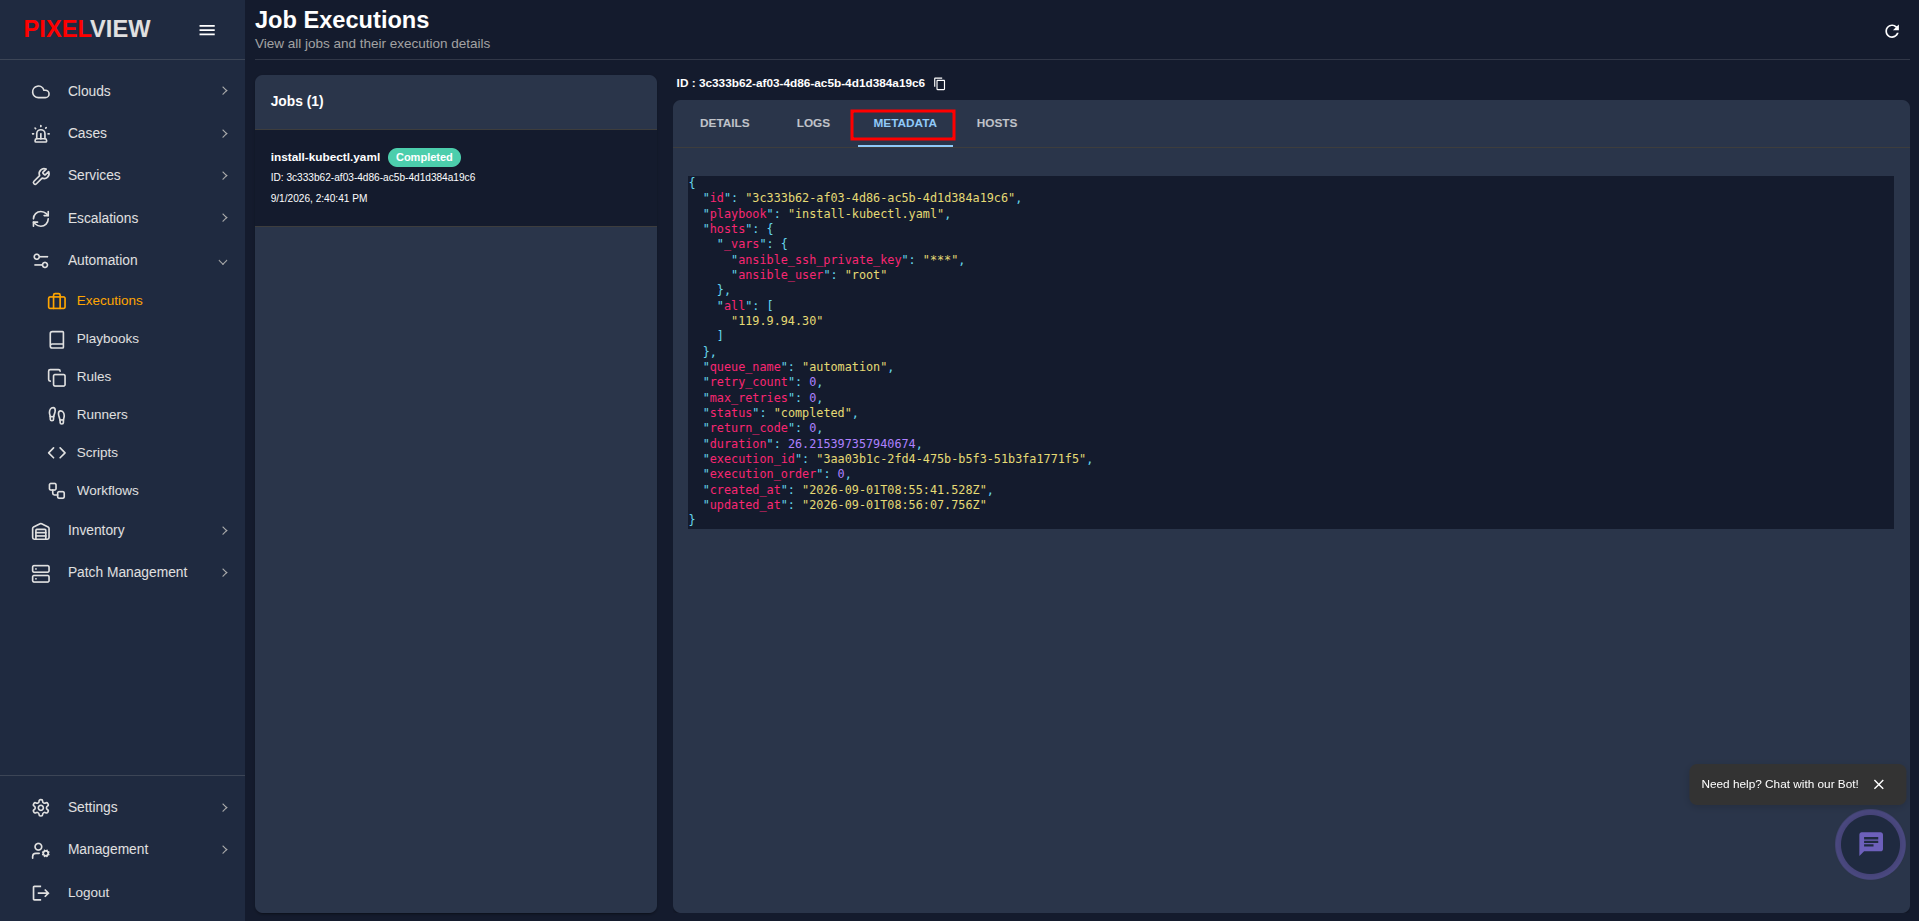
- Execution Configuration: Records
playbook,queue_name,retry_count, andmax_retries. - Execution Results: Displays
status,return_code(0for success), and total executiondurationin seconds. - Secret Protection: Sensitive authentication data (such as
ansible_ssh_private_key) is automatically masked with***in telemetry payloads.
Hosts Tab
The HOSTS tab displays the targeted host inventory configuration:
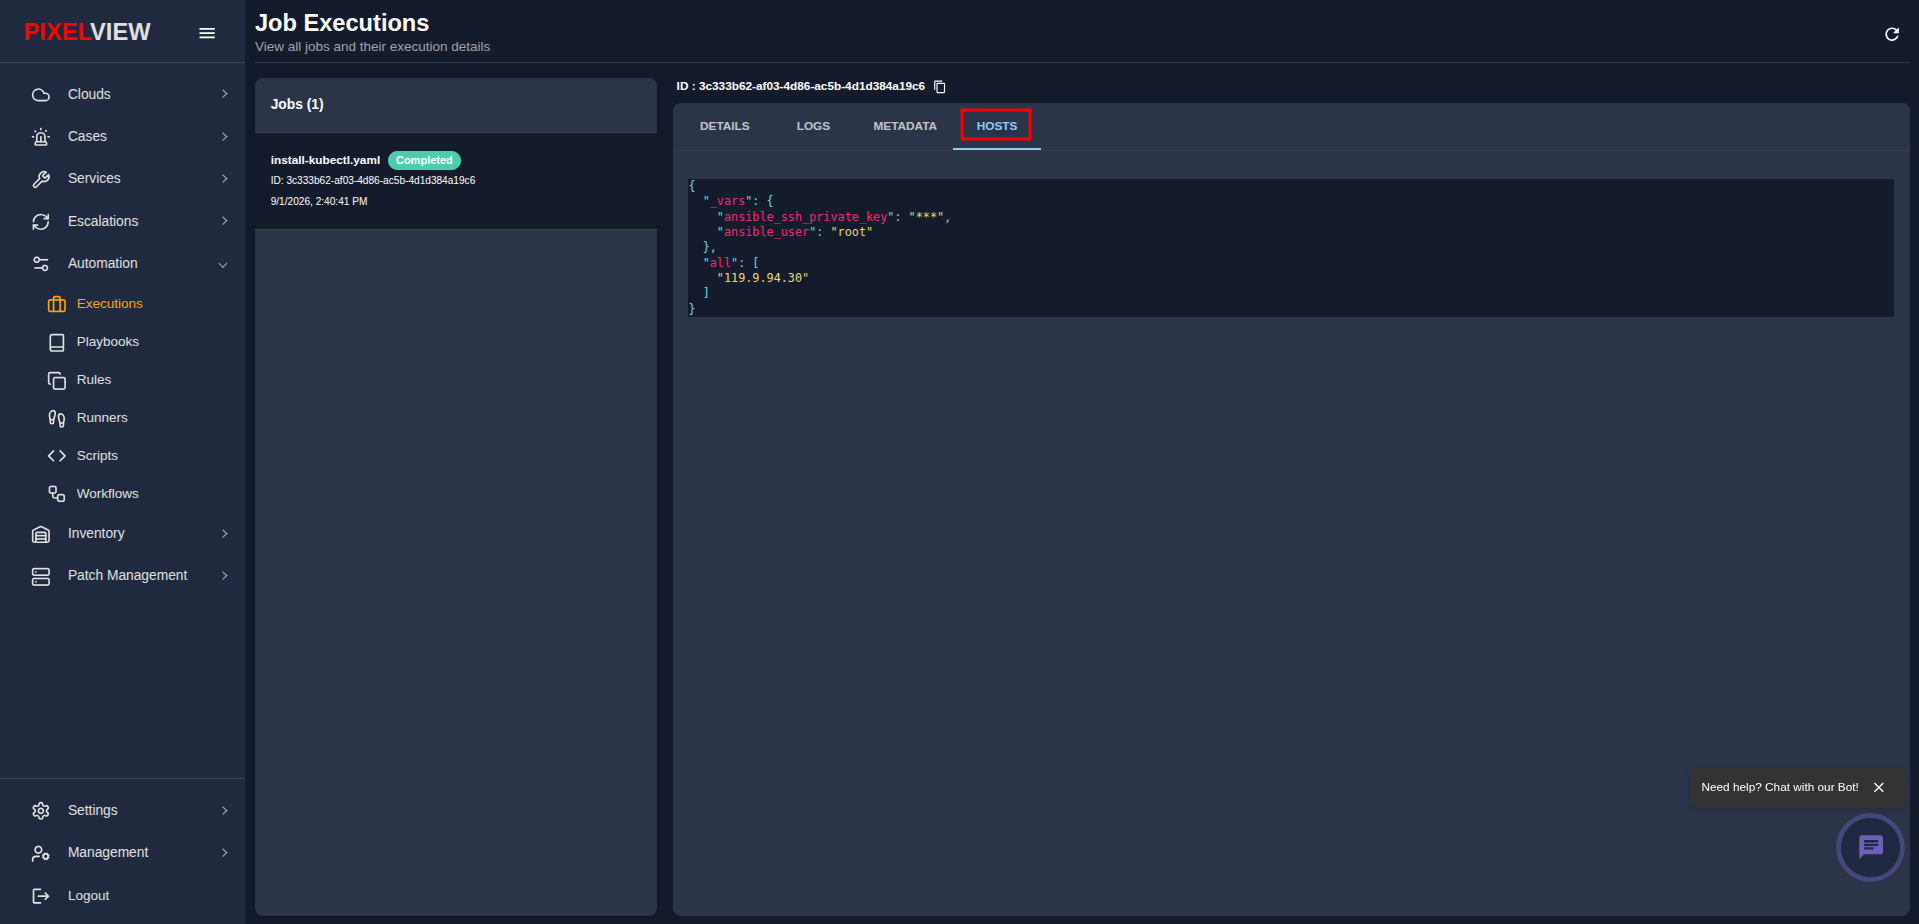
- Target Nodes: Array of all server IP addresses or hostnames targeted during the run (e.g.,
["119.9.94.30"]). - Host Variables: Connection variables, remote login user (
ansible_user: "root"), and port definitions.
Real-Time SSE Log Streaming & Retry Architecture
The execution dashboard provides sub-second terminal observability backed by an enterprise Server-Sent Events (SSE) streaming engine:
- Live Streaming Protocol: The frontend connects to the streaming endpoint via persistent HTTP SSE connections. As the runner daemon executes each Ansible task or Python command, output lines are published instantly without polling overhead.
- Automatic Stream Reconnection: If a temporary network interruption occurs between the browser and PixelView, the client automatically attempts reconnection with a 5000ms backoff interval, preserving previously rendered terminal history.
- Play Recap Metrics: Upon playbook conclusion, the runner emits a structured recap quantifying:
ok: Tasks executed where the target node was already in the desired state.changed: Tasks where modifications were actively applied to the system.unreachable: Target nodes that could not be reached via SSH or network transport.failed: Tasks that returned non-zero exit codes.skipped: Tasks bypassed due to conditionalwhenclauses.
- Retry Workflow: When a run encounters node failures, operators trigger Retry from the context menu. PixelView duplicates the exact configuration, creates a linked audit run tagged
(retry N), and dispatches it immediately to the assigned worker queue.