Kubernetes Cloud Orchestration
The Kubernetes module (/kubernetes) under Clouds provides centralized enterprise container orchestration, multi-cluster visibility, workload lifecycle management, and full-stack observability for Kubernetes environments within PixelView.
PixelView integrates natively with Kubernetes APIs to deliver complete management across all core primitives:
* Workloads: High-level and low-level container orchestration including Pods, Deployments, ReplicaSets, DaemonSets, StatefulSets, Batch Jobs, Scheduled CronJobs, and native KubeVirt Virtual Machines.
* Compute: Node inventory, hardware utilization (CPU, memory, storage allocations), and control-plane controllers.
* Storage: Dynamic Persistent Volume Claims (PVCs), cluster-wide Persistent Volumes (PVs), and storage class provisioners.
* Networking: L4 Services (ClusterIP, NodePort, LoadBalancer), Endpoints, Ingress routing controllers, and next-generation Gateway API resources.
* Configuration & Governance: Namespaces tenant isolation, ConfigMaps, sensitive Secrets, hard Resource Quotas, Horizontal Pod Autoscalers (HPA), and Pod Disruption Budgets (PDB).
* Observability & Topology: Live cluster event stream, Custom Resource Definitions (CRDs), Helm/Hub package integrations, and dynamic visual Graph topology maps.
Cluster Overview & Access Management
Navigating to Kubernetes
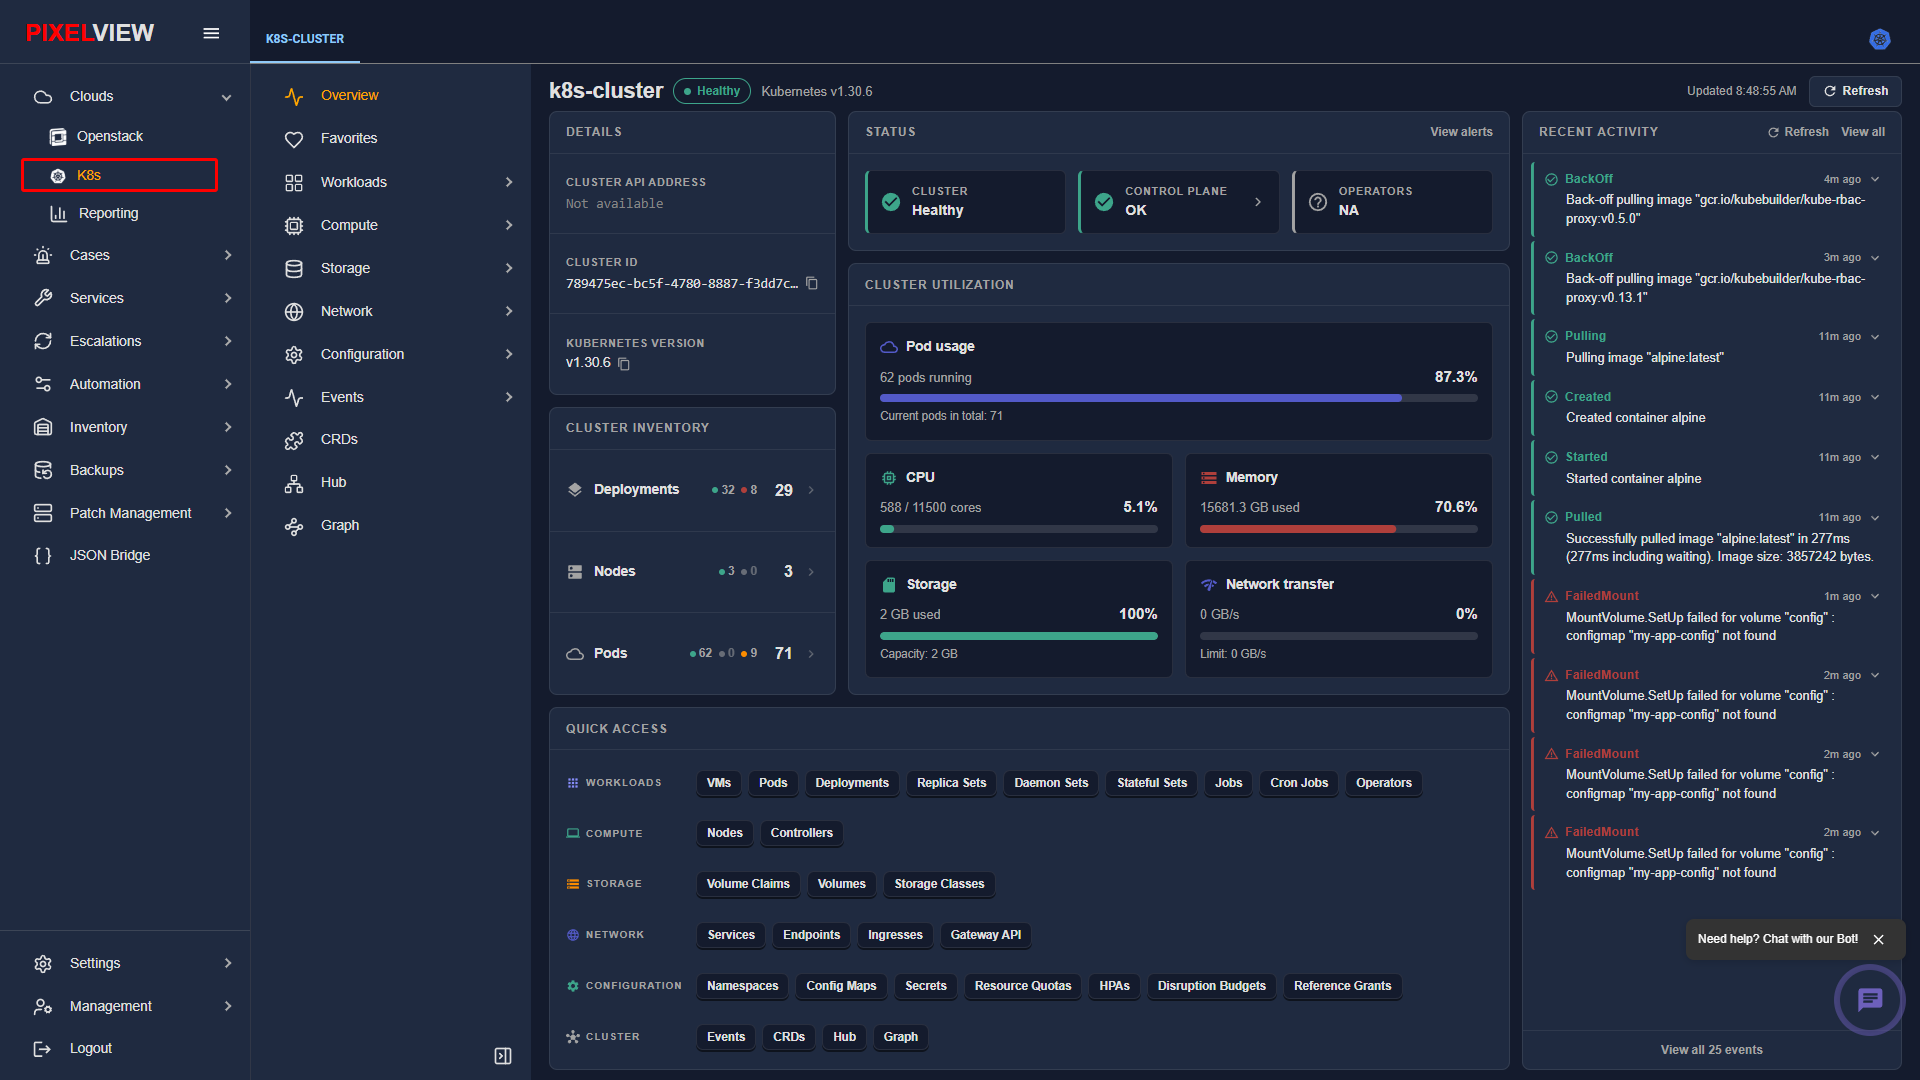
To access the Kubernetes module: * In the primary left navigation sidebar, expand Clouds. * Click K8s:
Multi-Cluster Architecture & Health Dashboard
PixelView seamlessly manages single and multi-cluster Kubernetes deployments from a single unified pane. When navigating into a cluster, PixelView presents real-time cluster health and resource capacity:
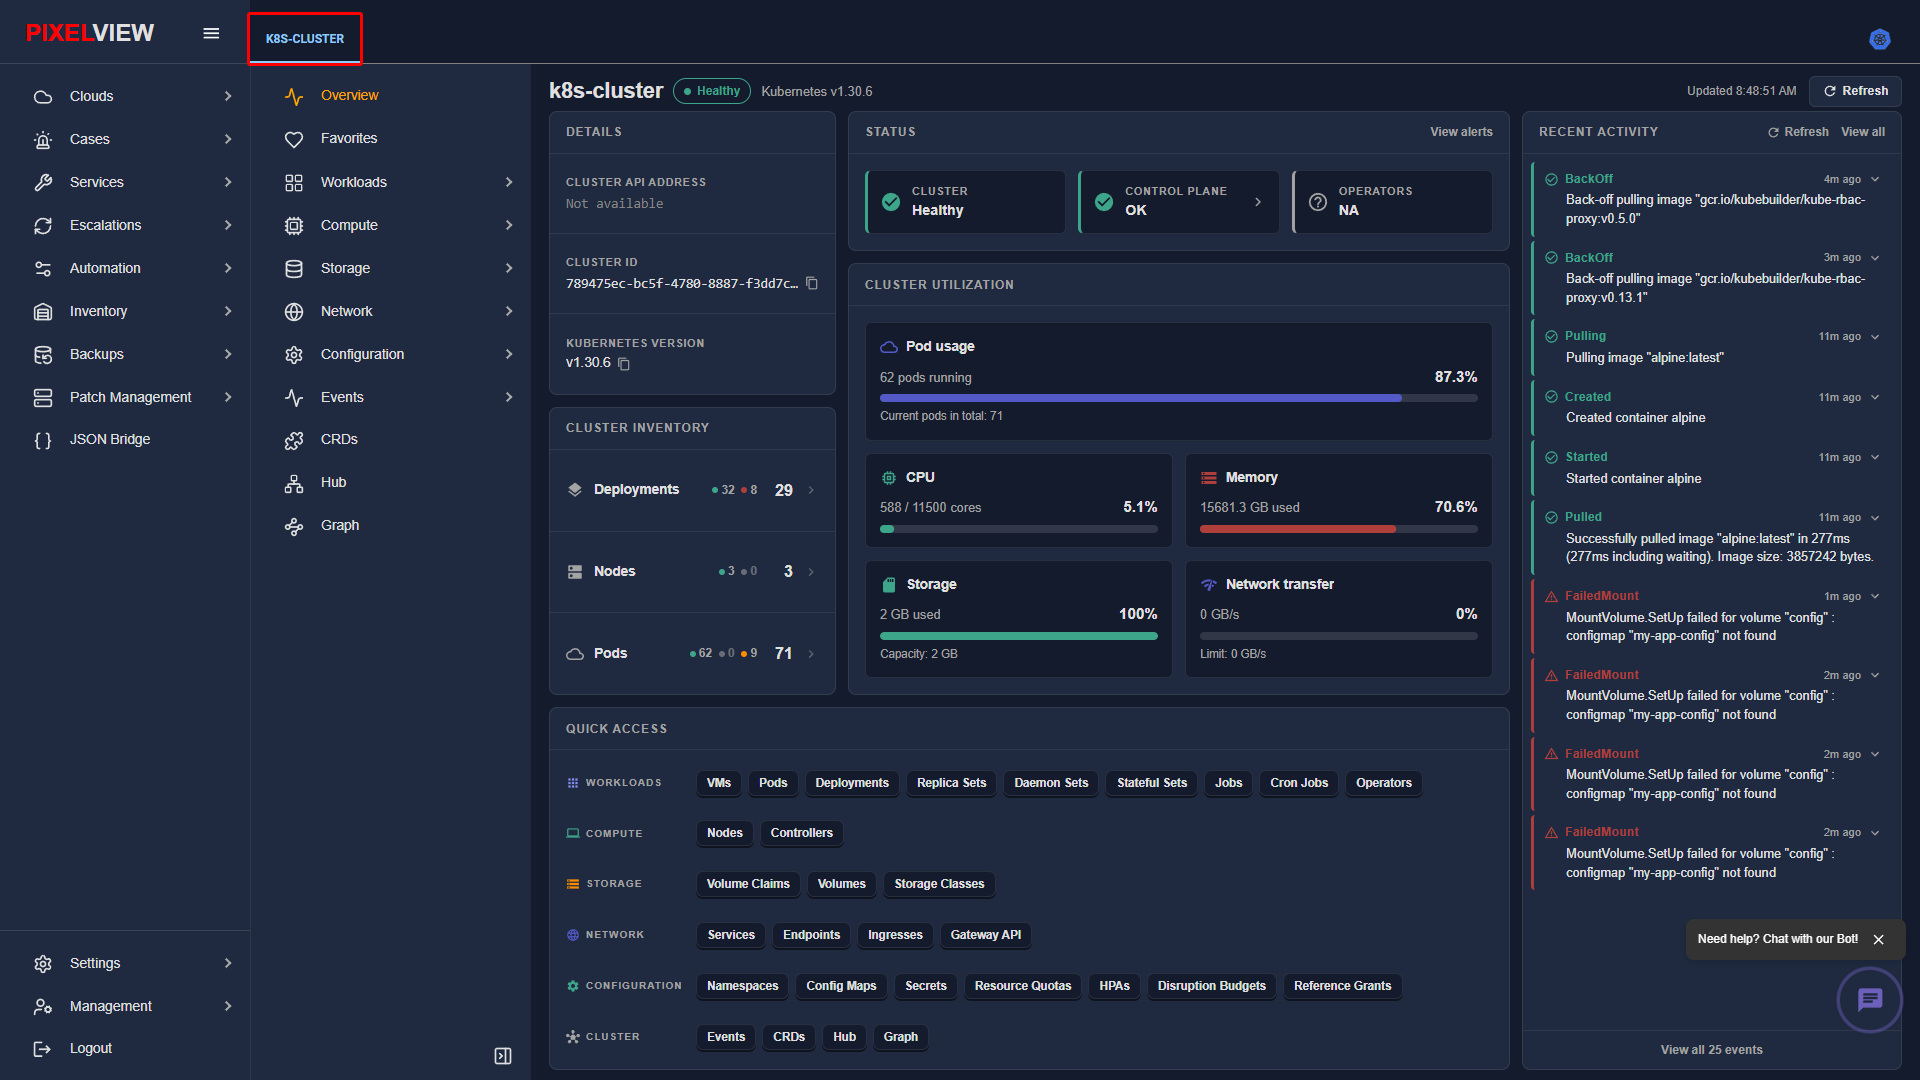
| Dashboard Section | Component | Description |
|---|---|---|
| Top Cluster Switcher | Cluster Tabs (K8S-CLUSTER) |
Located in the top header bar. Clicking any cluster tab switches operational focus without requiring re-authentication. |
| Cluster Identity | Health & Version | Shows real-time cluster status badge (Healthy, Degraded), active Kubernetes version (e.g., v1.30.6), and unique Cluster ID. |
| Control Plane Status | API & Controllers | Live operational check of kube-apiserver, kube-controller-manager, and operator managers. |
| Cluster Utilization | Resource Gauges | Visual percentage progress meters displaying active Pod usage against cluster capacity, CPU core allocations, and Memory utilization. |
| Cluster Inventory | Resource Counters | Live count cards showing total Deployments, active Nodes, and running Pods with instant drill-down links. |
| Global Namespace Selector | Namespace Scoping | Located in top toolbars across resource tables, allowing operators to filter views across all-namespaces or isolate individual tenant namespaces. |
Cluster Connection Credentials & Kubeconfig Registration
Unlike OpenStack which manages local Keystone identity users directly within the cloud sidebar, Kubernetes clusters connect to PixelView through authenticated cluster configuration profiles using standard kubeconfig specifications.
Registered Cluster Configurations Table
Cluster connection credentials and API server endpoints are configured in Settings → Config → Kubernetes:
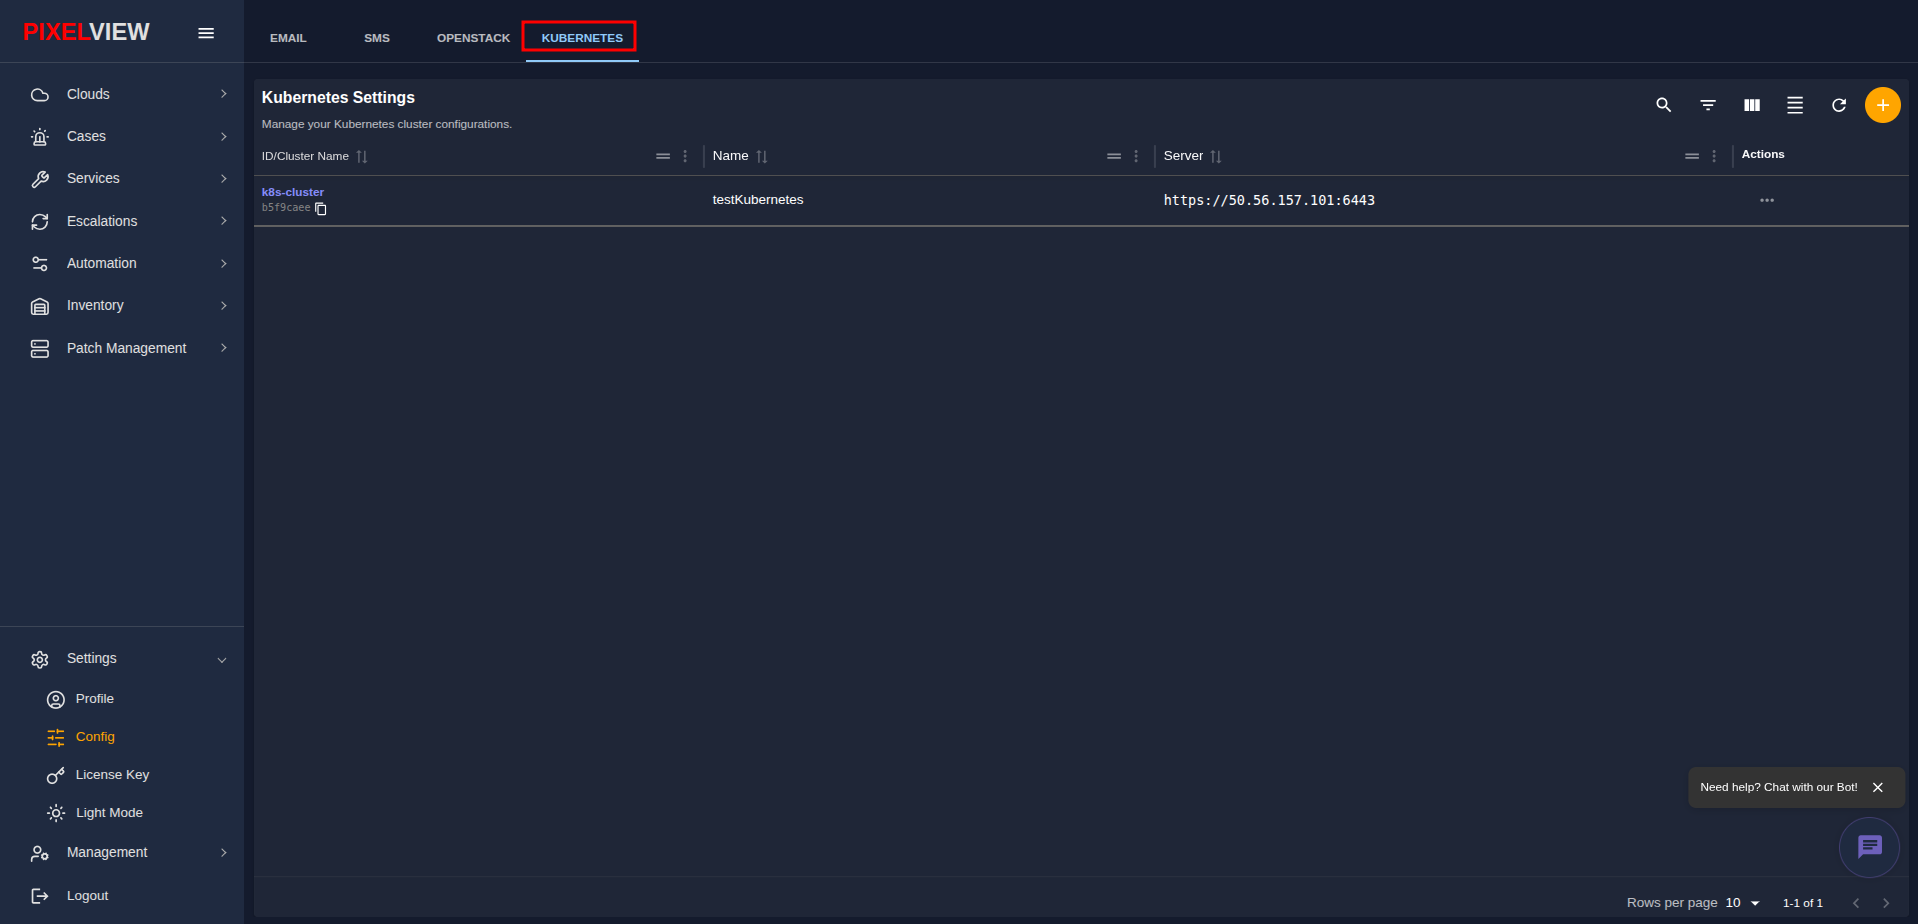
| Field | Description |
|---|---|
| ID/Cluster Name | Unique cluster identifier generated by PixelView with an instant Copy ID clipboard button. |
| Name | Human-readable cluster context label displayed in the top navigation tab switcher. |
| Server | Secure Kubernetes API server endpoint (e.g., https://50.56.157.101:6443). |
| Actions | Action menu (...) allowing administrators to delete cluster registrations. |
Adding a New Kubernetes Cluster
To register a new cluster and its connection credentials:
* In the bottom navigation, click Settings → Config.
* Select the Kubernetes tab in the top header.
* Click the + (Add) button located on the table toolbar.
* The Add Kubernetes Config dialog opens:
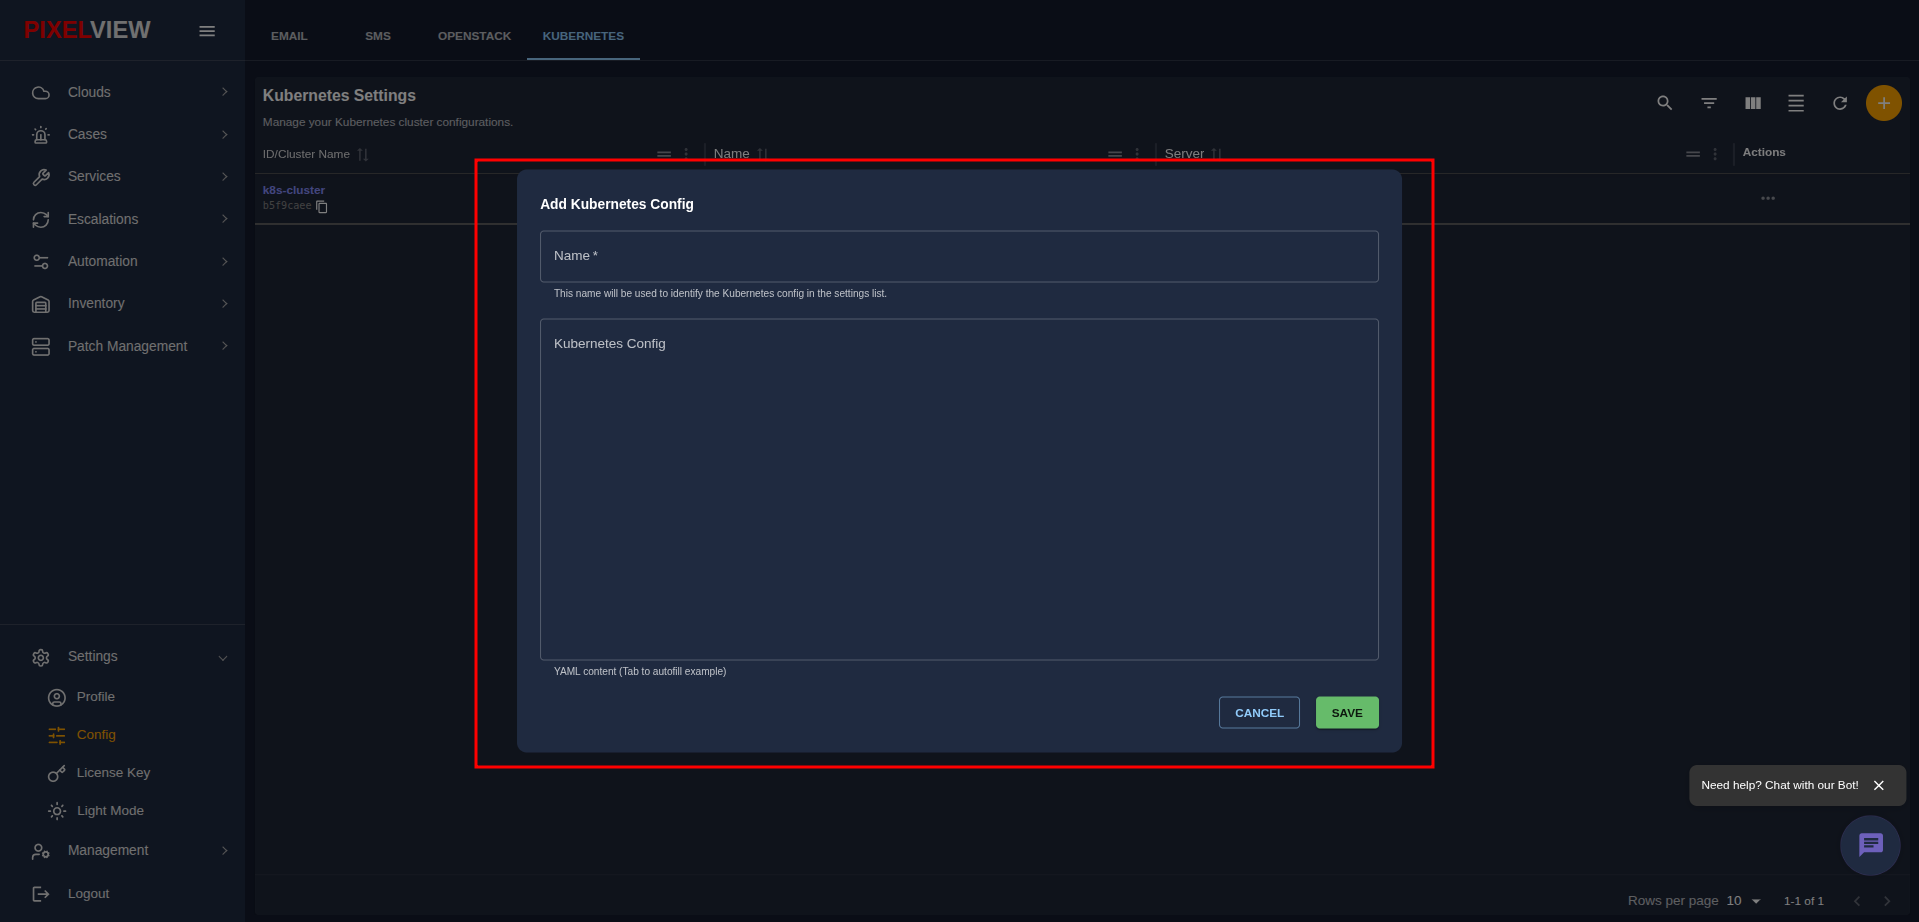
- Specify the cluster parameters:
- Name (Required): Unique identification label for the cluster.
- Kubernetes Config (Required): Paste the complete, standard
kubeconfigYAML file containing the cluster API server endpoint, Certificate Authority (certificate-authority-data), and authentication credentials (such as client certificates, bearer tokens, or service account authentication tokens). PressTabto autofill a sample template. - Click SAVE to validate and register the cluster. Once added, the cluster immediately appears in the K8s module under Clouds.
Tip
In-cluster workload credentials, image registry pull keys, TLS certificates, and service account tokens are managed within the cluster under Secrets.
Declarative Resource Creation Engine & Toolbar Actions
PixelView provides a unified, declarative resource creation workflow across all Kubernetes inventory tables (Deployments, Pods, StatefulSets, DaemonSets, Jobs, CronJobs, Services, Ingresses, PVCs, Namespaces, ConfigMaps, Secrets, ResourceQuotas, HPAs, and PDBs).
Standardized Table Toolbar Controls
Every resource table features a persistent upper-right action toolbar designed for rapid data exploration and resource provisioning:
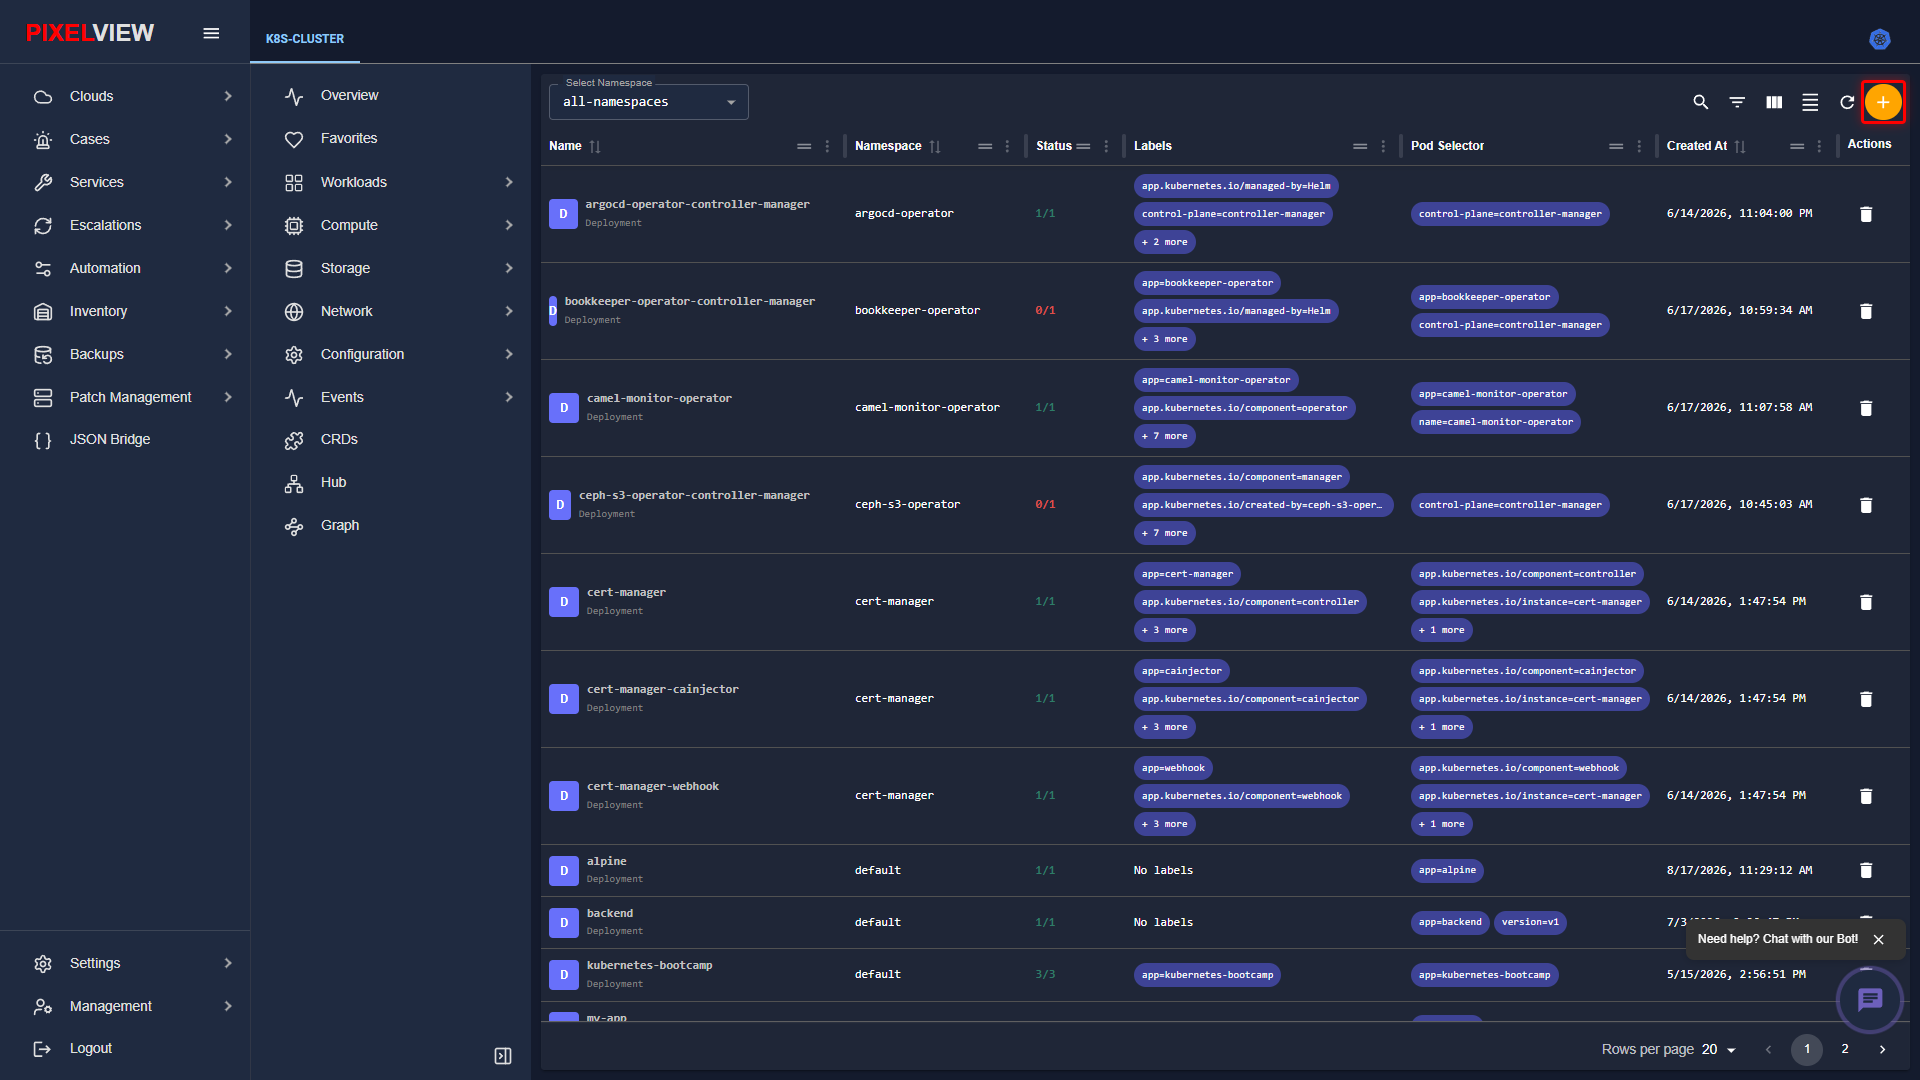
| Toolbar Action | Icon / Selector | Functionality |
|---|---|---|
| Search | Magnifying Glass (Show/Hide search) |
Opens an inline table search input to filter rows by name, namespace, or metadata in real time. |
| Filters | Filter List (Show/Hide filters) |
Toggles column-specific condition filters (such as status, node placement, or labels). |
| Columns | Column Matrix (Show/Hide columns) |
Opens the column visibility manager to toggle, show, or hide specific table attributes. |
| Density | Density Lines (Toggle density) |
Cycles row spacing between compact, standard, and comfortable display heights. |
| Refresh | Circular Arrows (Refresh table data) |
Immediately re-queries the Kubernetes API server for fresh resource telemetry. |
| Add Resource | Orange Circular Button with + Icon |
Launches the dedicated, full-screen Monaco-powered YAML creation interface for the active resource type. |
Unified Monaco YAML Creation Interface
Clicking the orange + button on any table toolbar launches PixelView's native, browser-based Monaco Code Editor, pre-populated with a validated, resource-specific manifest template:
| Editor Control | Location | Purpose |
|---|---|---|
| Resource Badge | Top Left | Visual badge indicating the active resource kind (e.g., DEPLOYMENT, NAMESPACE, CONFIGMAP, SECRET, PVC) and editor mode (YAML Editor). |
Font Sizing (A- / A+) |
Top Right Toolbar | Decreases or increases the Monaco editor font size for comfortable editing. |
Font Size Indicator (14) |
Top Right Toolbar | Displays the active editor font size in points. |
Text Wrap (Wrap) |
Top Right Toolbar | Toggles soft line wrapping for long annotations, base64 payloads, or multi-line commands. |
Vim Keybindings (Vim) |
Top Right Toolbar | Toggles modal Vim editing mode for power users preferring keyboard-driven navigation. |
Clipboard Copy (Copy) |
Top Right Toolbar | Copies the complete editor buffer content to the system clipboard. |
ADD <RESOURCE> |
Bottom Left | Validates the YAML manifest against the cluster OpenAPI schema and submits it directly to the Kubernetes API server. |
CANCEL |
Bottom Left | Aborts creation and returns to the resource inventory table without applying changes. |
Column Actions Three-Dot Context Menu
Every table column header across PixelView Kubernetes inventory views features an integrated three-dot menu button (⋮ / aria-label="Column Actions"):
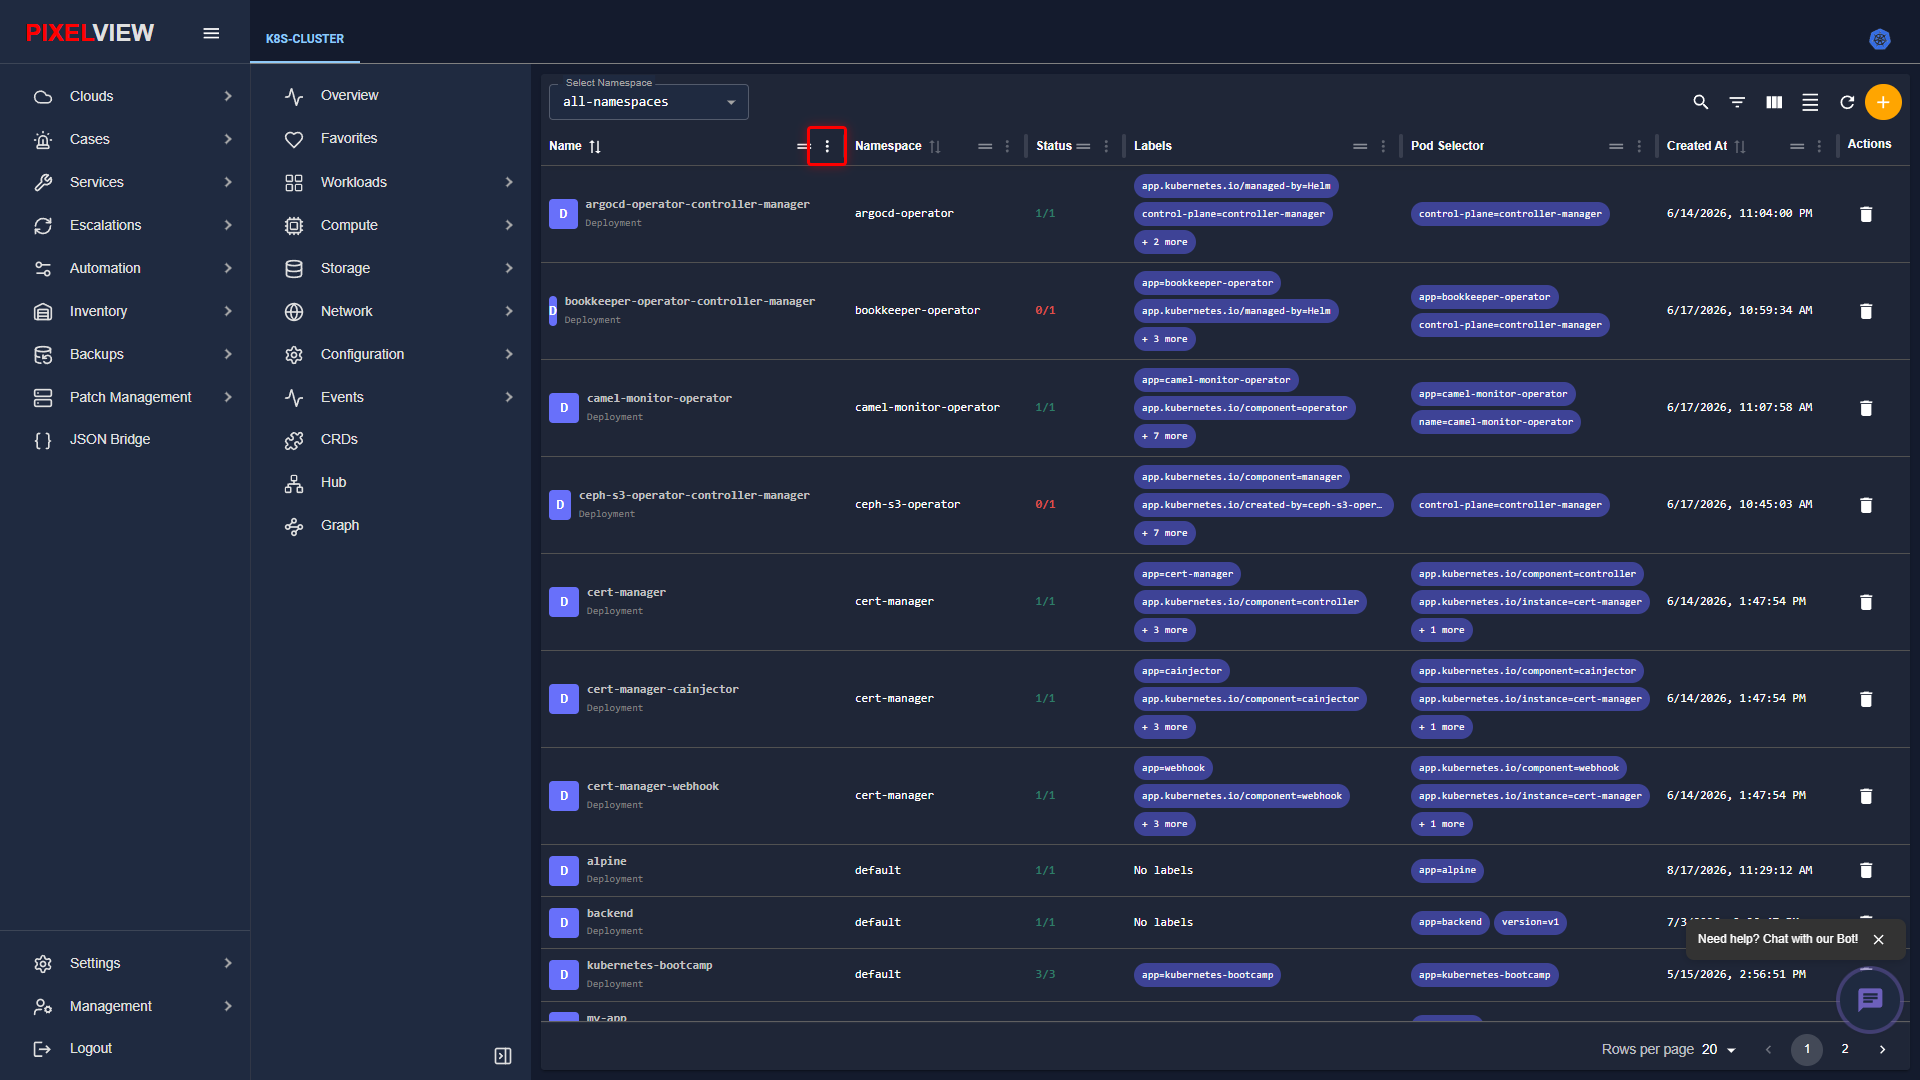
Clicking this three-dot icon opens the Column Actions context menu for instantaneous table restructuring:
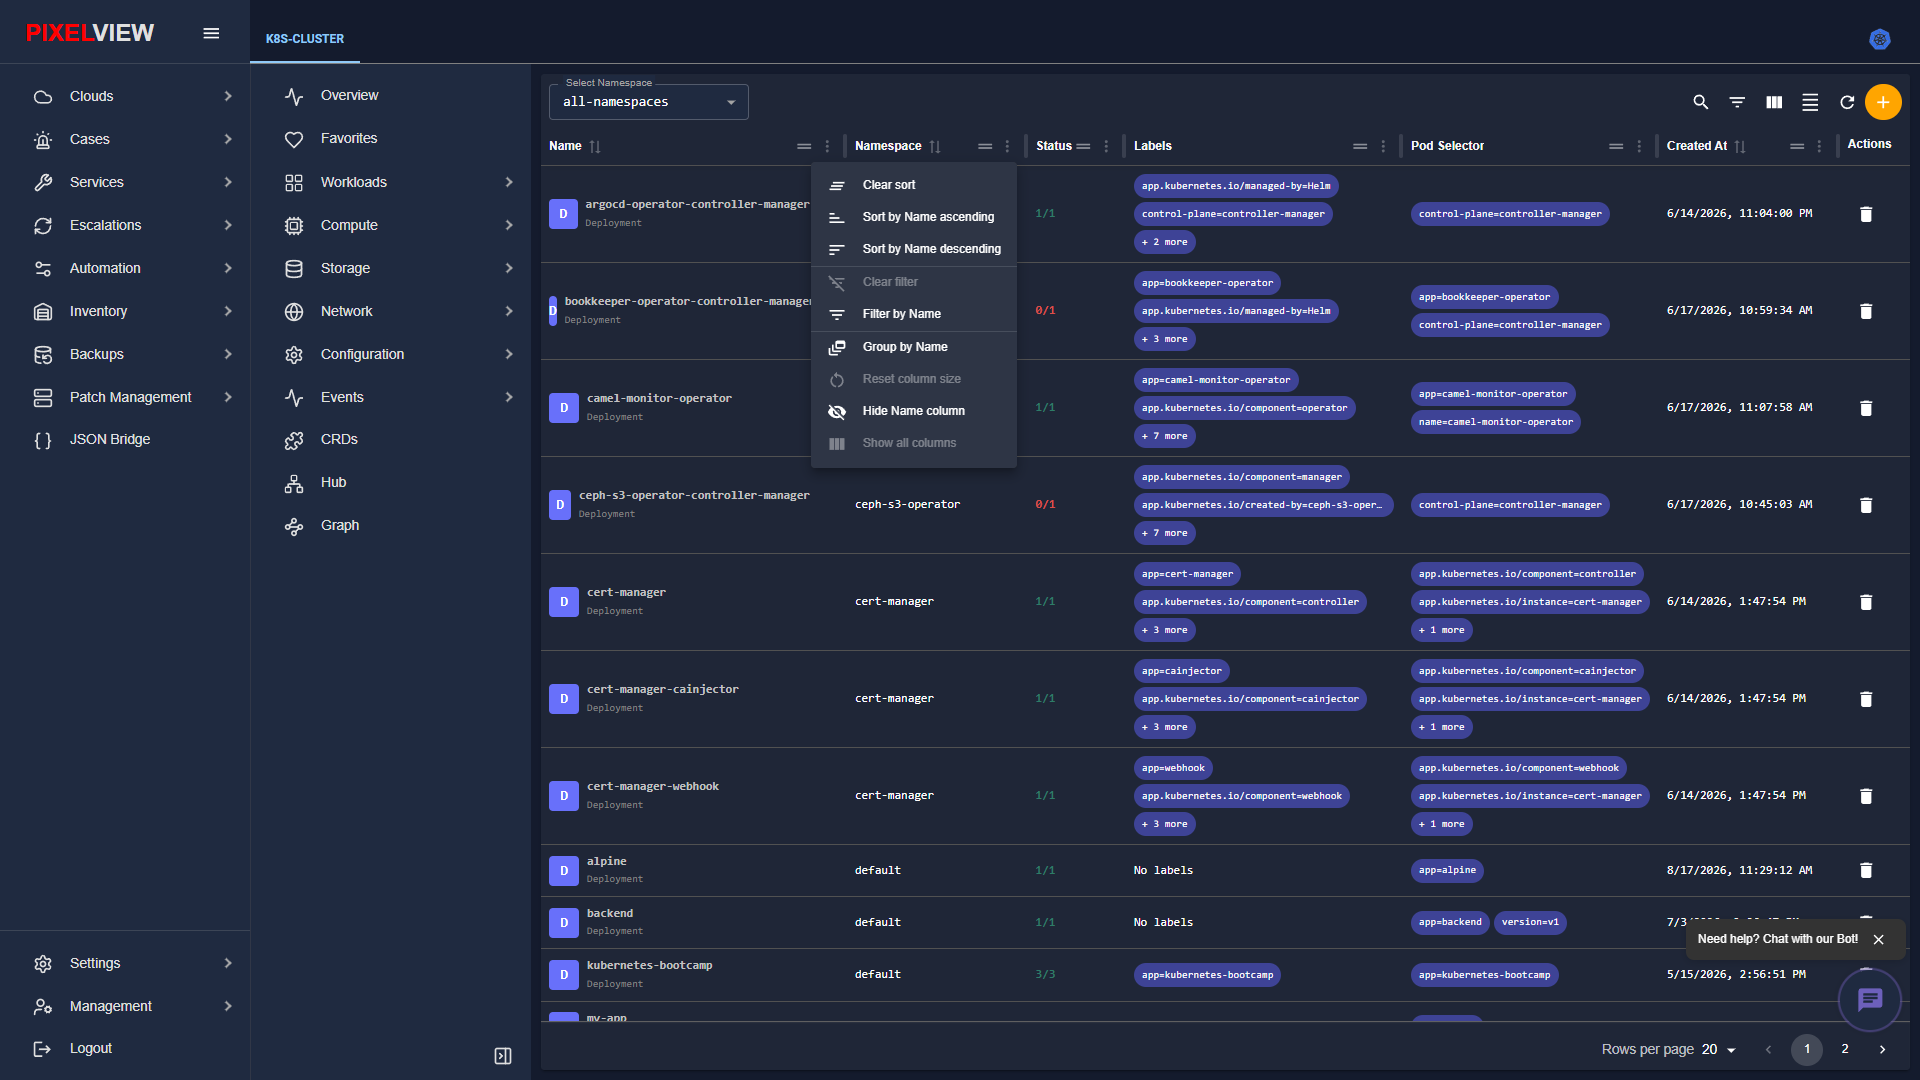
| Menu Action | Functionality |
|---|---|
| Clear sort | Removes existing sorting constraints from the selected column. |
| Sort by |
Reorders table rows in ascending order based on this column's values. |
| Sort by |
Reorders table rows in descending order based on this column's values. |
| Clear filter | Purges any active filter expression applied to this specific column. |
| Filter by |
Injects an inline search and condition filter scoped strictly to this column. |
| Group by |
Dynamically aggregates matching table records by common values in this column. |
| Reset column size | Restores the default column width and spacing. |
| Hide |
Hides this specific column from the active table layout. |
| Show all columns | Restores all hidden columns back into visibility across the table grid. |
Favorites
The Favorites workspace (/kubernetes/:clusterName/favorites) provides a centralized, rapid-access board for pinning critical Kubernetes resources, frequently monitored workloads, production namespaces, and high-priority cluster nodes.
Favorites Workspace Overview
Navigate to Favorites in the secondary sidebar:
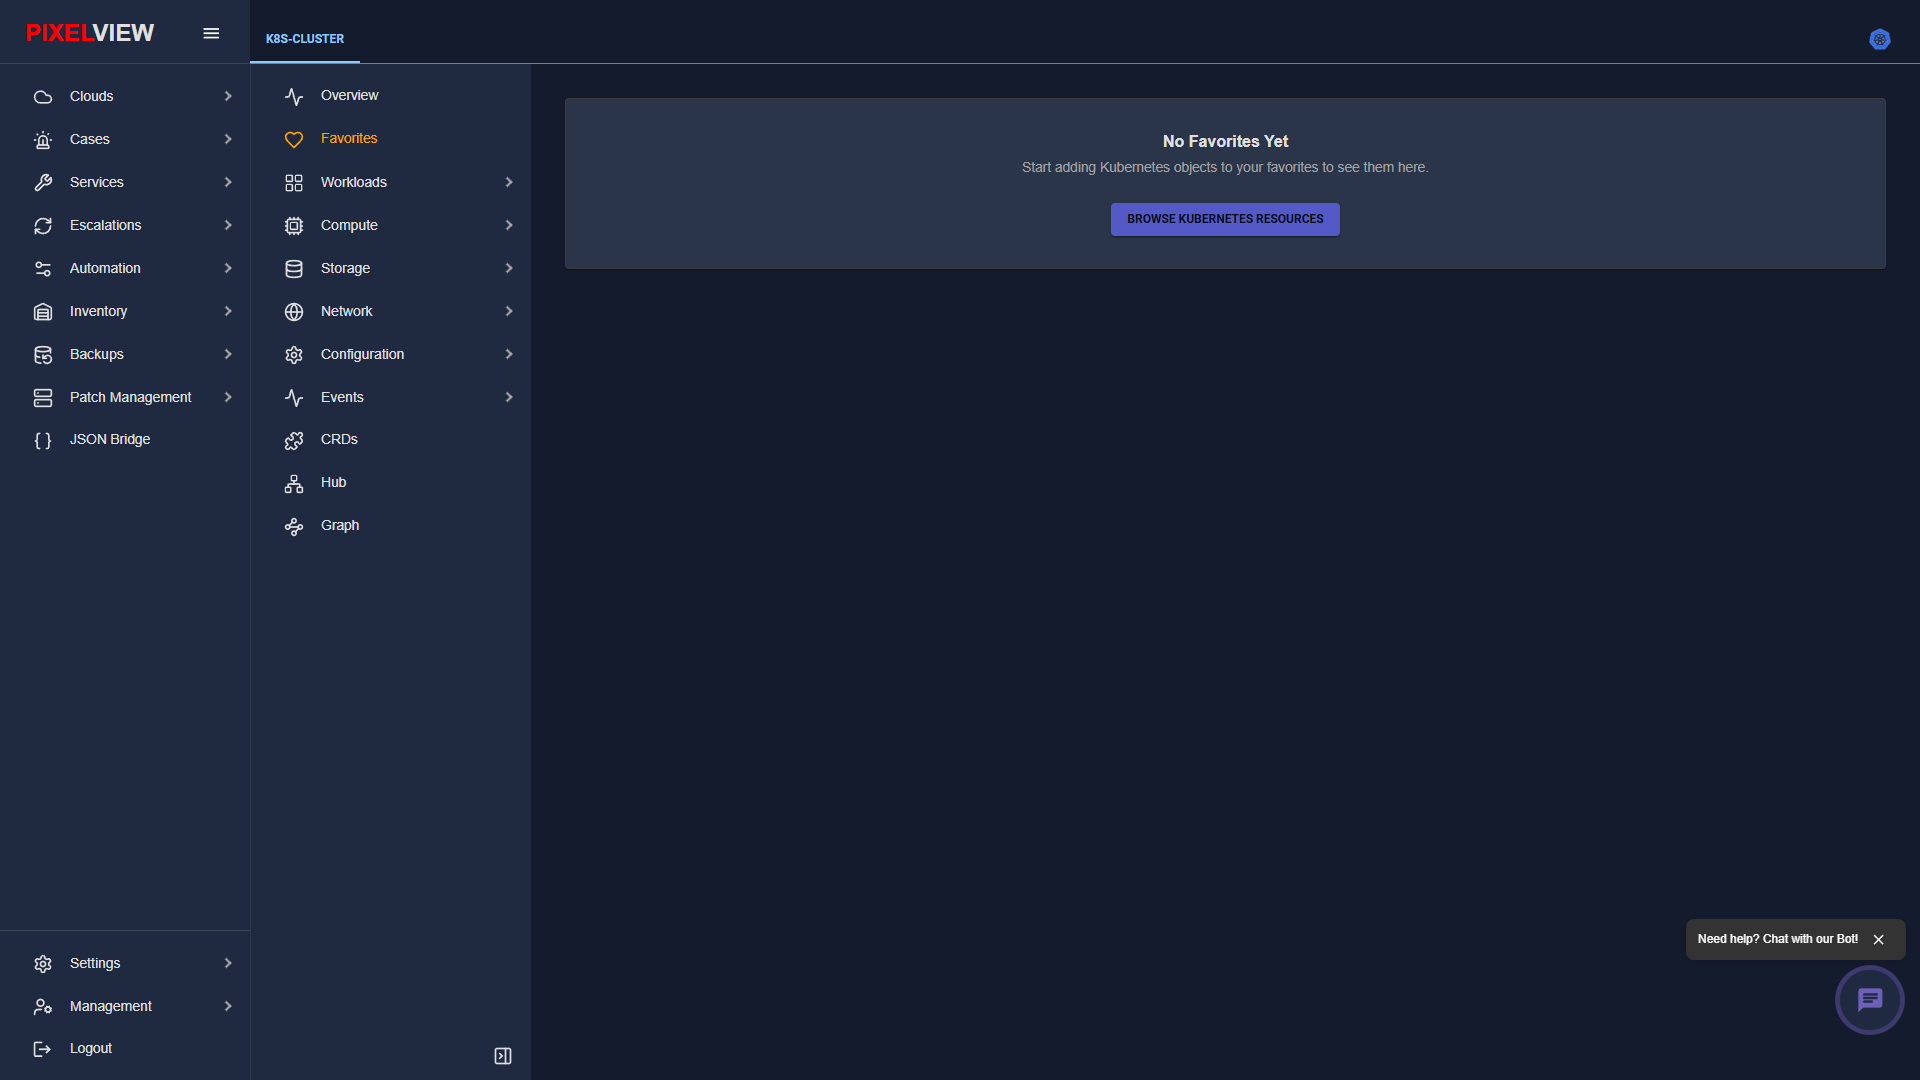
| Feature | Operational Capability |
|---|---|
| Instant Workload Pinning | Operators can bookmark any running Pod, Deployment, StatefulSet, or Namespace directly from its details header by clicking the star bookmark icon. |
| Unified Status Monitoring | All pinned items aggregate in the Favorites canvas, providing immediate health badges and replica telemetry without navigating through deep secondary submenus. |
| One-Click Deep-Dive | Clicking any favorited item directly opens its dedicated multi-tab inspection interface or live YAML editor buffer. |
| Quick Browse Action | The BROWSE KUBERNETES RESOURCES button provides instant access to the cluster inventory to begin adding resources to the favorites board. |
Workloads
The Workloads submenu provides granular lifecycle management over containers, replica controllers, batch workloads, and virtual machines running on Kubernetes.
Virtual Machines (KubeVirt VMs)
PixelView provides native orchestration for KubeVirt, allowing traditional virtual machines to run side-by-side with containerized workloads directly on Kubernetes worker nodes.
VMs Table Overview
Navigate to Workloads → VMs in the secondary sidebar:
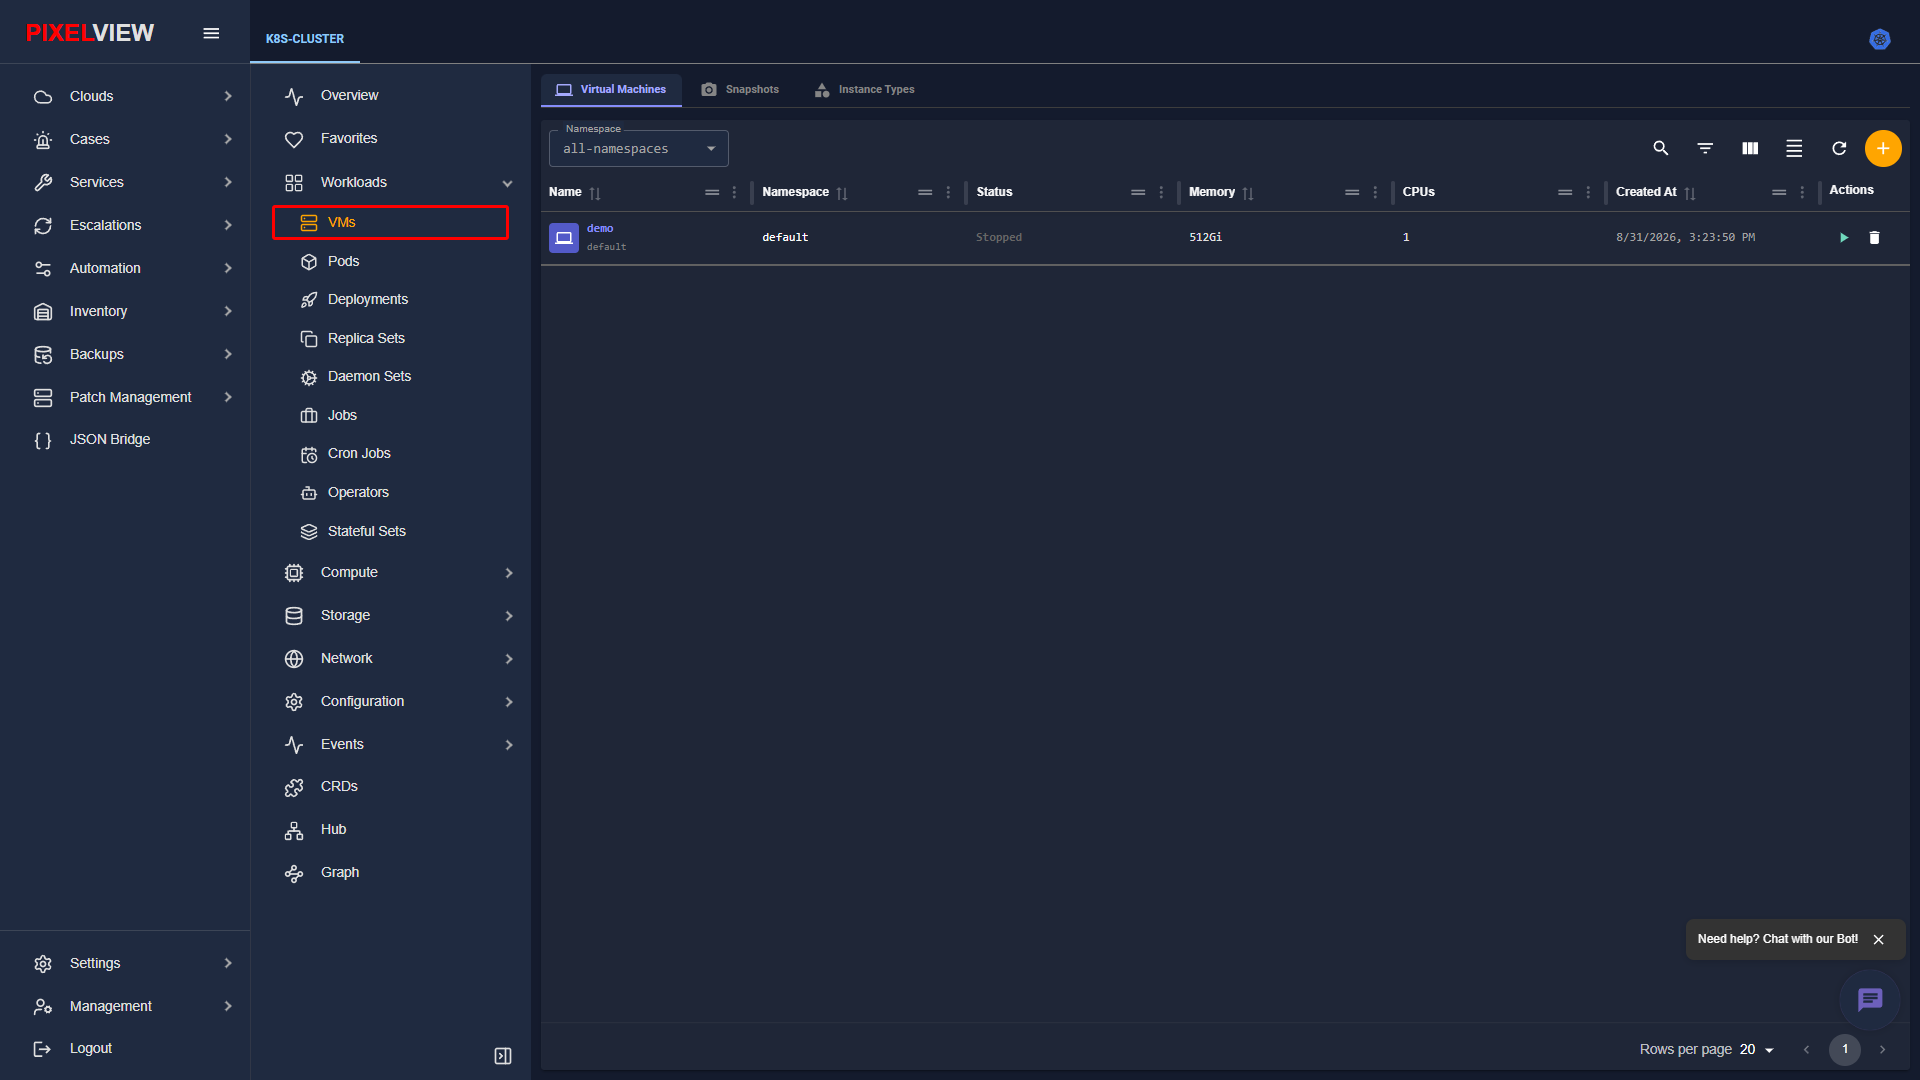
| Column | Description |
|---|---|
| Name | Virtual machine display name and UUID. |
| Namespace | Tenant namespace boundary. |
| Status | Virtual machine power state: Running, Stopped, Starting, or Error. |
| CPU Cores | Virtual processor cores allocated to the guest OS. |
| Memory | RAM capacity assigned to the virtual machine. |
| IP Address | Assigned IP endpoints (pod network or bridged external IP). |
| Actions | Context actions to open web VNC console, start, stop, restart, or delete the virtual machine. |
Virtual Machine Deep-Dive & Hardware Allocation
Clicking any virtual machine row in the inventory table navigates to the dedicated VM Details page (/kubernetes/:clusterName/vms/:namespace/:vmName):
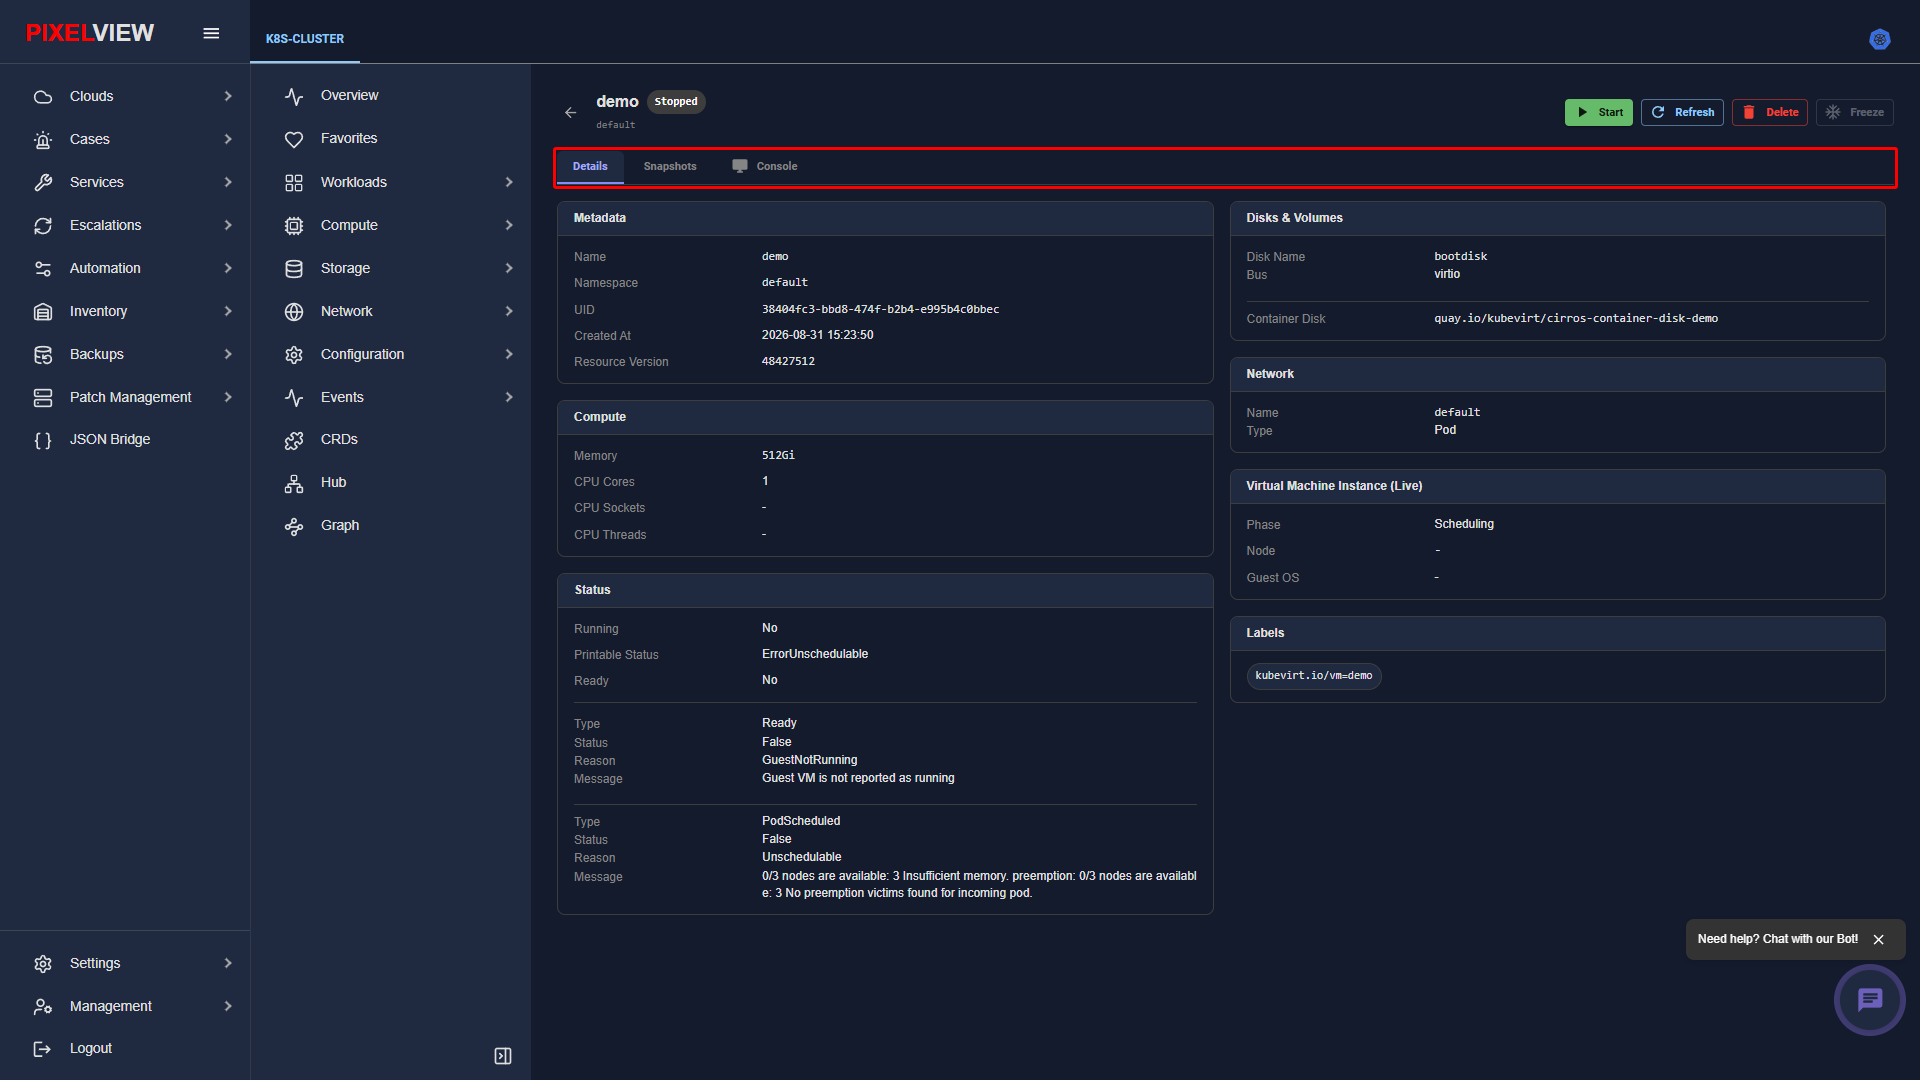
| Tab / Control | Purpose & Capabilities |
|---|---|
Details |
Core virtual machine specifications, memory quotas, CPU topologies, storage volume attachments, and live scheduling state. |
Snapshots |
Point-in-time VM snapshot management, allowing operators to create, restore, or delete consistent disk and memory checkpoints. |
Console |
Interactive browser-based graphical noVNC and serial console for direct OS-level administrative login without SSH. |
| Action Toolbar | Direct lifecycle power buttons: Start, Refresh, Delete, and Freeze (guest filesystem and memory quiesce). |
Virtual Machine Details Cards
- Metadata: VM Name (
demo), Namespace (default), UID, Creation timestamp, and Resource Version. - Compute: Memory allocation (
5126i), vCPU Cores (1), CPU Sockets, and CPU Threads. - Status: Running state (
No), Printable Status (ErrorUnschedulable), Ready state (No), and detailed scheduling error messages. - Disks & Volumes: Disk Name (
bootdisk), Bus architecture (virtio), and container disk image source (quay.io/kubevirt/cirros-container-disk-demo). - Network: Interface Type (
Pod) and internal IP configuration. - Virtual Machine Instance (Live): Phase (
Scheduling), Placement Node, and Guest OS telemetry.
Pods
Pods represent the smallest deployable computing units in Kubernetes, running one or more tightly coupled containers sharing network and storage resources.
Pods Table Overview
Navigate to Workloads → Pods in the secondary sidebar:
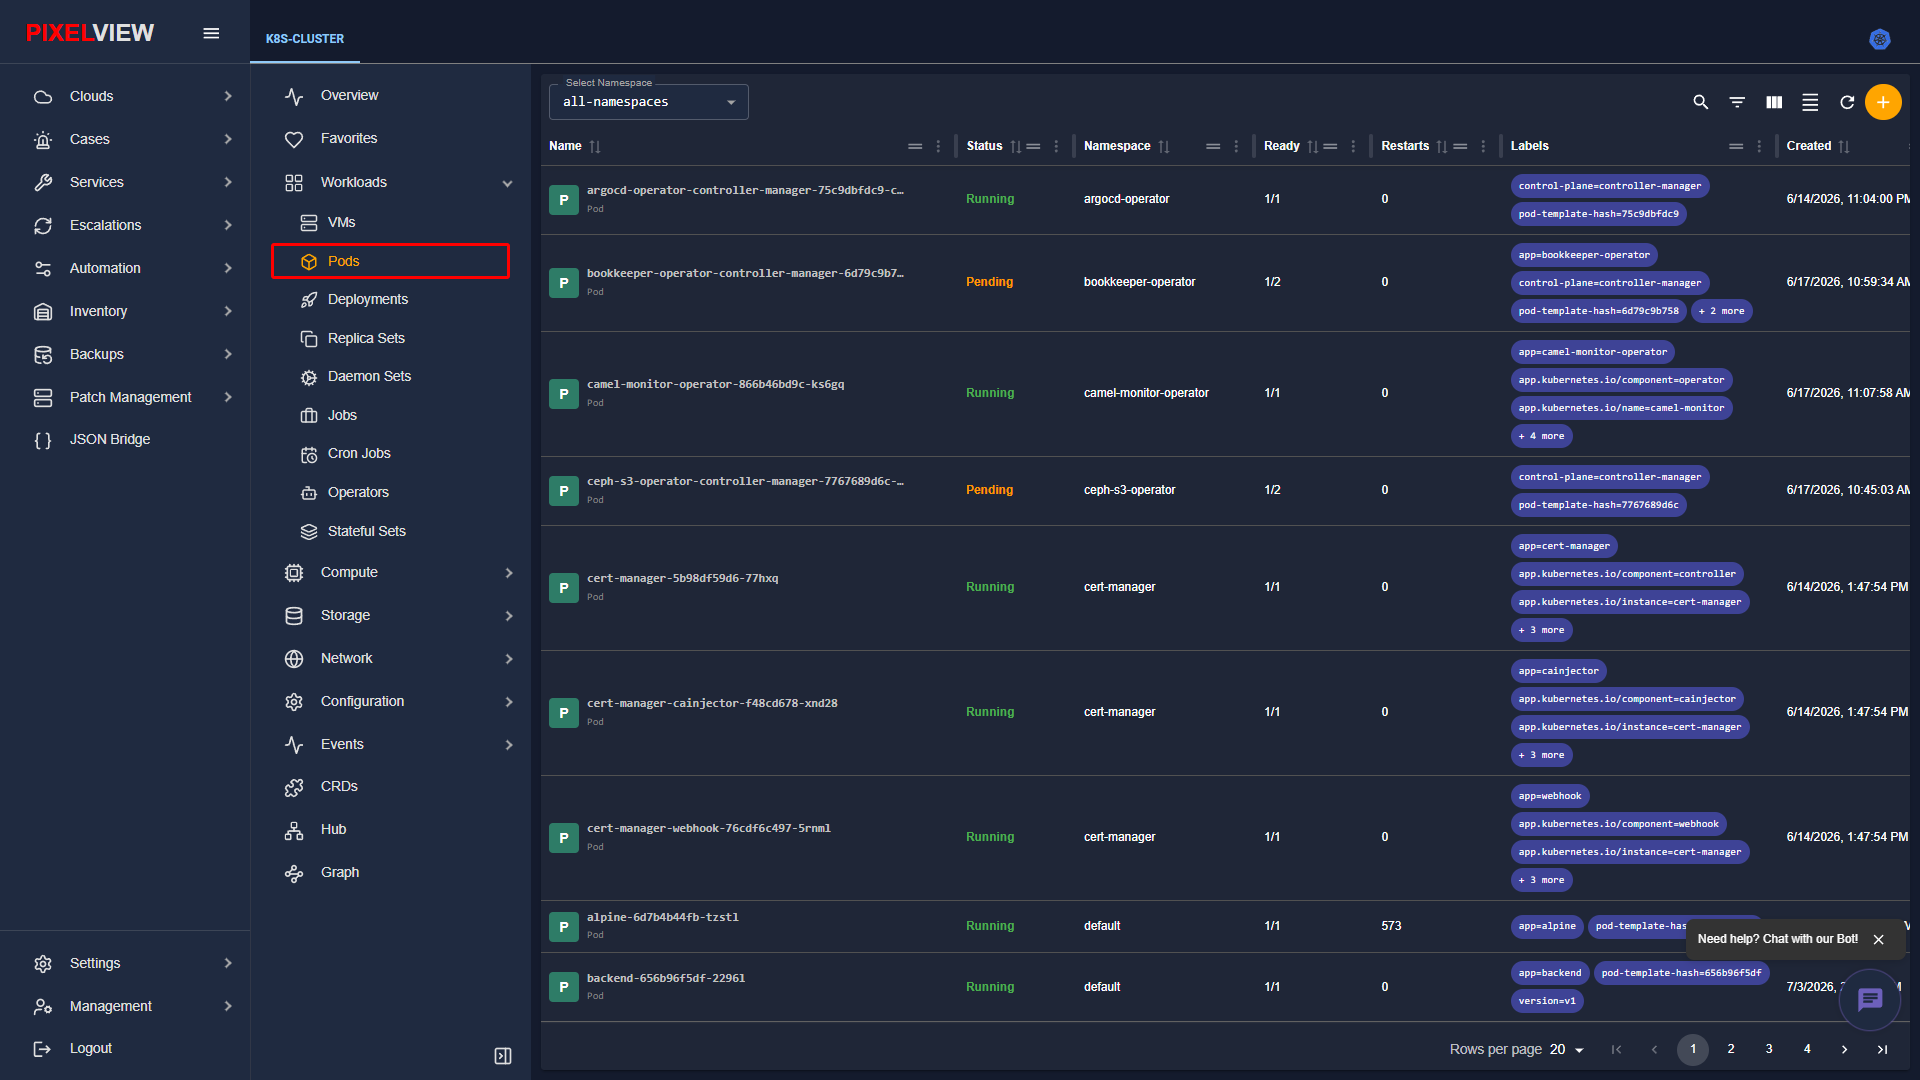
| Column | Description |
|---|---|
| Name | Pod hostname, container avatar icon, and system UUID. Clicking any pod opens live logs, environment variables, and interactive terminal consoles. |
| Status | Lifecycle state badge: Running, Pending, CrashLoopBackOff, Completed, or Terminating. |
| Namespace | Scoped namespace hosting the workload (e.g., default, cert-manager, kube-system). |
| Ready | Ratio of ready containers to total containers configured in the pod spec (e.g., 1/1, 2/2). |
| Restarts | Total restart count triggered by container crash exits or liveness probe failures. |
| Labels | Searchable key-value metadata tags (e.g., app=cert-manager, control-plane=controller-manager). |
| Created | Timestamp indicating pod provisioning date and time. |
| Actions | Direct resource lifecycle management button (Delete item trash bin icon) allowing operators to terminate or purge the pod instance. |
Pod Lifecycle Management & Row Actions
Operators can trigger lifecycle actions directly from any table row without drilling down:
* In the Pods inventory table, locate the target workload.
* In the rightmost Actions column, click the trash bin icon (Delete item).
* PixelView prompts with a safety confirmation dialog to prevent accidental workload disruption:
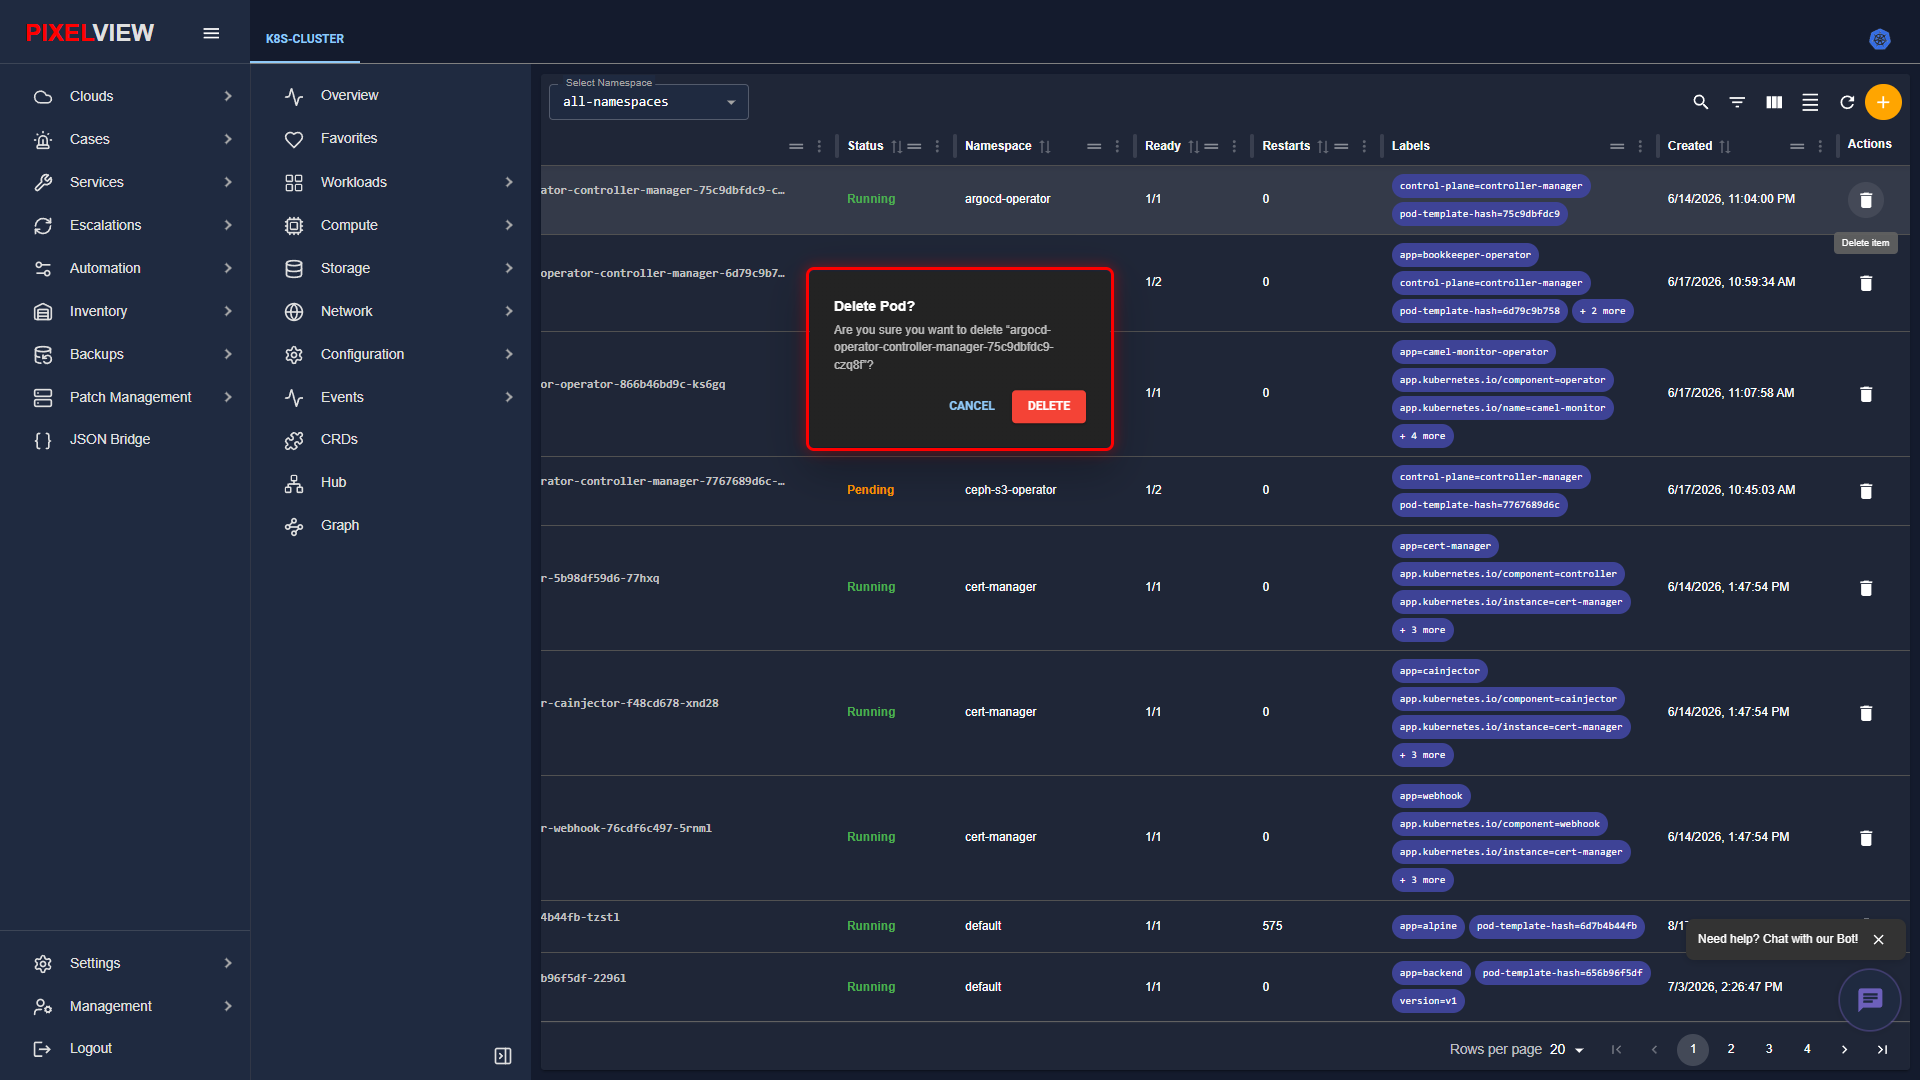
- The confirmation card displays the exact pod identification string (e.g.,
argocd-operator-controller-manager-75c9dbfdc9-czq8f). - Click DELETE to issue a graceful eviction request to the Kubernetes API server, or CANCEL to abort.
Deployments
Deployments provide declarative updates for Pods and ReplicaSets, managing rolling upgrades, automated rollbacks, and horizontal scaling across worker nodes.
Deployments Table Overview
Navigate to Workloads → Deployments in the secondary sidebar:
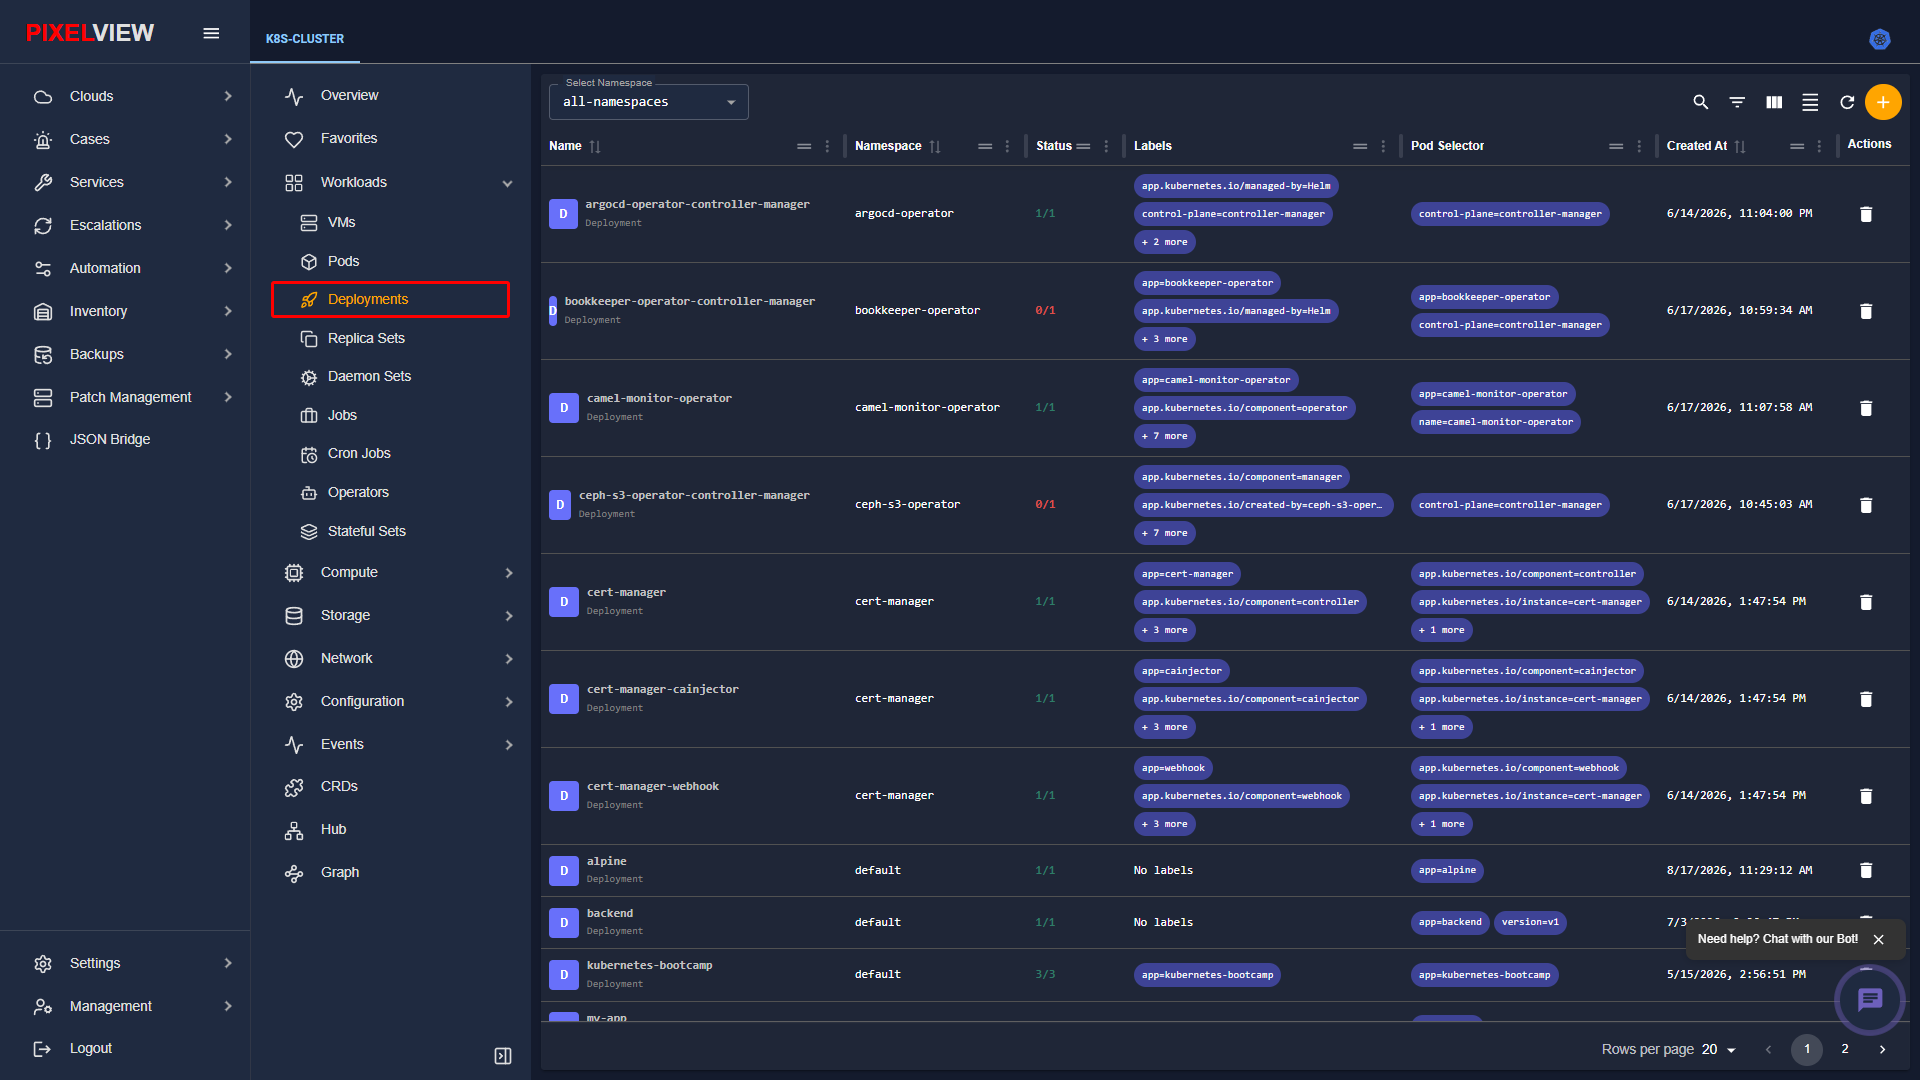
| Column | Description |
|---|---|
| Name | Deployment identifier and application service name. |
| Namespace | Tenant namespace boundary containing the deployment. |
| Status | Real-time replica state displaying desired vs ready pod instances. |
| Labels | Deployment metadata tags used for service discovery and organizational grouping. |
| Pod Selector | Label query matching member pods managed by the underlying ReplicaSet. |
| Created At | Initial deployment creation timestamp. |
| Actions | Direct lifecycle management button (Delete item trash bin icon) allowing operators to tear down the deployment and associated replicas. In-place configuration edits, scaling, and rollout adjustments are performed inside Deployment Details. |
Creating Deployments Declaratively
To provision a new Deployment workload:
* In the secondary sidebar, navigate to Workloads → Deployments.
* Click the orange circular + (Add item) button on the table toolbar:
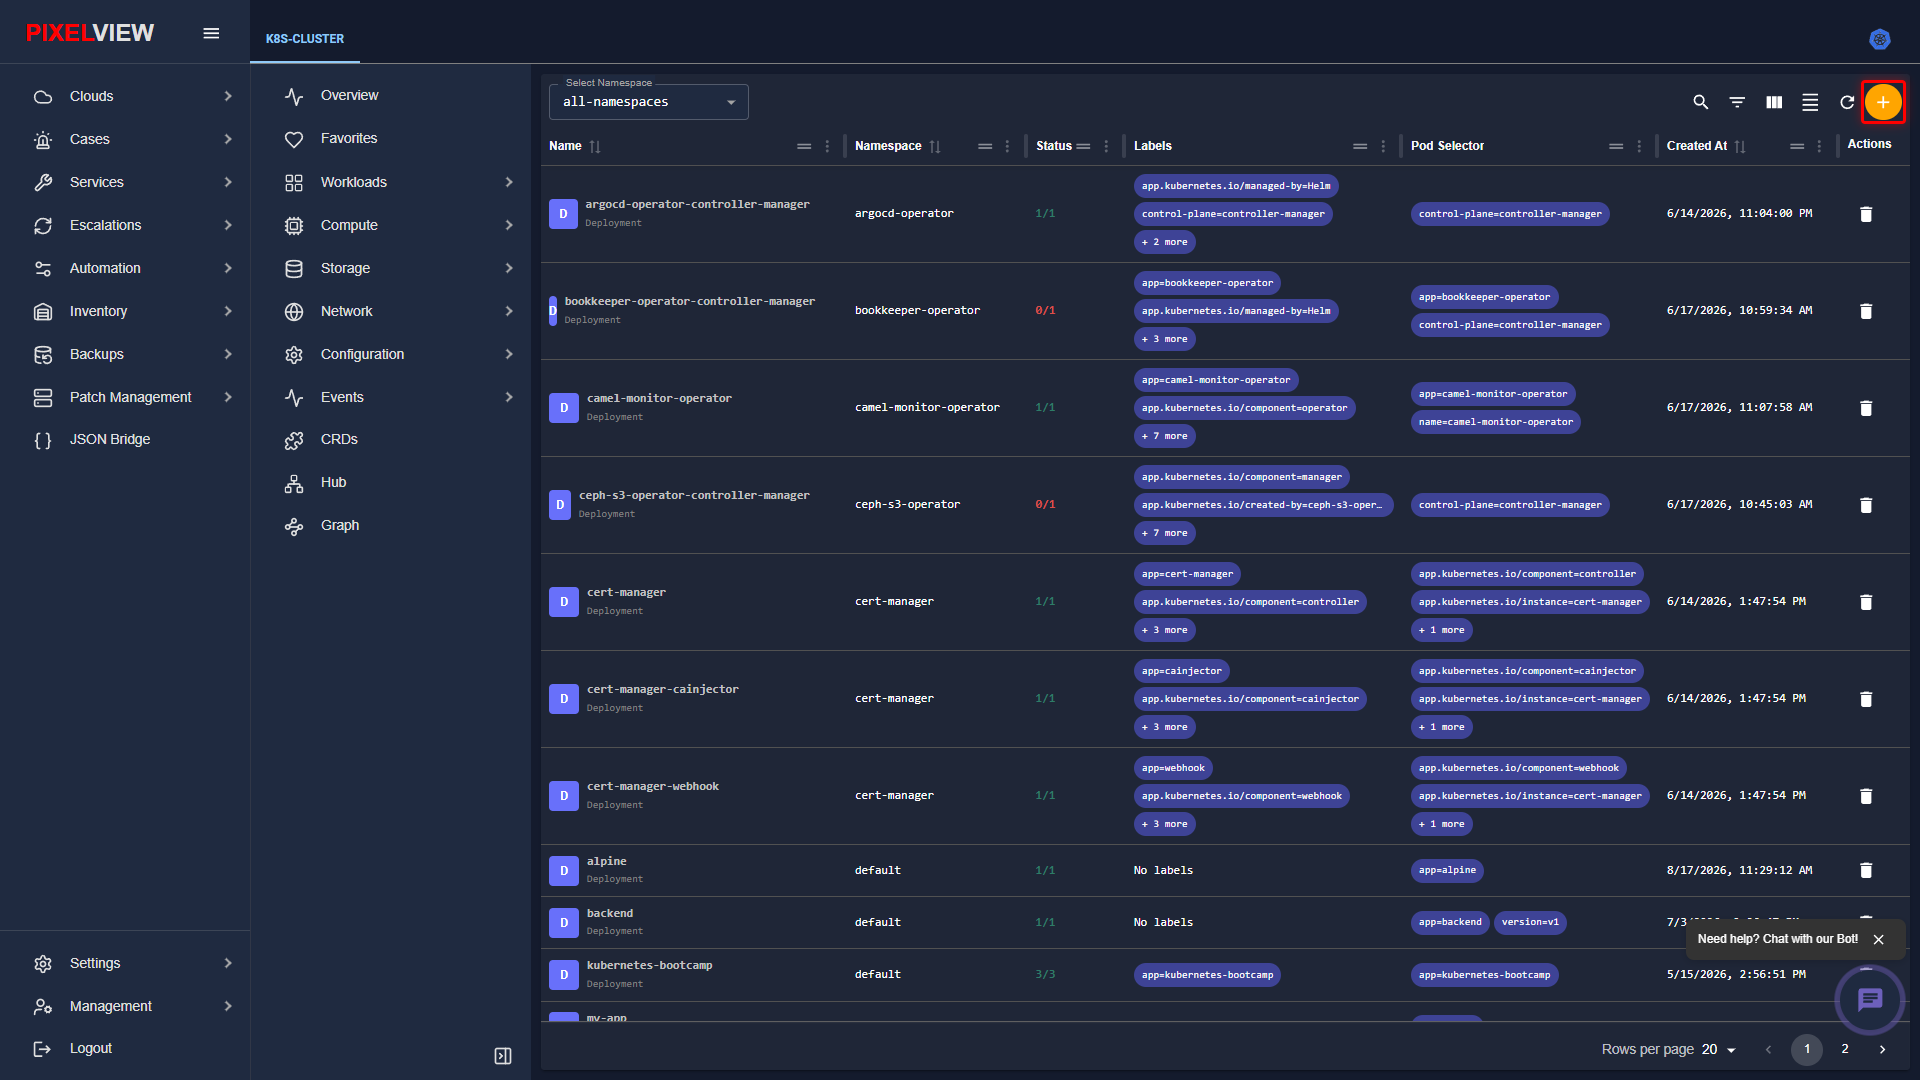
- PixelView opens the Create New Deployment Monaco editor interface:
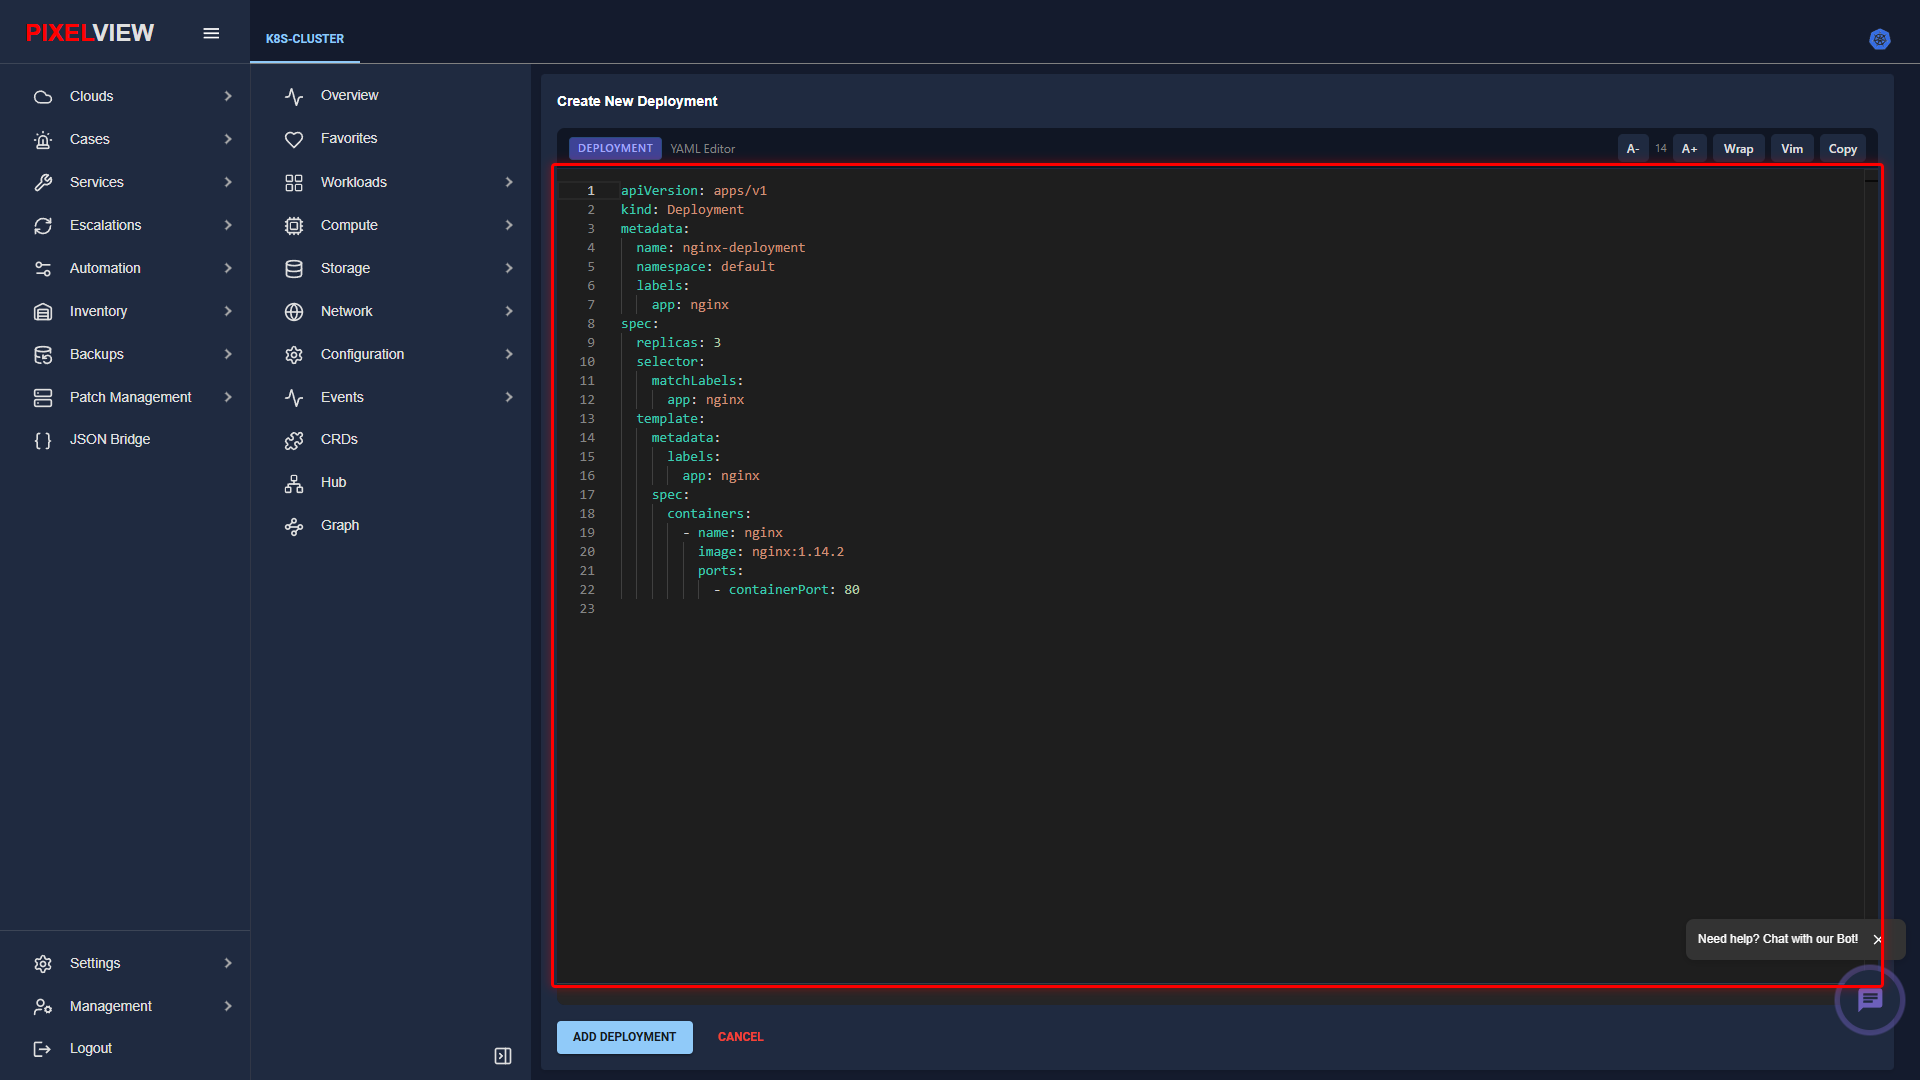
- The editor automatically populates an industry-standard Deployment manifest template:
metadata.name: Target workload name (e.g.,nginx-deployment).metadata.namespace: Scoped deployment namespace (defaults to active namespace ordefault).spec.replicas: Desired pod instance count.spec.selector.matchLabels: Label query matching the pod template.spec.template.spec.containers: Container name, image registry path (e.g.,nginx:1.14.2), and container port bindings.- Modify the manifest as required or paste an existing declarative spec.
- Click ADD DEPLOYMENT to deploy the workload to the cluster.
Deployment Deep-Dive & Multi-Tab Inspection
Clicking any deployment row in the inventory table navigates to the dedicated Deployment Details page (/kubernetes/:clusterName/deployments/:namespace/:deploymentName/details):
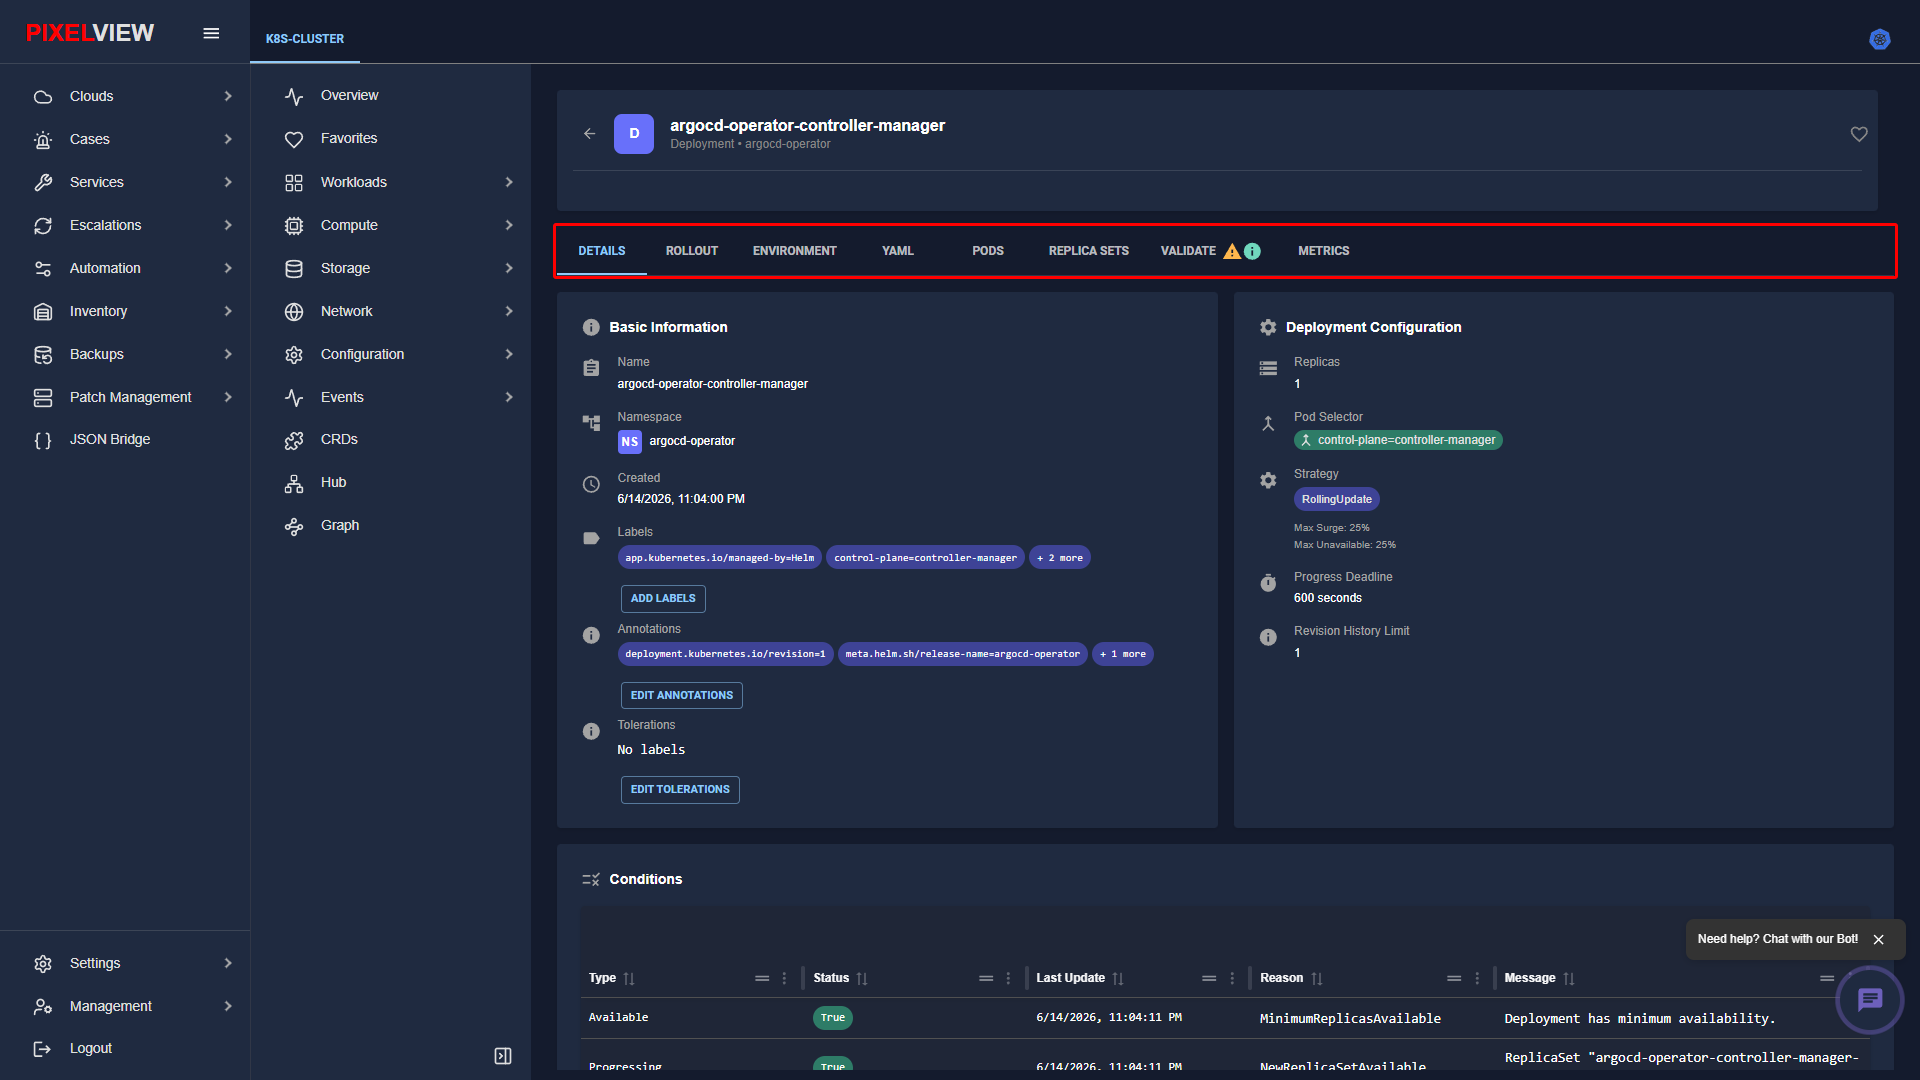
| Tab | Purpose & Capabilities |
|---|---|
DETAILS |
Comprehensive workload configuration, replica targets, selector rules, rollout strategy, active conditions, and container definitions. |
ROLLOUT |
Complete rollout revision history timeline, allowing operators to monitor rolling deployments, pause/resume updates, or trigger immediate rollbacks to a previous stable revision. |
ENVIRONMENT |
Aggregated view of all environment variables, ConfigMap keys, and Secret keys injected into the deployment's container pods. |
YAML |
Live interactive declarative Kubernetes Deployment manifest viewer with in-place editing, syntax highlighting, and export options. |
PODS |
Dedicated real-time table of all active Pod replicas managed by the deployment, displaying pod health, container restarts, and node placement. |
REPLICA SETS |
History and status of underlying ReplicaSets created by the deployment controller across current and legacy revisions. |
VALIDATE |
Automated cluster diagnostics and linter checking for missing volumes, unsatisfied selectors, security context warnings, and quota constraints. |
METRICS |
Real-time aggregate telemetry graphs monitoring CPU millicore consumption, memory utilization, and network traffic across all deployment replicas. |
Deployment Details Cards
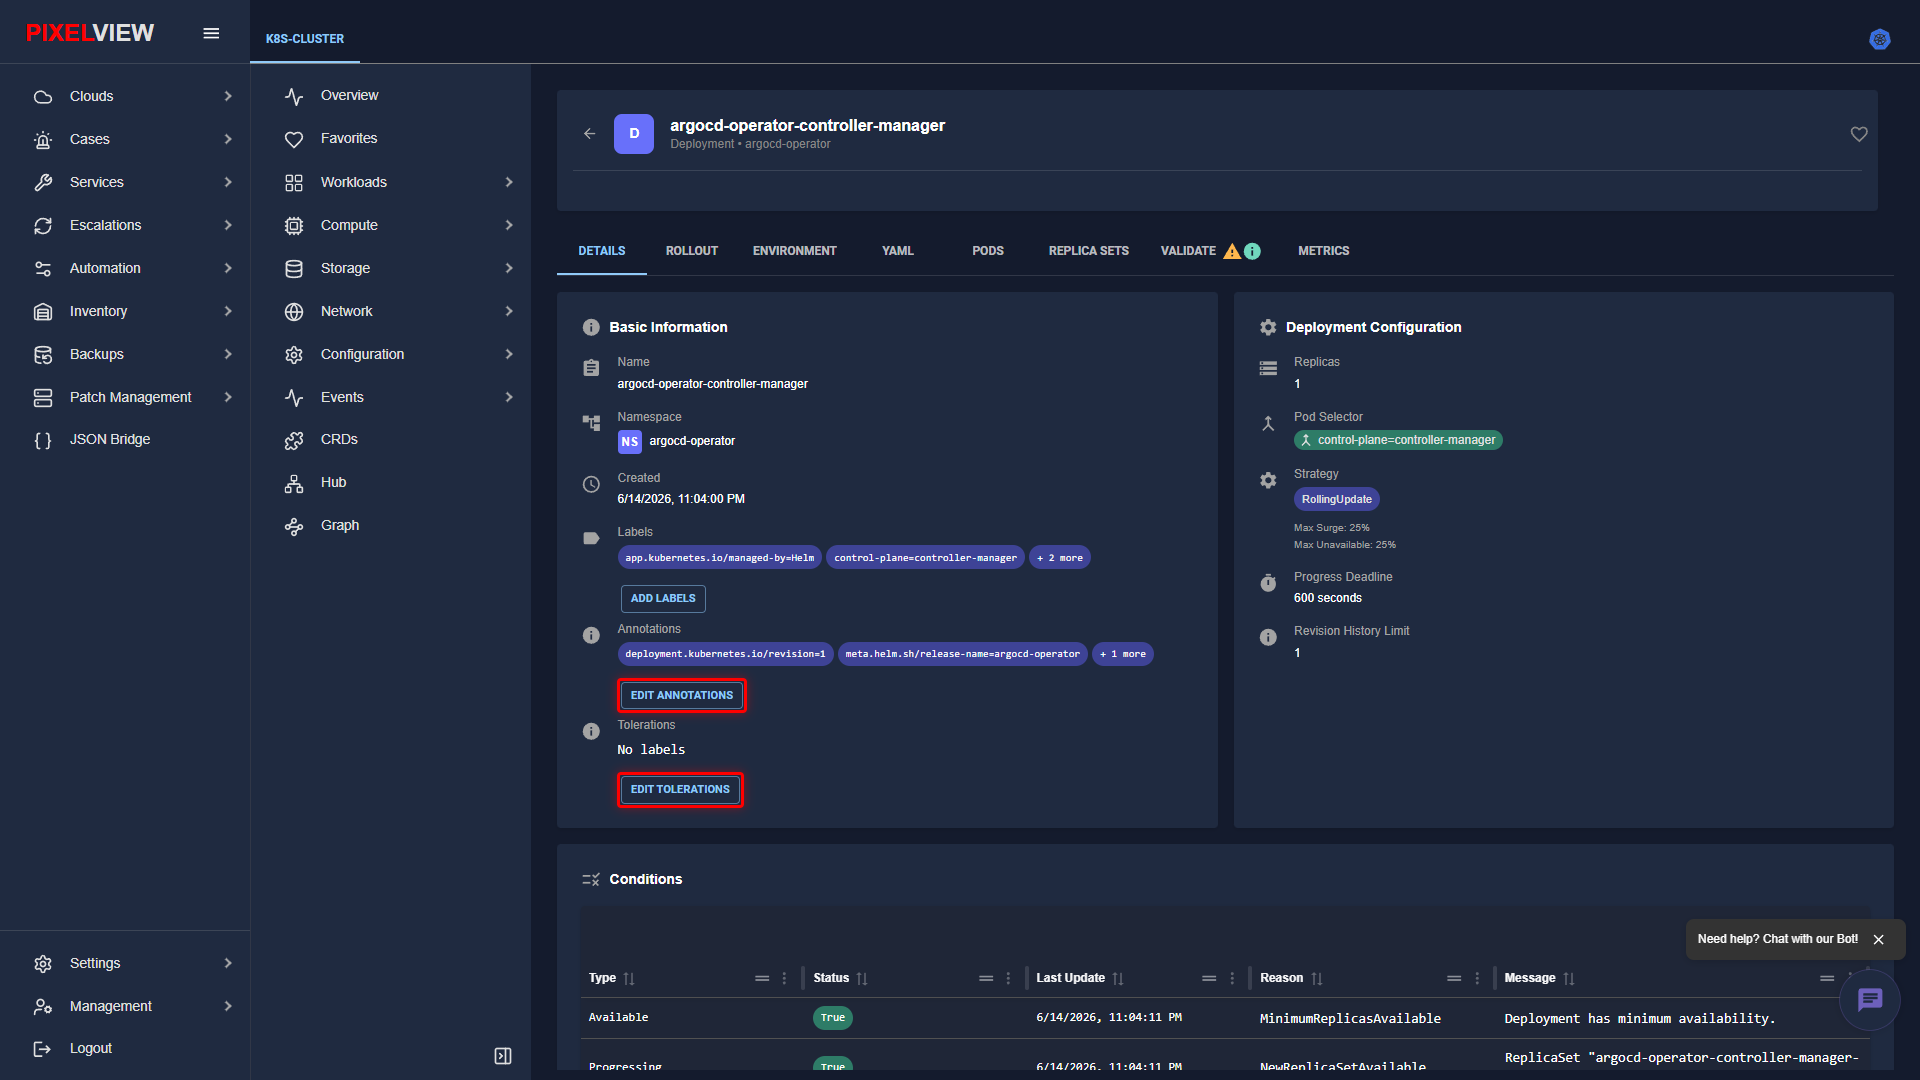
- Basic Information: Workload Name (
argocd-operator-controller-manager), Namespace badge (argocd-operator), Creation timestamp, Labels list with ADD LABELS modal, Annotations list with EDIT ANNOTATIONS modal, and Tolerations list with EDIT TOLERATIONS modal. - Deployment Configuration: Desired Replicas, Pod Selector badge query (
control-plane=controller-manager), Deployment Strategy (RollingUpdatewith Max Surge25%and Max Unavailable25%), Progress Deadline (600s), and Revision History Limit (1). - Conditions: Real-time controller conditions table tracking
AvailableandProgressingstates, status badges (True/False), last update timestamps, and controller reason messages. - Containers: List of container specifications, base images, port bindings, resource requests/limits, and health probe definitions.
Editing Deployment Annotations & Tolerations
Operators can modify workload metadata and pod scheduling rules directly from the Basic Information card without redeploying manifests:
- Locate the EDIT ANNOTATIONS and EDIT TOLERATIONS buttons on the Basic Information card:
- Editing Annotations: Clicking the
EDIT ANNOTATIONSbutton opens the dedicated configuration dialog:
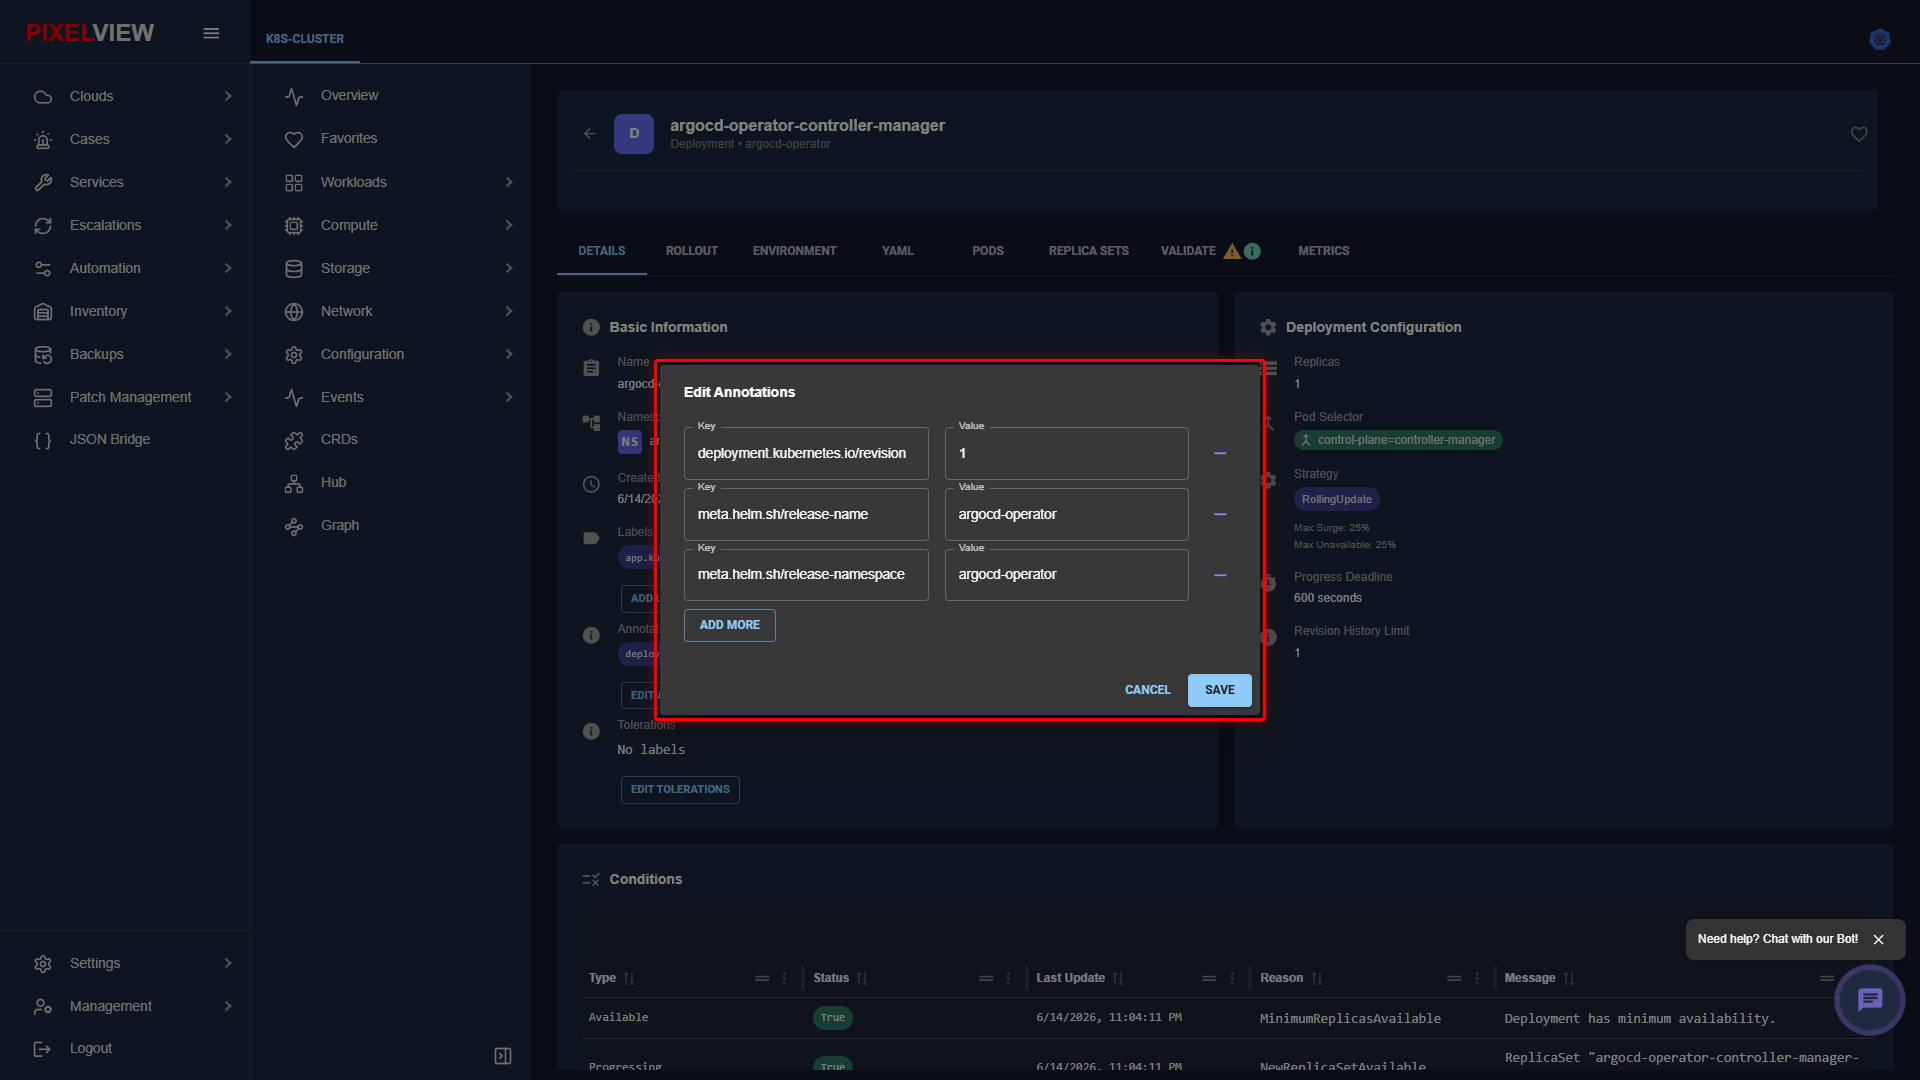
- Configure annotation parameters:
- Key & Value pairs: Edit existing keys (such as
deployment.kubernetes.io/revisionor Helm release metadata) or add new custom operational tracking tags. - ADD MORE: Dynamically appends additional key-value input fields.
- Remove (
-): Deletes selected annotation entries. -
Click SAVE to persist changes directly to cluster etcd state.
-
Editing Tolerations: Clicking the
EDIT TOLERATIONSbutton launches the scheduling constraints dialog:
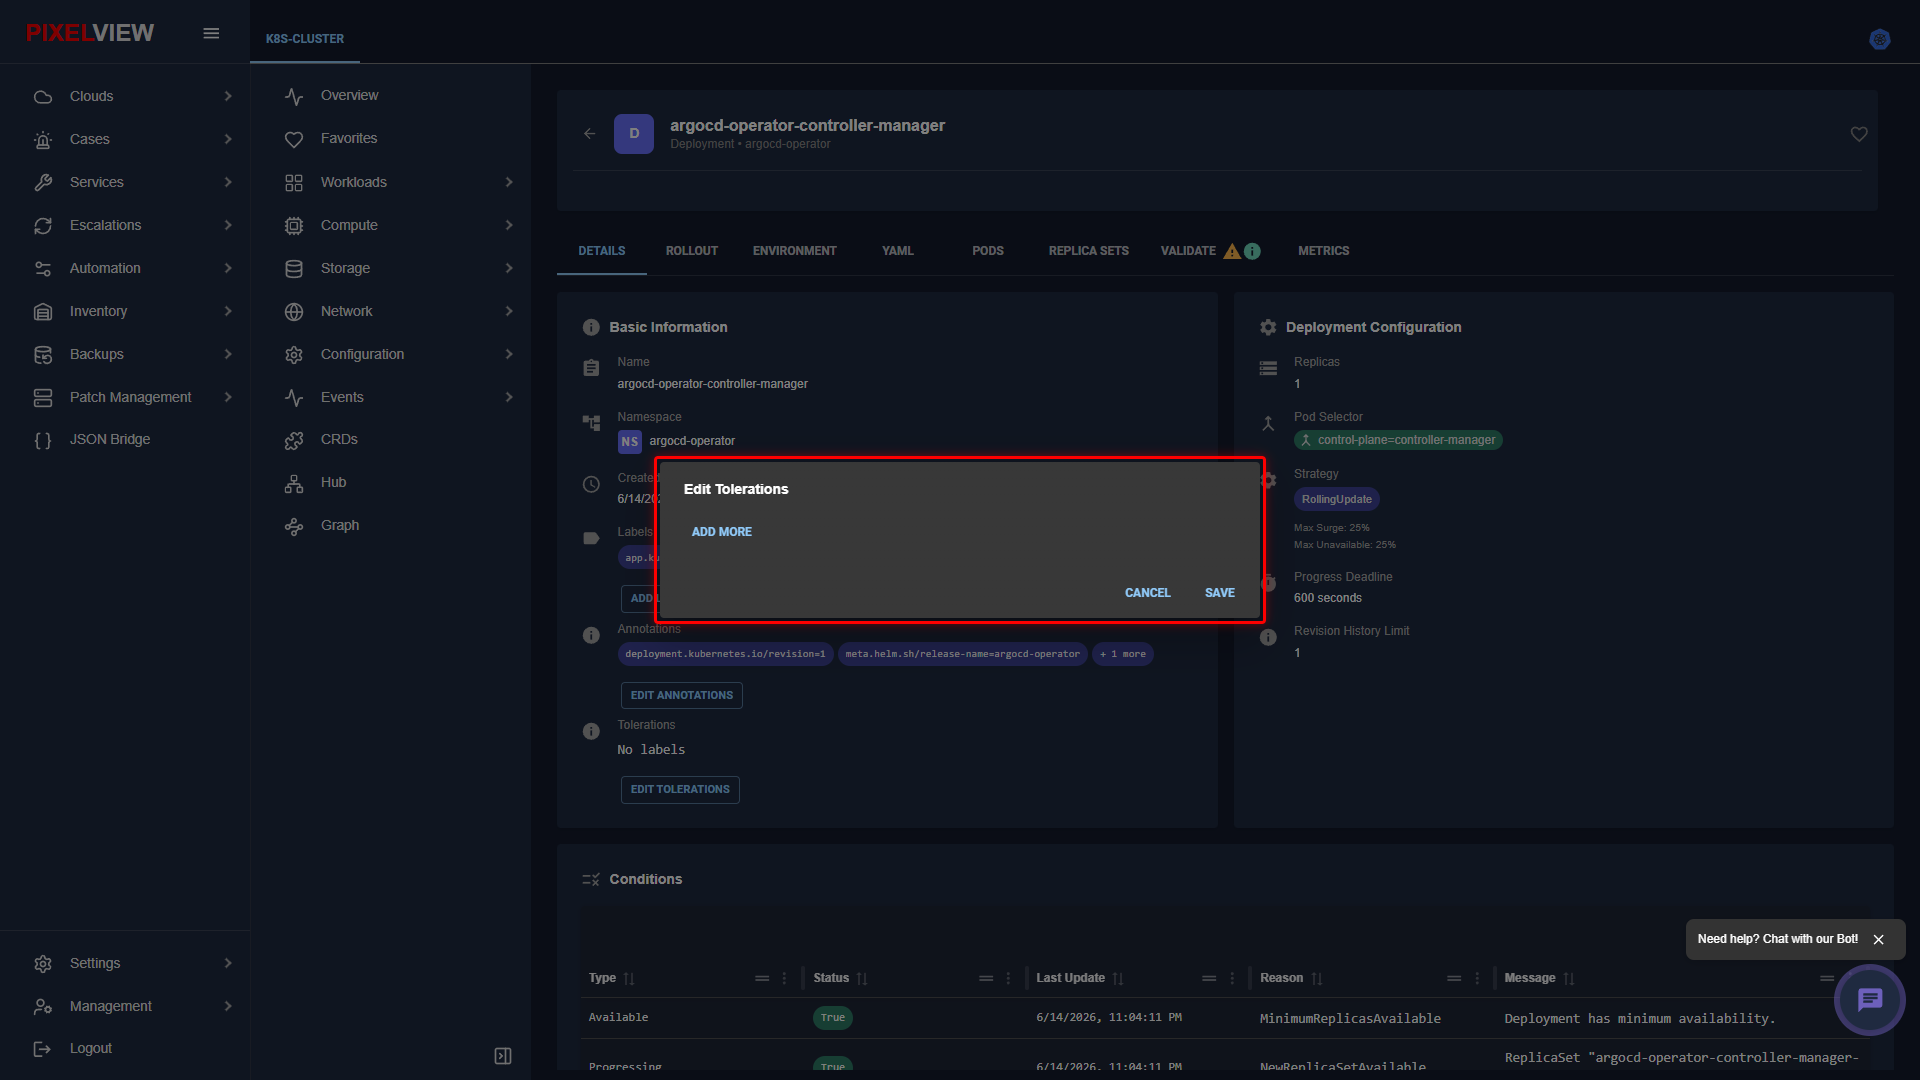
- Specify toleration keys, operator comparison conditions, values, and effects (
NoSchedule,PreferNoSchedule,NoExecute) to permit workload scheduling onto tainted worker nodes. Click SAVE to apply.
In-Place Declarative Manifest Editing (Live YAML Editor)
PixelView allows direct, live declarative modification of running deployments through the embedded Monaco code editor under the YAML tab:
- In the Deployment Details tab navigation, click the
YAMLtab:
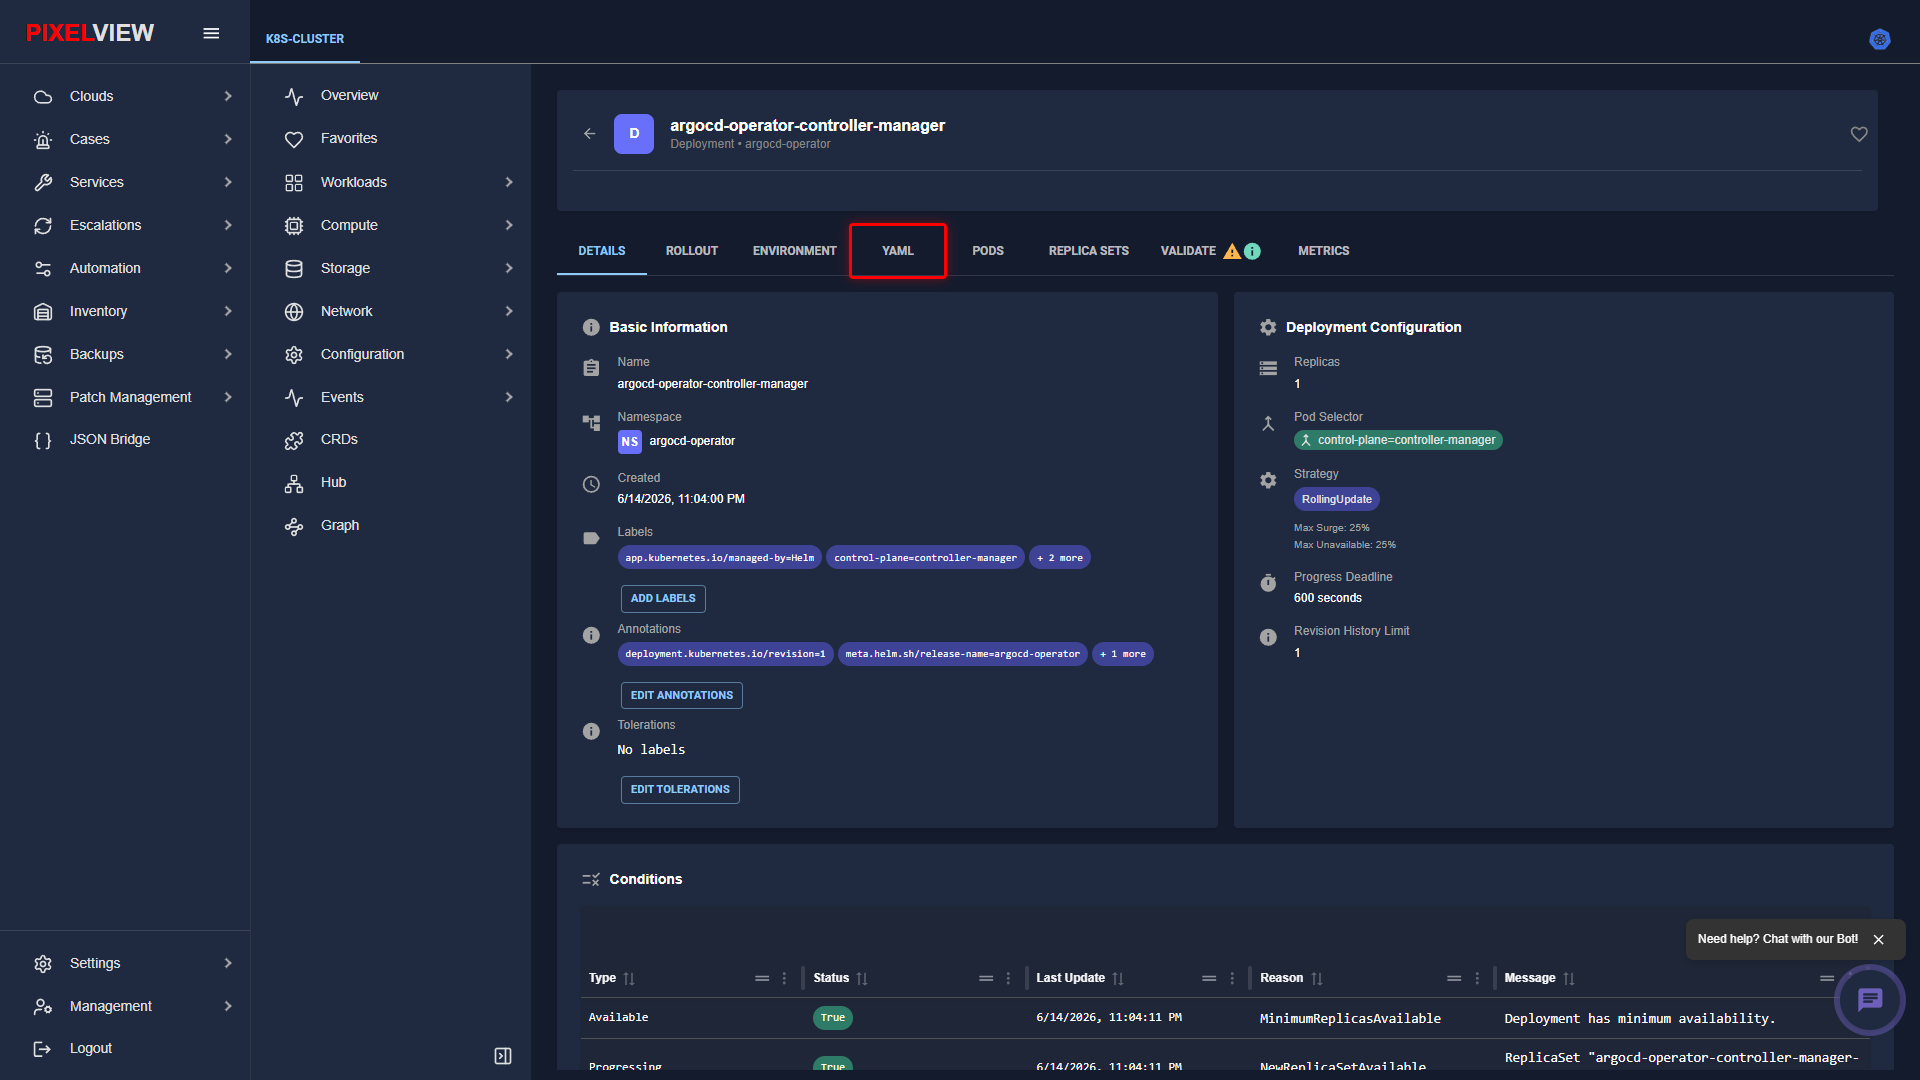
- PixelView renders the full-screen interactive YAML manifest editor:
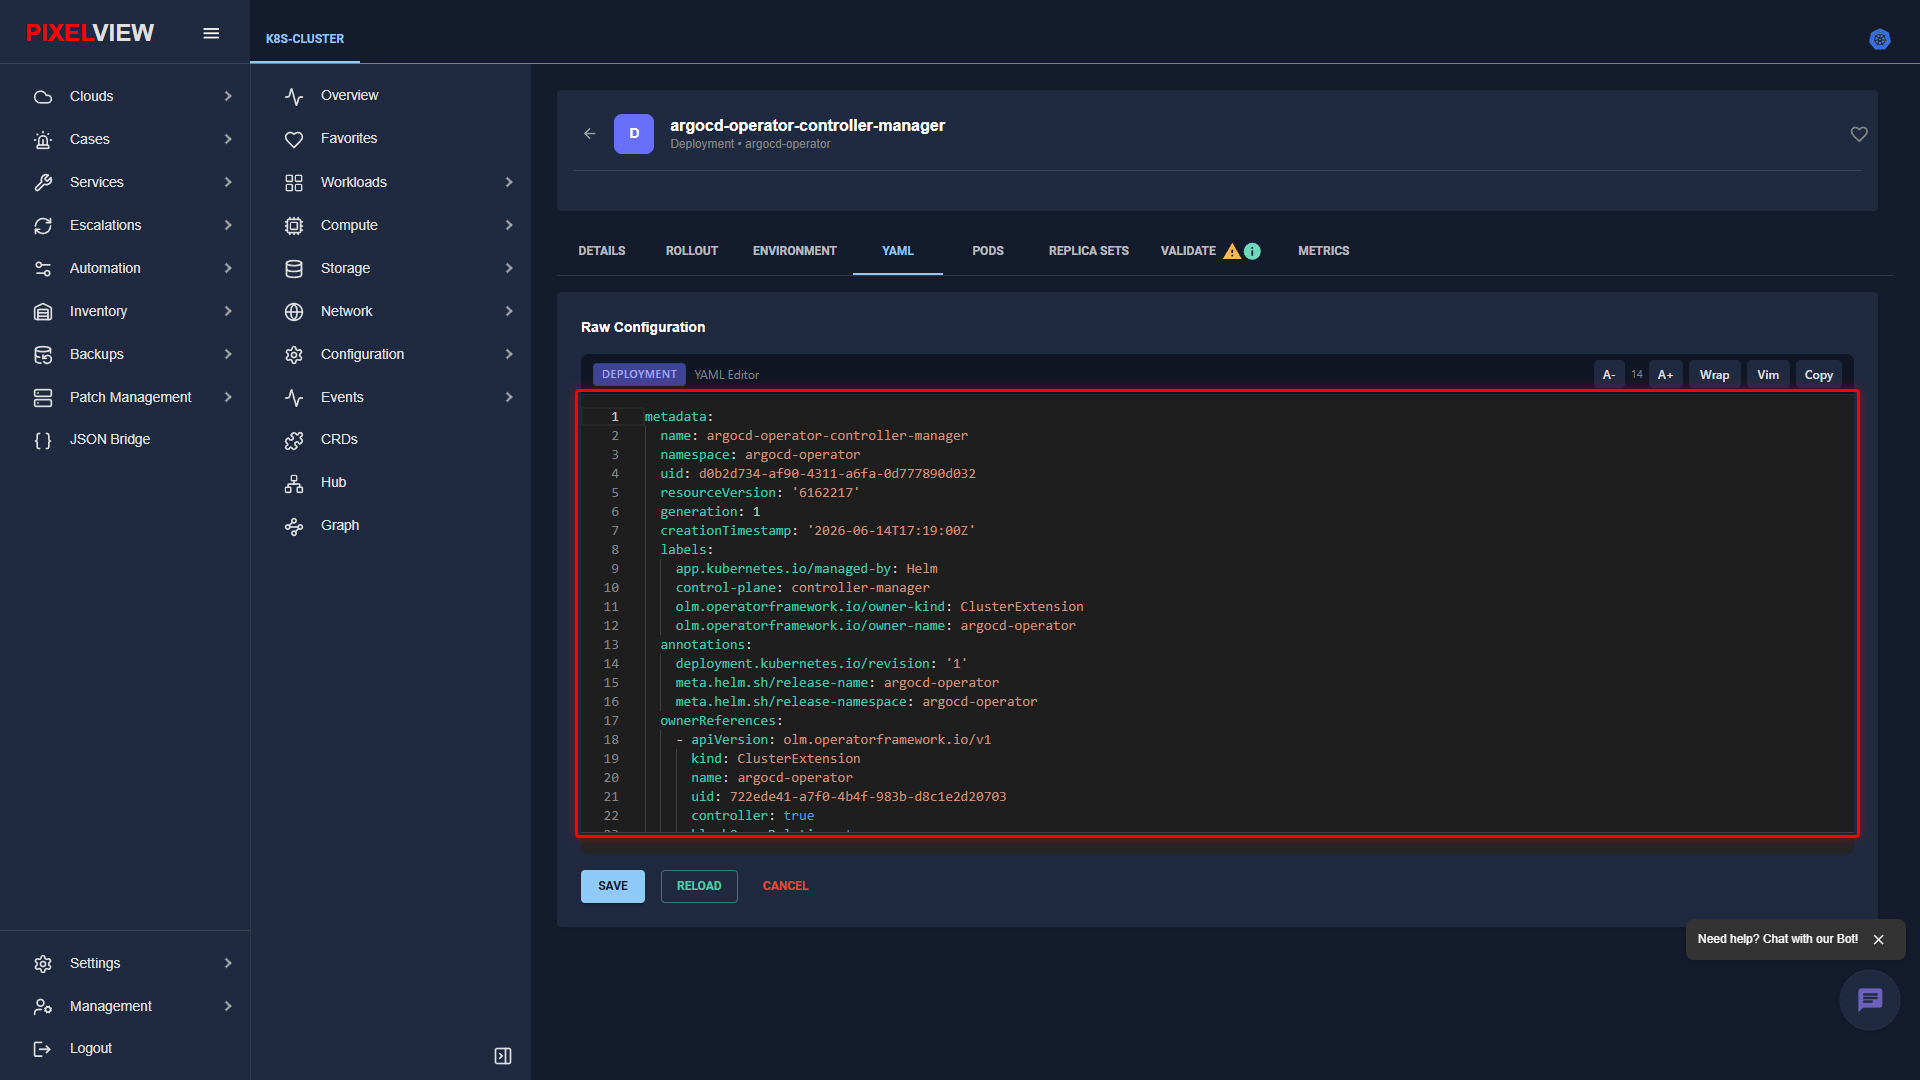
- Monaco Editor Features:
- Pre-loaded with the live cluster manifest (
Raw Configuration) synchronized from the active deployment spec. - Adjust typography using
A-/14/A+, toggle soft text wrapping (Wrap), activate modalVimmode, or copy buffer content (Copy). - Direct Spec Updates:
- Edit container images, tag revisions, environment variable maps, resource request/limit ceilings, and replica scaling parameters in-place.
- Commit Controls:
SAVE: Validates the updated YAML against Kubernetes OpenAPI schemas and pushes changes to the cluster API server, triggering immediate controller reconciliation and rolling pod updates.RELOAD: Re-queries the cluster API server to discard uncommitted local modifications and refresh with current cluster state.CANCEL: Resets the editor buffer without applying modifications.
Replica Sets
ReplicaSets guarantee the availability of a specified number of identical Pods at any given time, automatically replacing failed or terminated instances.
Replica Sets Table Overview
Navigate to Workloads → Replica Sets in the secondary sidebar:
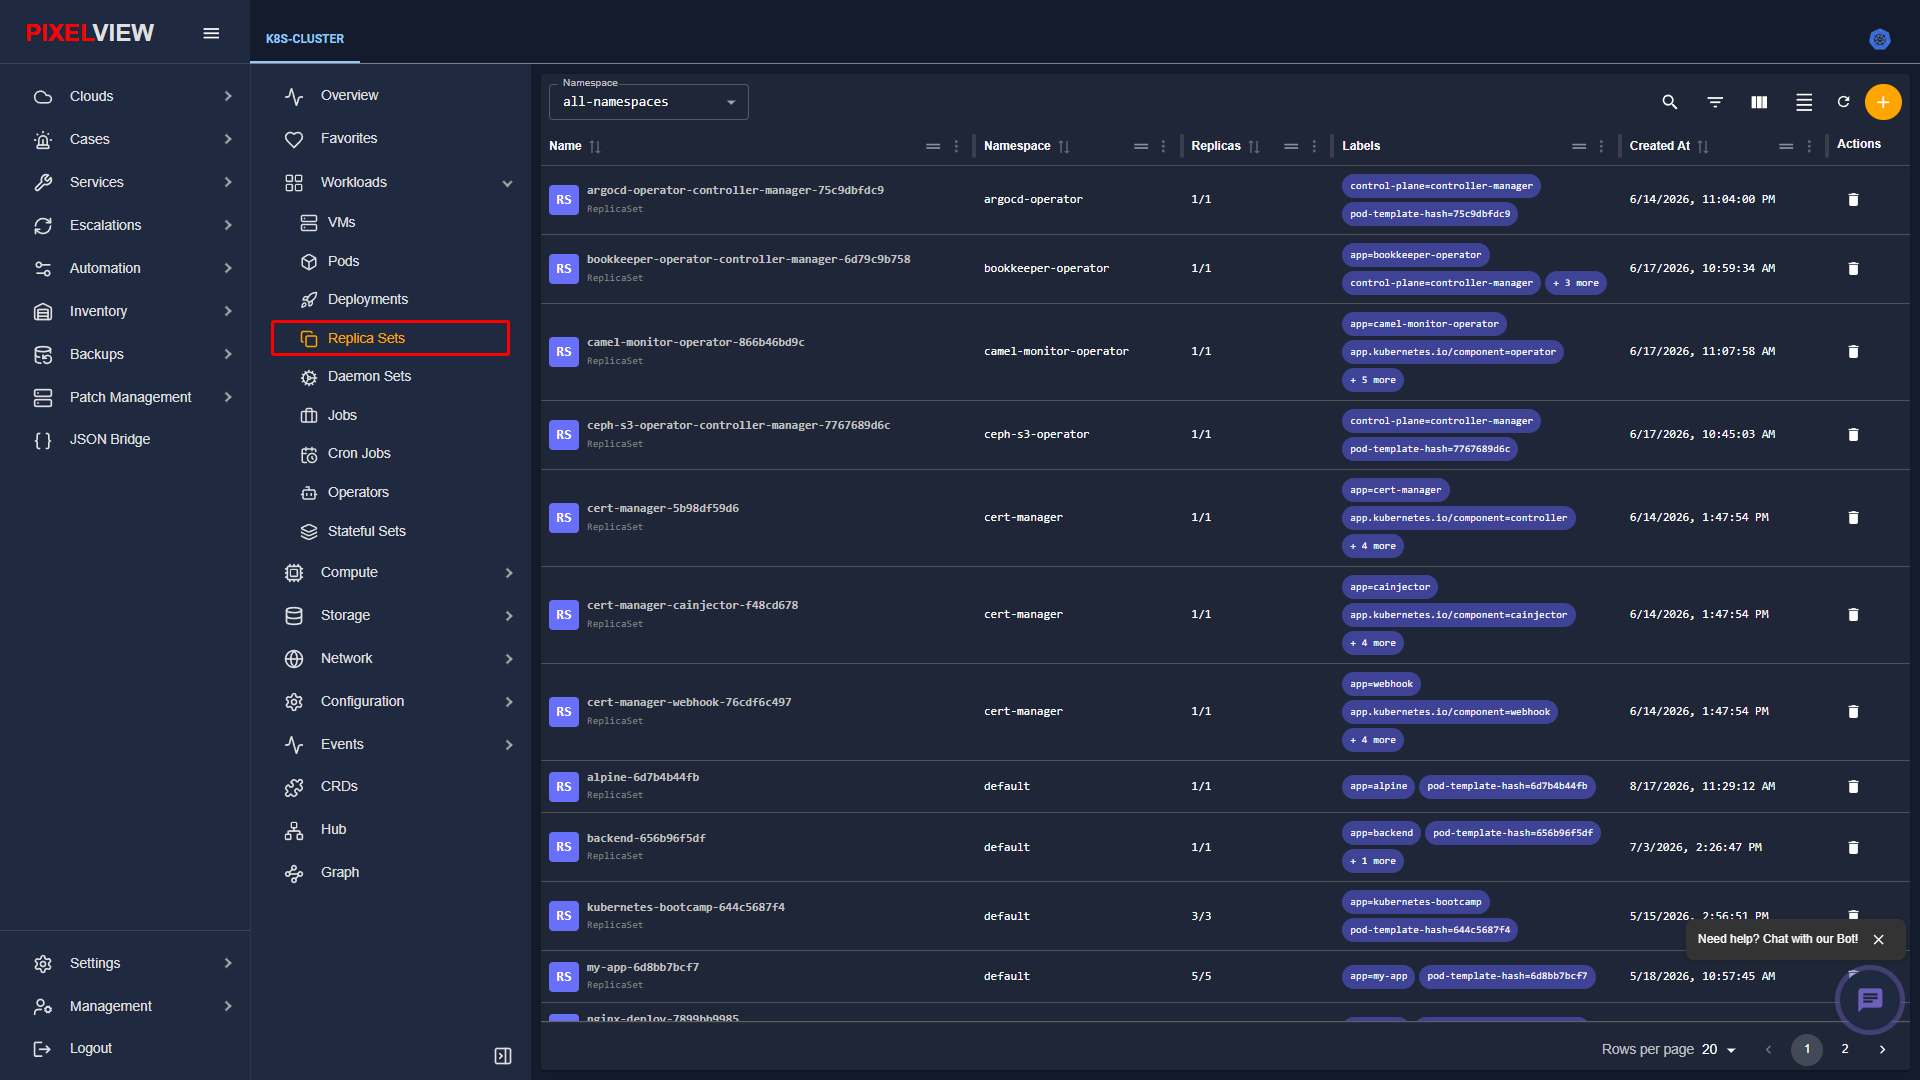
| Column | Description |
|---|---|
| Name | ReplicaSet name containing the parent deployment revision hash. |
| Namespace | Host namespace boundary. |
| Desired / Current / Ready | Pod replica metrics verifying active scaling reconciliation. |
| Owner Reference | Parent controller link (e.g., managing Deployment). |
| Age | Duration elapsed since ReplicaSet creation. |
Daemon Sets
DaemonSets ensure that all (or some) physical nodes run a copy of a specific Pod, commonly used for log collection (Fluentd), cluster storage daemons, and node monitoring agents.
Daemon Sets Table Overview
Navigate to Workloads → Daemon Sets in the secondary sidebar:
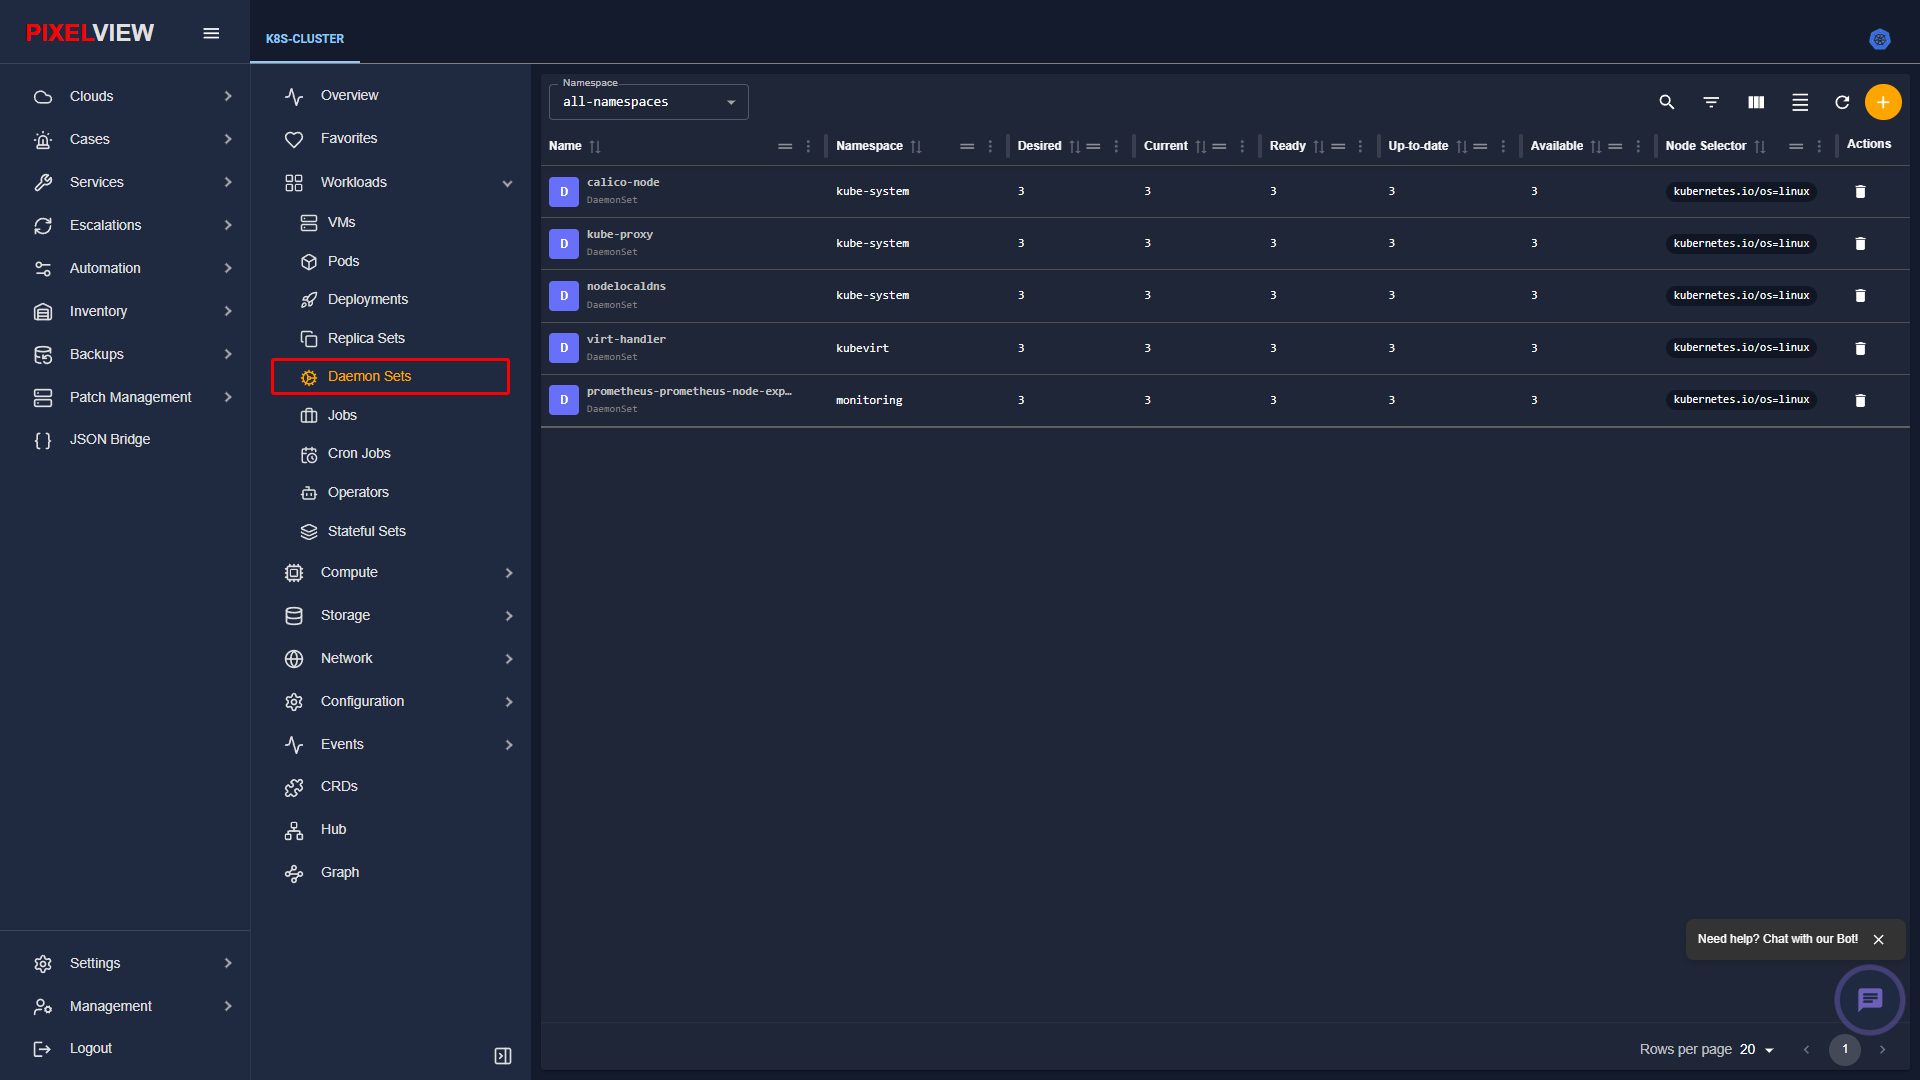
| Column | Description |
|---|---|
| Name | DaemonSet daemon service name (e.g., kube-proxy, CNI networking agents). |
| Namespace | Scoped system or application namespace. |
| Desired / Current / Ready | Target node coverage metrics verifying node daemon scheduling. |
| Up-to-Date | Number of member pods matching the current pod template revision. |
| Available | Healthy daemon instances serving traffic. |
| Age | Deployment age. |
Stateful Sets
StatefulSets manage the deployment and scaling of stateful applications, guaranteeing persistent storage identities, stable unique network hostnames, and ordered graceful termination.
Stateful Sets Table Overview
Navigate to Workloads → Stateful Sets in the secondary sidebar:
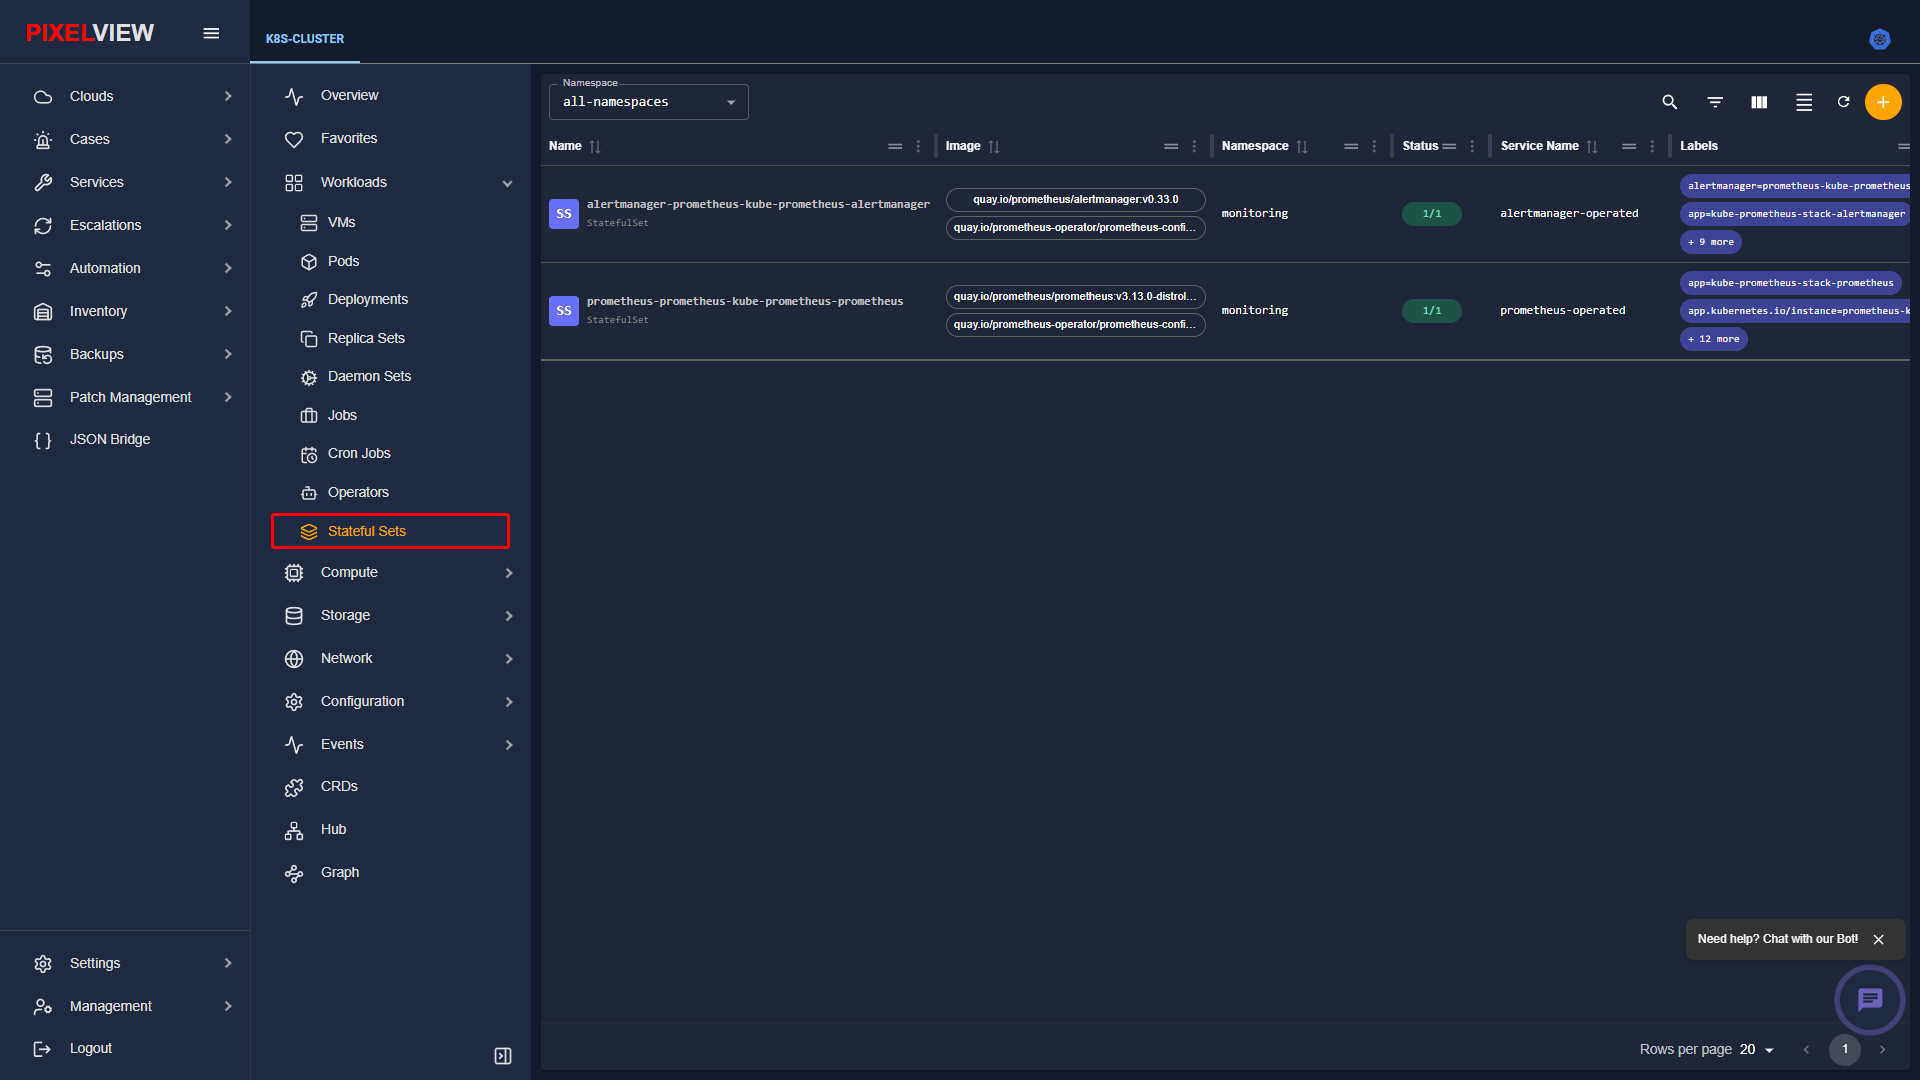
| Column | Description |
|---|---|
| Name | Stateful application cluster name (e.g., database nodes, message brokers). |
| Namespace | Tenant namespace. |
| Replicas | Desired, updated, and ready stateful pod instances (pod-0, pod-1, etc.). |
| Pod Management Policy | Scaling order (OrderedReady or Parallel). |
| Service Name | Headless governing service providing stable DNS hostnames. |
| Age | Workload operational age. |
StatefulSet Deep-Dive Inspection
Clicking any stateful set row navigates to the dedicated StatefulSet Details page (/kubernetes/:clusterName/stateful-sets/:namespace/:statefulSetName/details):
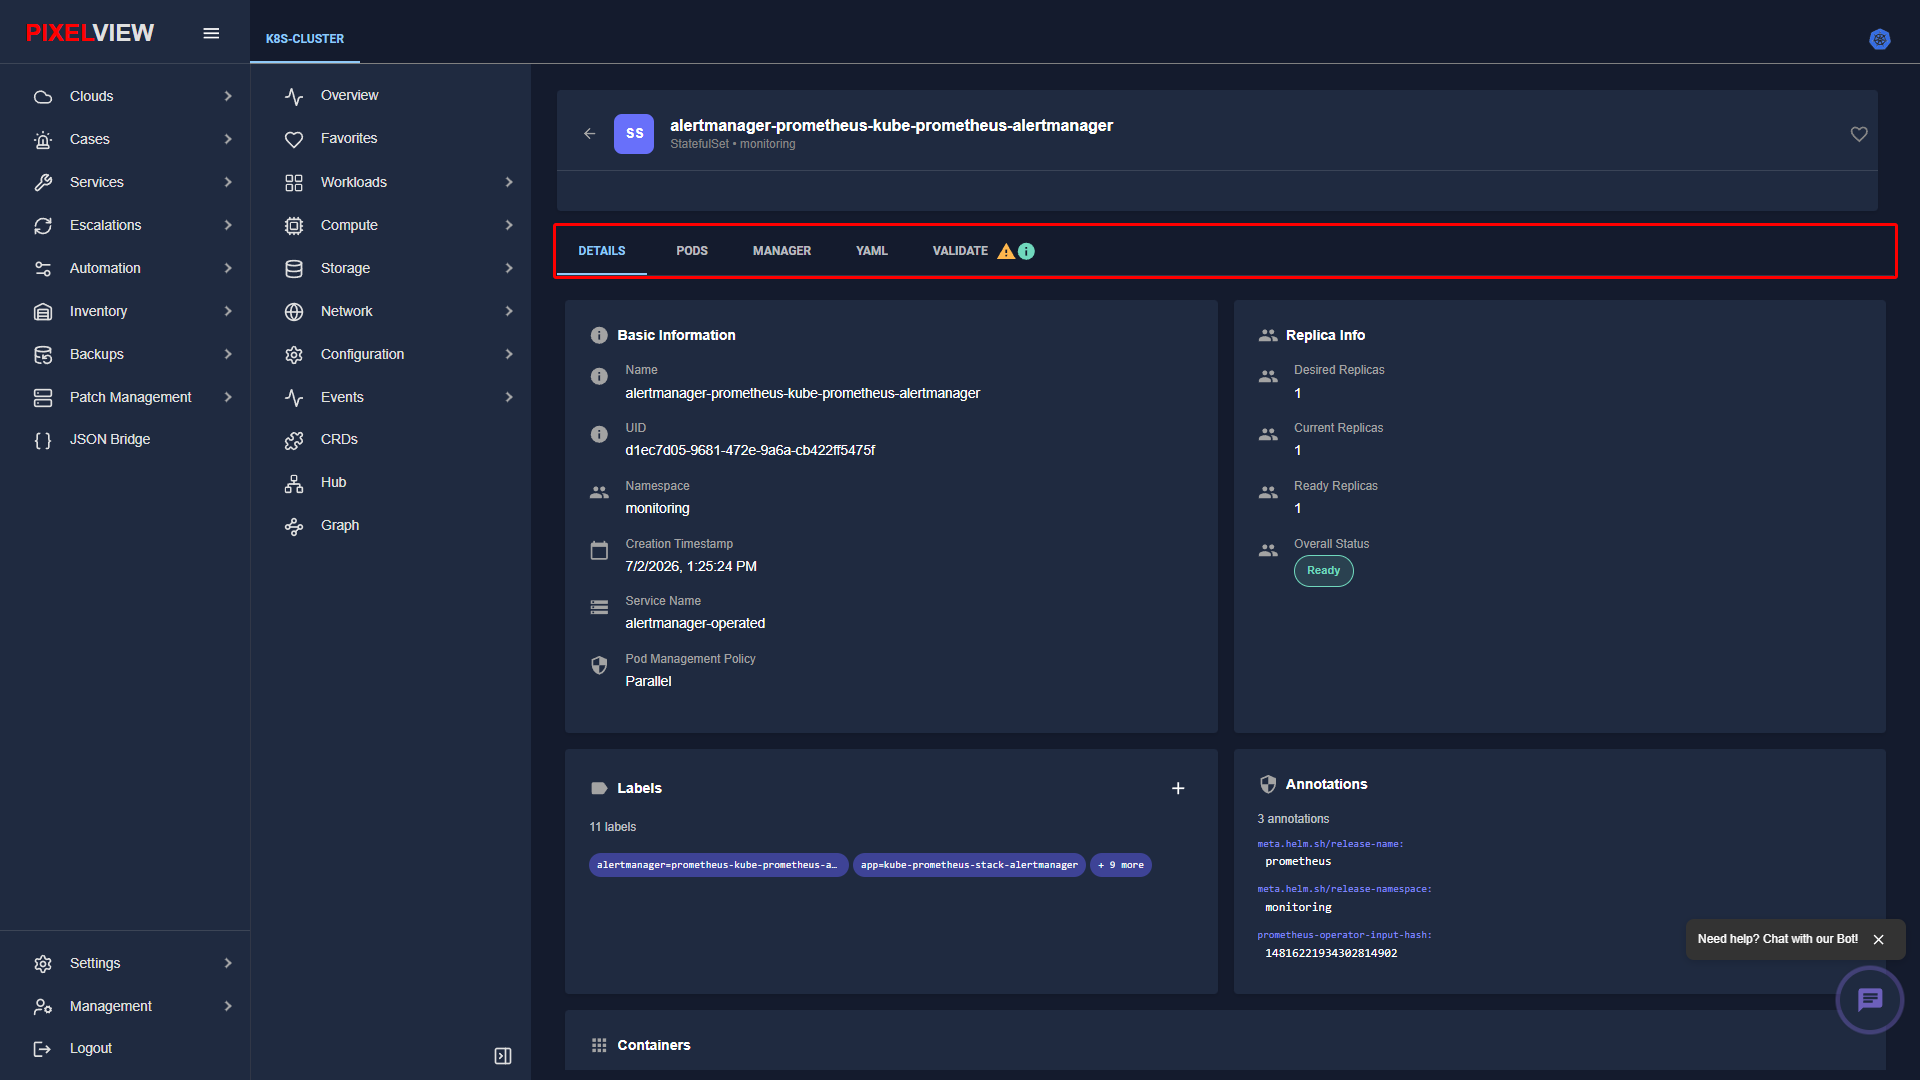
| Tab | Purpose & Capabilities |
|---|---|
DETAILS |
Core stateful configuration, desired vs current replica health, headless service bindings, pod management policy, and container specs. |
PODS |
Real-time overview of ordered stateful pods (alertmanager-0, etc.) with their persistent storage bindings. |
MANAGER |
StatefulSet controller manager lifecycle status and rolling partition upgrade controls. |
YAML |
Live declarative Kubernetes StatefulSet manifest viewer and editor. |
VALIDATE |
Stateful workload configuration diagnostics and persistent storage binding validation. |
StatefulSet Details Cards
- Basic Information: Application Name (
alertmanager-prometheus-kube-prometheus-alertmanager), UID, Namespace (monitoring), Creation Timestamp, Governing Service Name (alertmanager-operated), and Pod Management Policy (Parallel). - Replica Info: Desired Replicas (
1), Current Replicas (1), Ready Replicas (1), and Overall Status badge (Ready). - Labels & Annotations: Workload identity tags (e.g.,
app=kube-prometheus-stack-alertmanager) and helm release metadata annotations. - Containers: Container image specification, volume mounts, and health probe configurations.
Batch Jobs & Scheduled CronJobs
Jobs Table Overview
Jobs execute finite, batch-processing tasks to completion, ensuring pods terminate cleanly once their target execution exits successfully.
Navigate to Workloads → Jobs in the secondary sidebar:
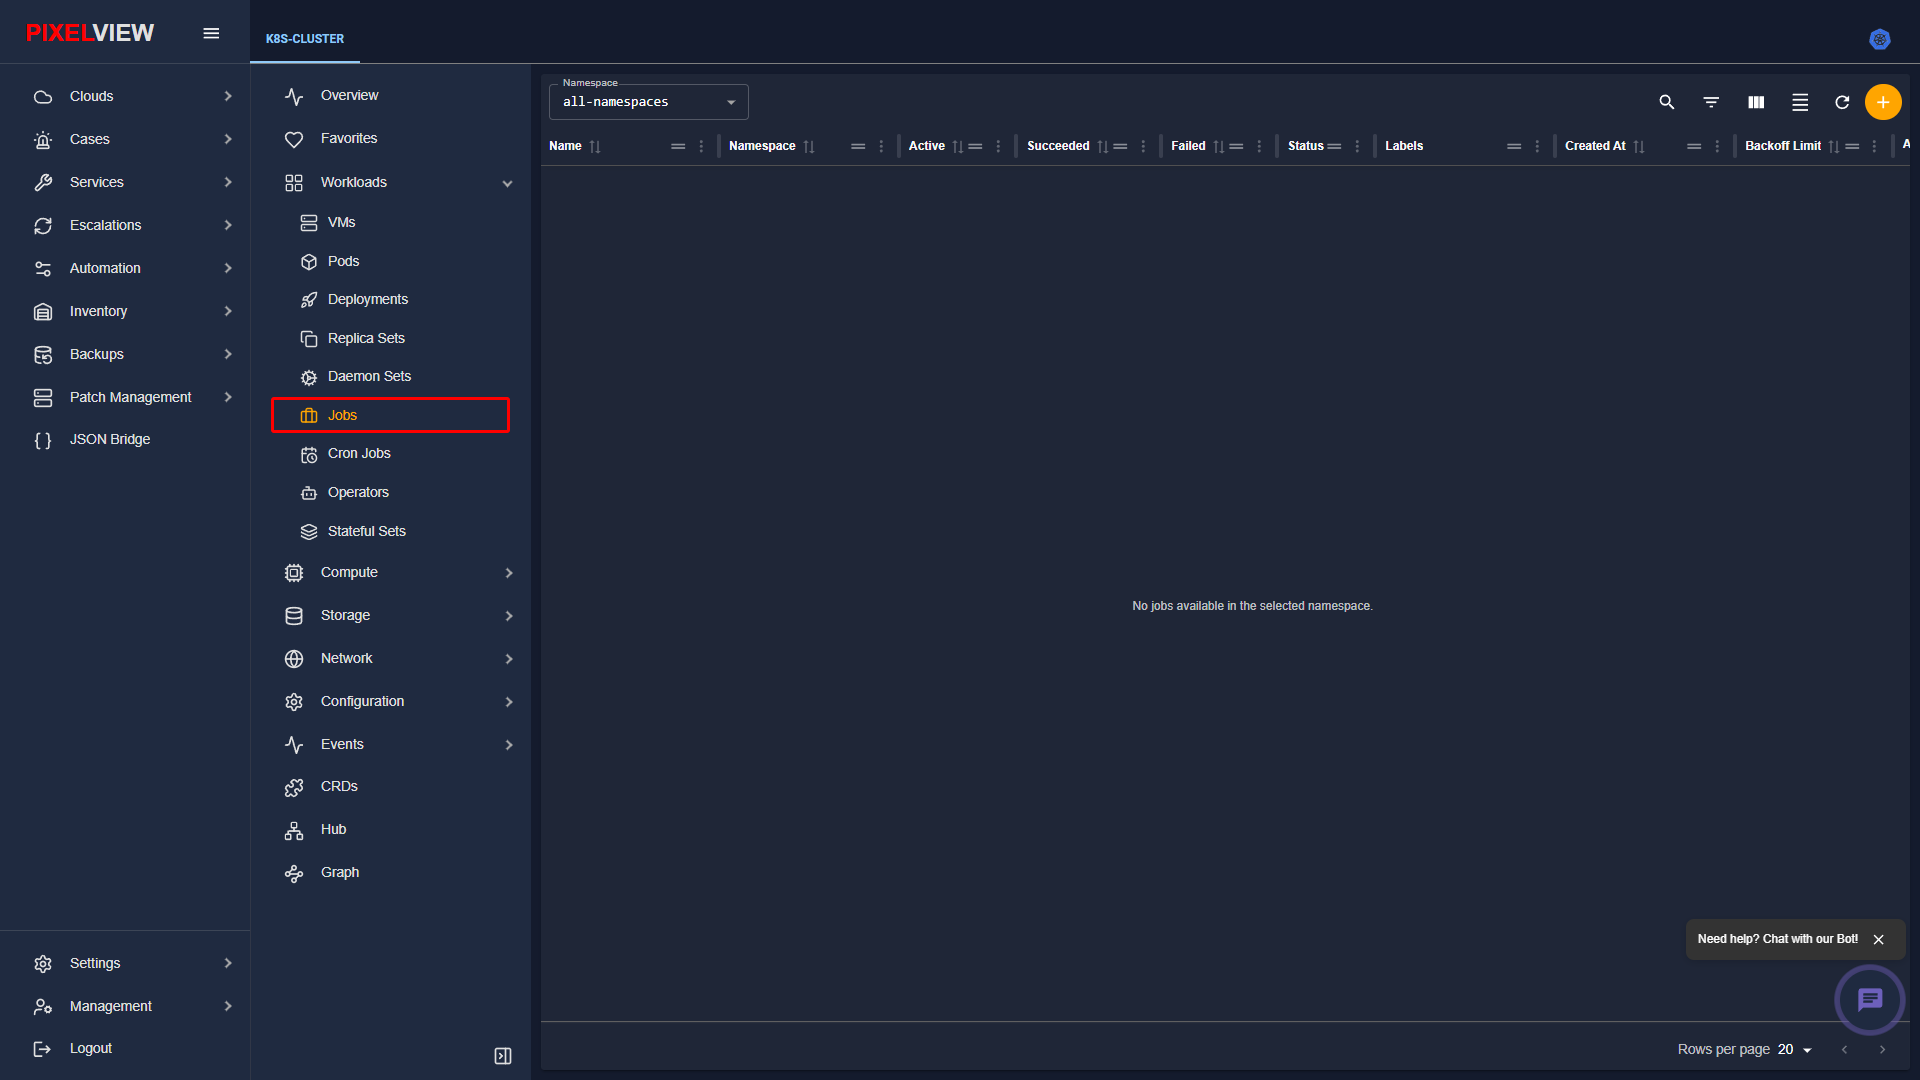
| Column | Description |
|---|---|
| Name | Batch job identifier. |
| Namespace | Scoped namespace. |
| Completions | Number of successfully completed task pods vs desired target count. |
| Duration | Execution runtime required to complete the batch payload. |
| Age | Time elapsed since job dispatch. |
Cron Jobs Table Overview
CronJobs manage time-based, recurring jobs following standard Linux crontab expressions.
Navigate to Workloads → Cron Jobs in the secondary sidebar:
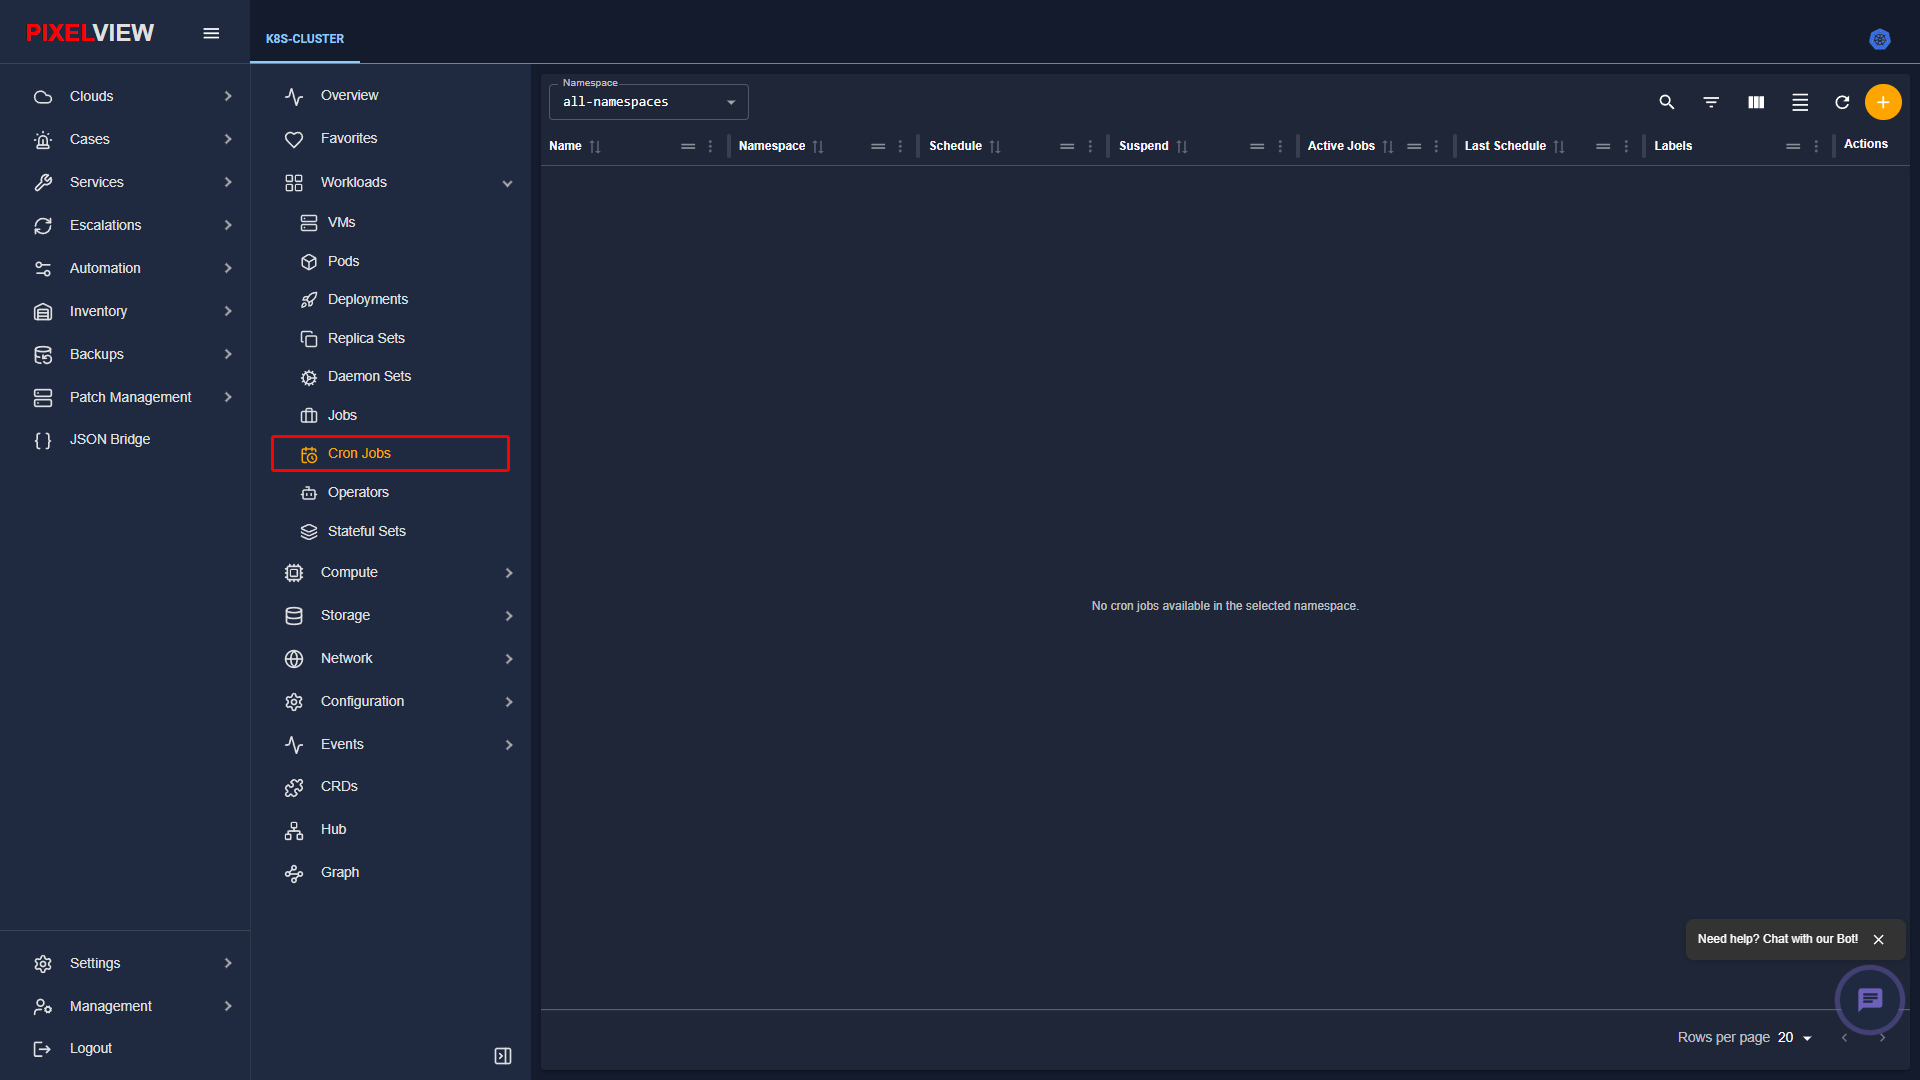
| Column | Description |
|---|---|
| Name | Scheduled task identifier. |
| Namespace | Target namespace. |
| Schedule | Crontab expression defining task frequency (e.g., 0 * * * *, */15 * * * *). |
| Suspend | Boolean indicator showing whether recurring execution is currently paused. |
| Active | Number of job instances currently executing in the cluster. |
| Last Schedule | Timestamp recording the most recent job trigger. |
Installed Operators (OLM)
The Operators catalog manages Operator Lifecycle Manager (OLM) extensions, packaging automated lifecycle management for complex Kubernetes applications.
Operators Table Overview
Navigate to Workloads → Operators in the secondary sidebar:
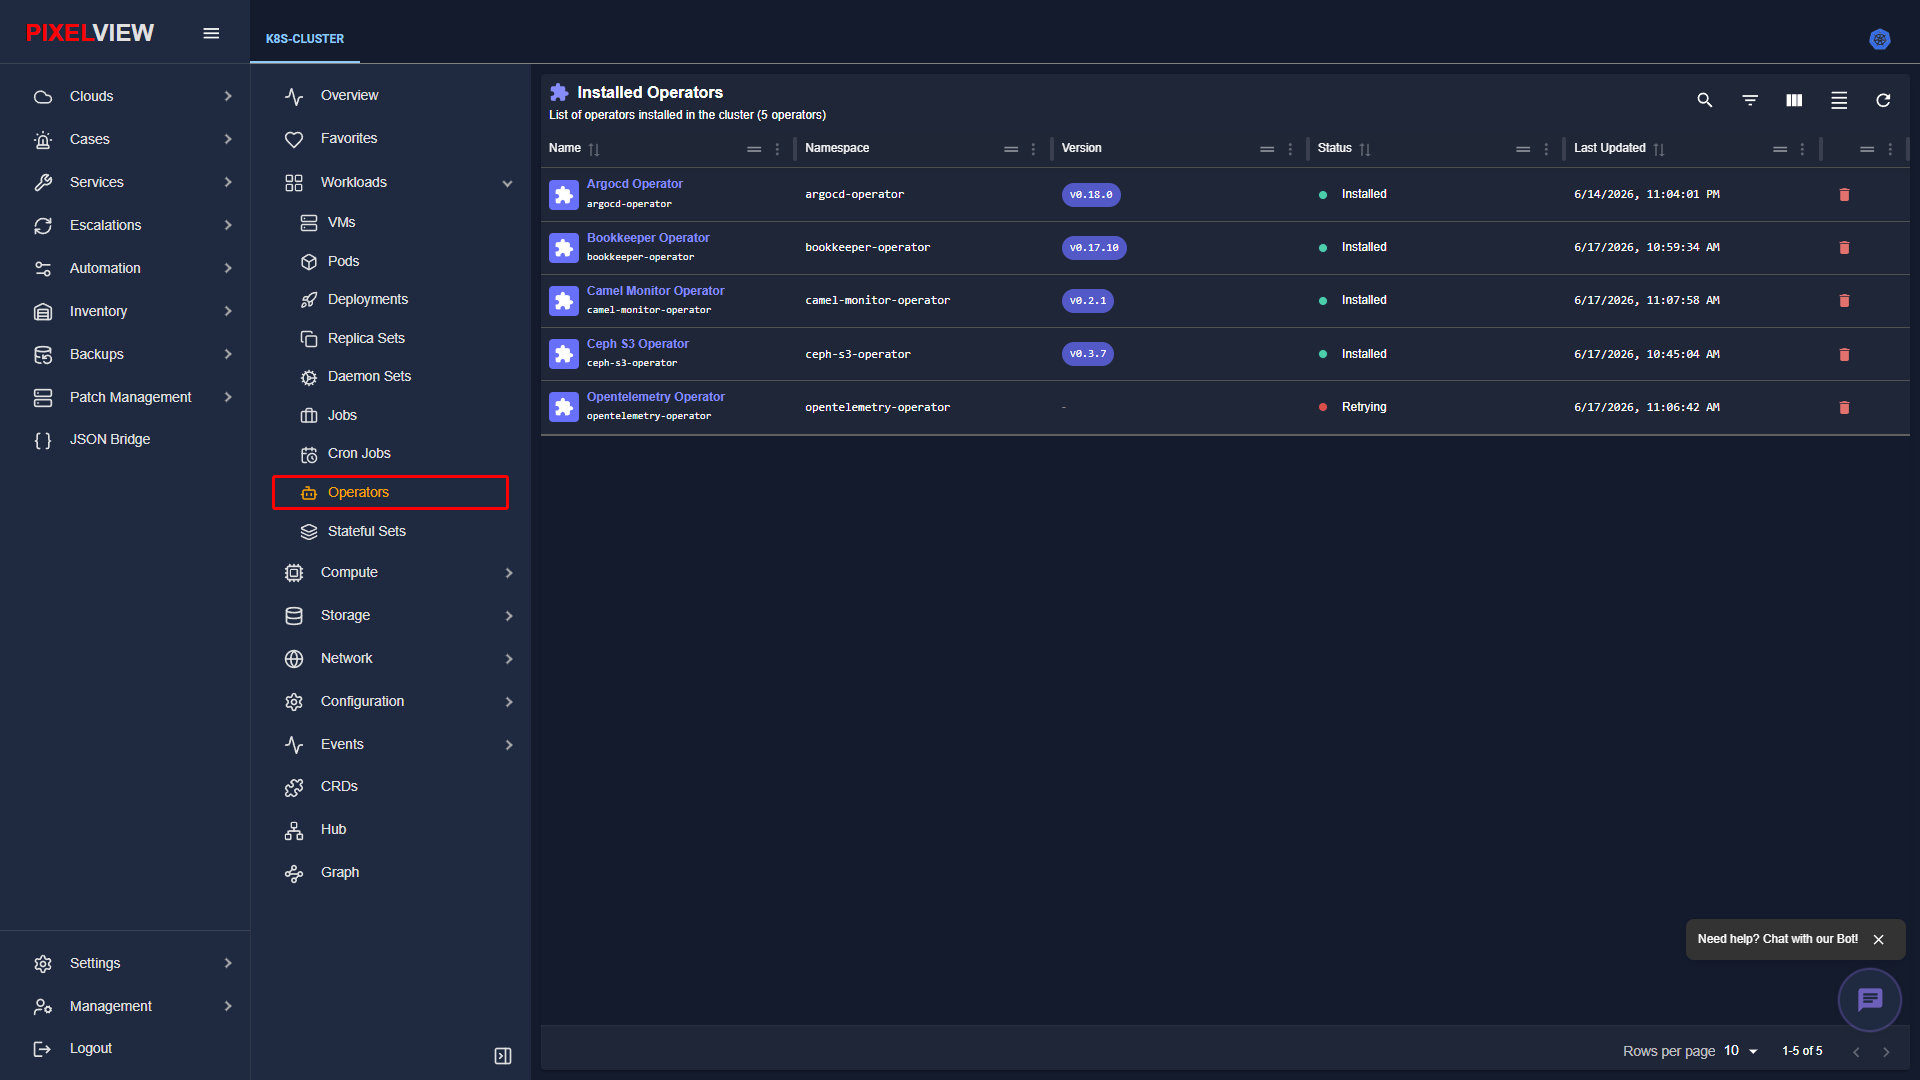
| Column | Description |
|---|---|
| Name | Operator catalog identifier (e.g., cert-manager, argocd-operator). |
| Namespace | Target operator installation namespace. |
| Version | Package release version. |
| Status | OLM subscription state: Succeeded, Installing, or Failed. |
| Provided APIs | Custom Resource Definitions managed and exposed by the operator. |
Operator Extension Inspection & Details Modal
Operators packaged via Operator Lifecycle Manager expose detailed operational telemetry, subscription specifications, and cluster condition states.
Selecting an Operator for Detailed Inspection
Clicking any installed operator row in the inventory table (e.g., argocd-operator):
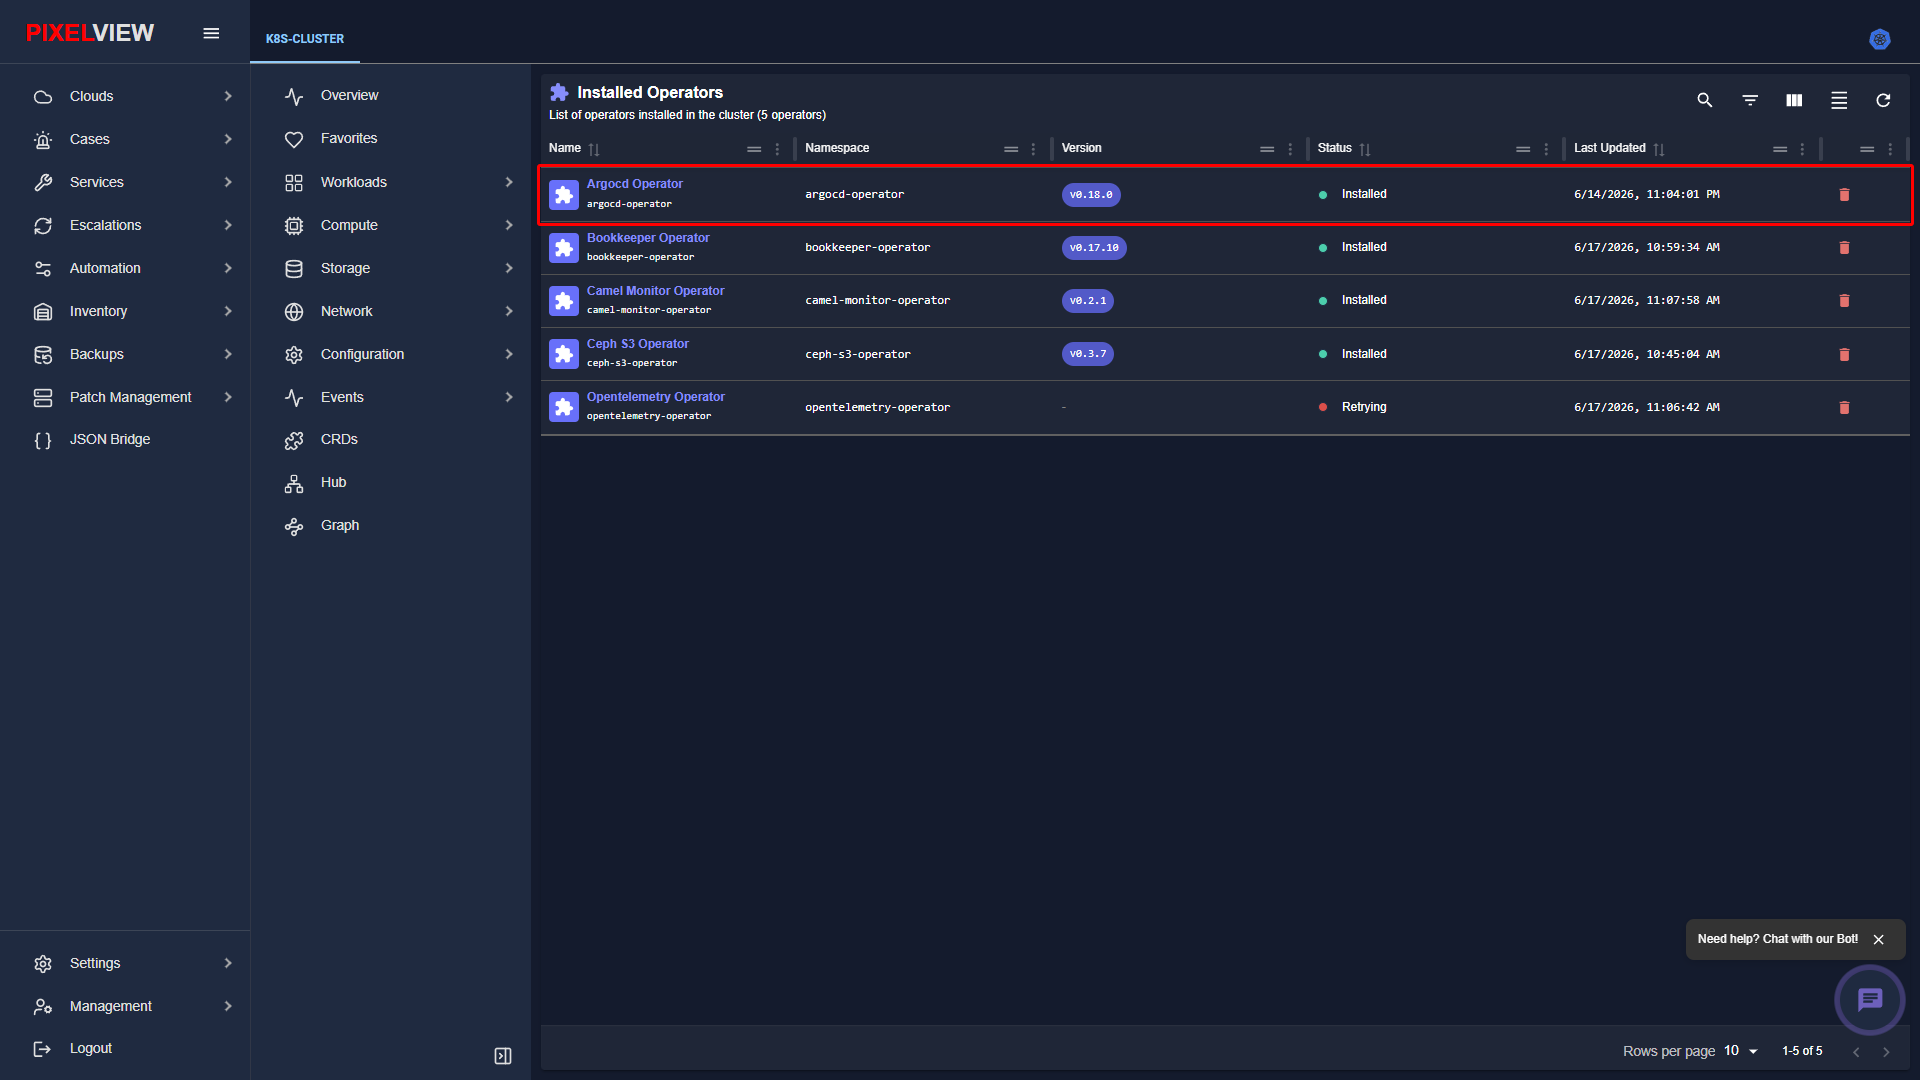
Operator Lifecycle Details Modal
Upon row selection, PixelView displays the comprehensive ClusterExtension operator details dialog:
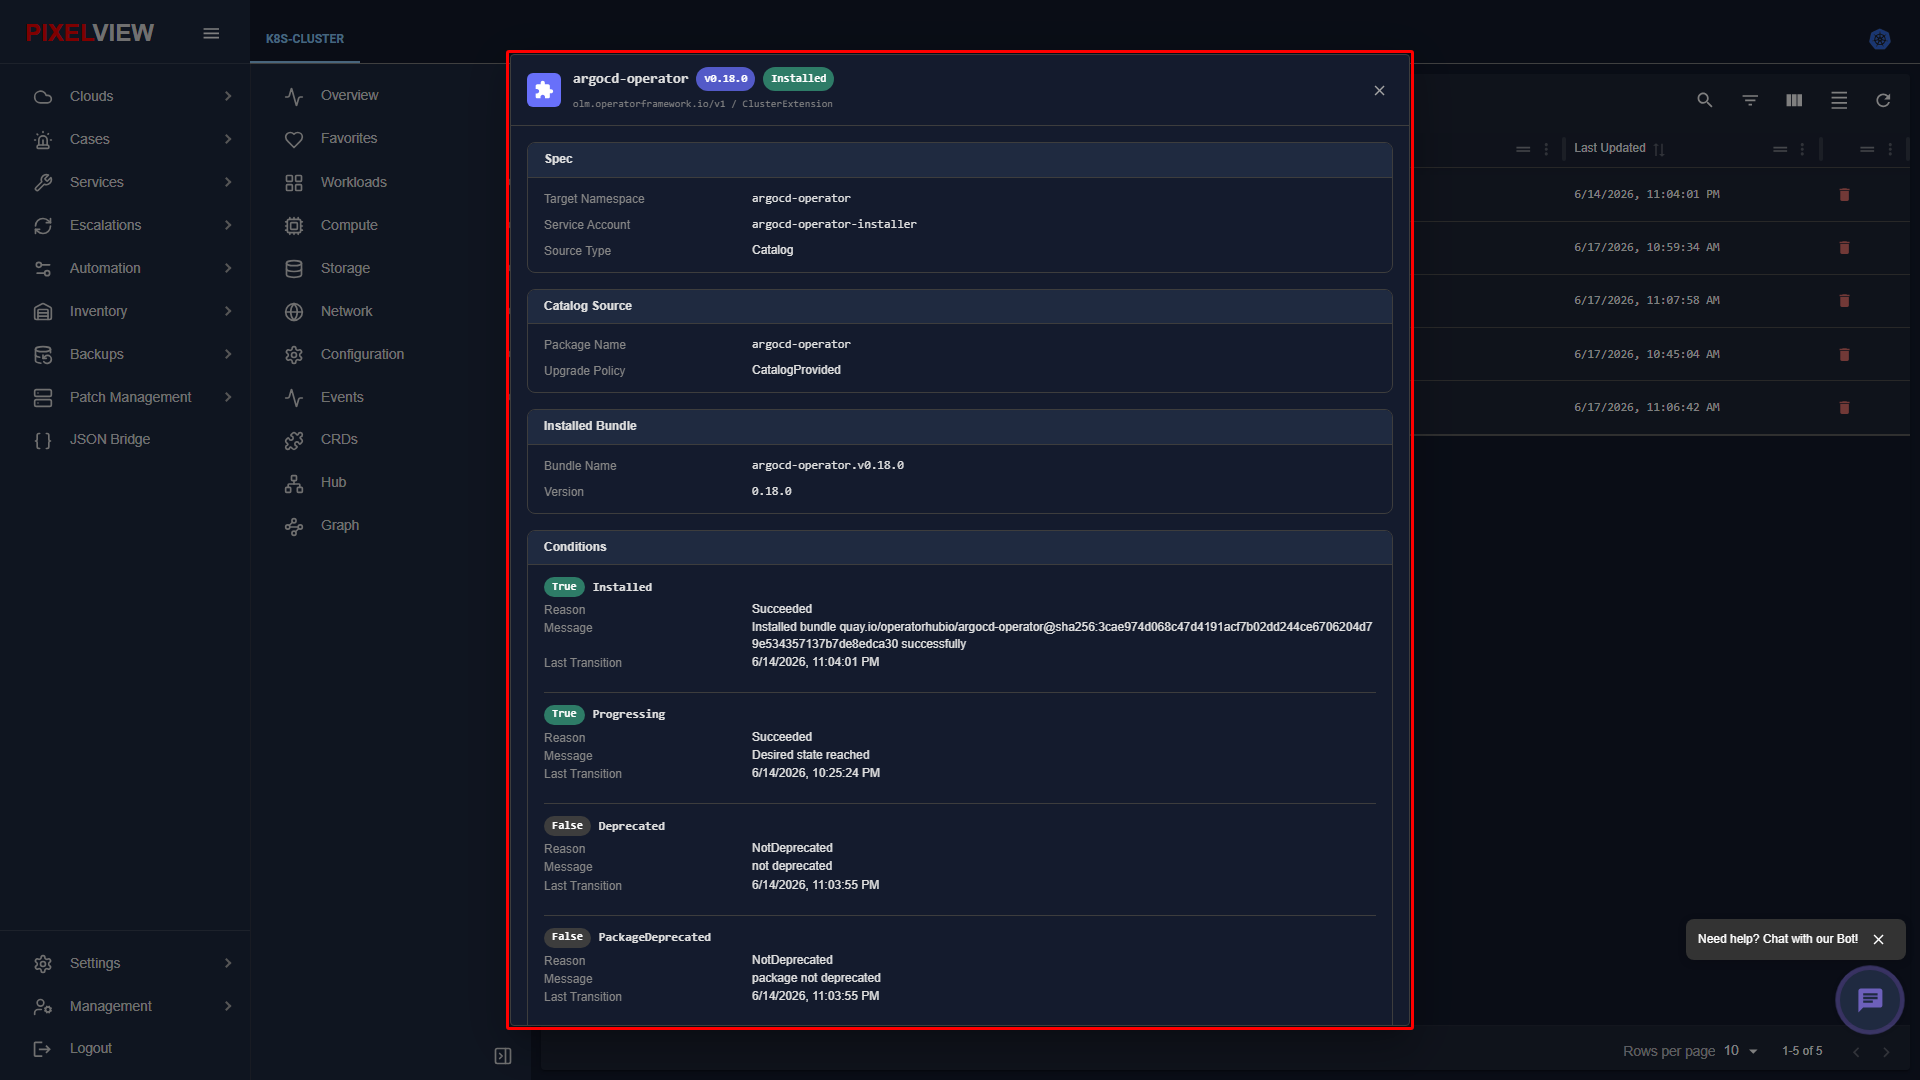
| Section | Parameter | Description |
|---|---|---|
| Header | Extension Identity | Operator display name (argocd-operator), semantic version badge (v0.18.0), operational status tag (Installed), and API group (olm.operatorframework.io/v1 / ClusterExtension). |
| Spec | Target Namespace | Deployment namespace scoping operator controllers (argocd-operator). |
| Service Account | Dedicated service account used by the operator installer (argocd-operator-installer). |
|
| Source Type | OLM package provisioner origin (Catalog). |
|
| Catalog Source | Package Name | Upstream catalog package identifier (argocd-operator). |
| Upgrade Policy | Update strategy configured for the package (CatalogProvided). |
|
| Installed Bundle | Bundle Name | Exact active OLM bundle release name (argocd-operator.v0.18.0). |
| Version | Bundle semantic release number (0.18.0). |
|
| Conditions | Lifecycle Indicators | Real-time status conditions verifying operator installation and health. |
Operator Lifecycle Conditions Breakdown
Installed(True): Verification that the OLM bundle package from the upstream image registry (quay.io/operatorhubio/argocd-operator@sha256:...) successfully unpacked and reconciled.Progressing(True): Operational check confirming that the operator deployment has reached its desired state.Deprecated(False): Upstream advisory indicating whether this operator release has reached end-of-life.PackageDeprecated(False): Catalog notice verifying whether the entire operator package line remains supported.
Compute Infrastructure
The Compute submenu provides physical and virtual hardware observability across cluster worker nodes and control-plane managers.
Cluster Nodes
Nodes are the physical or virtual worker machines that make up the Kubernetes cluster, executing container pods under kubelet supervision.
Nodes Table Overview
Navigate to Compute → Nodes in the secondary sidebar:
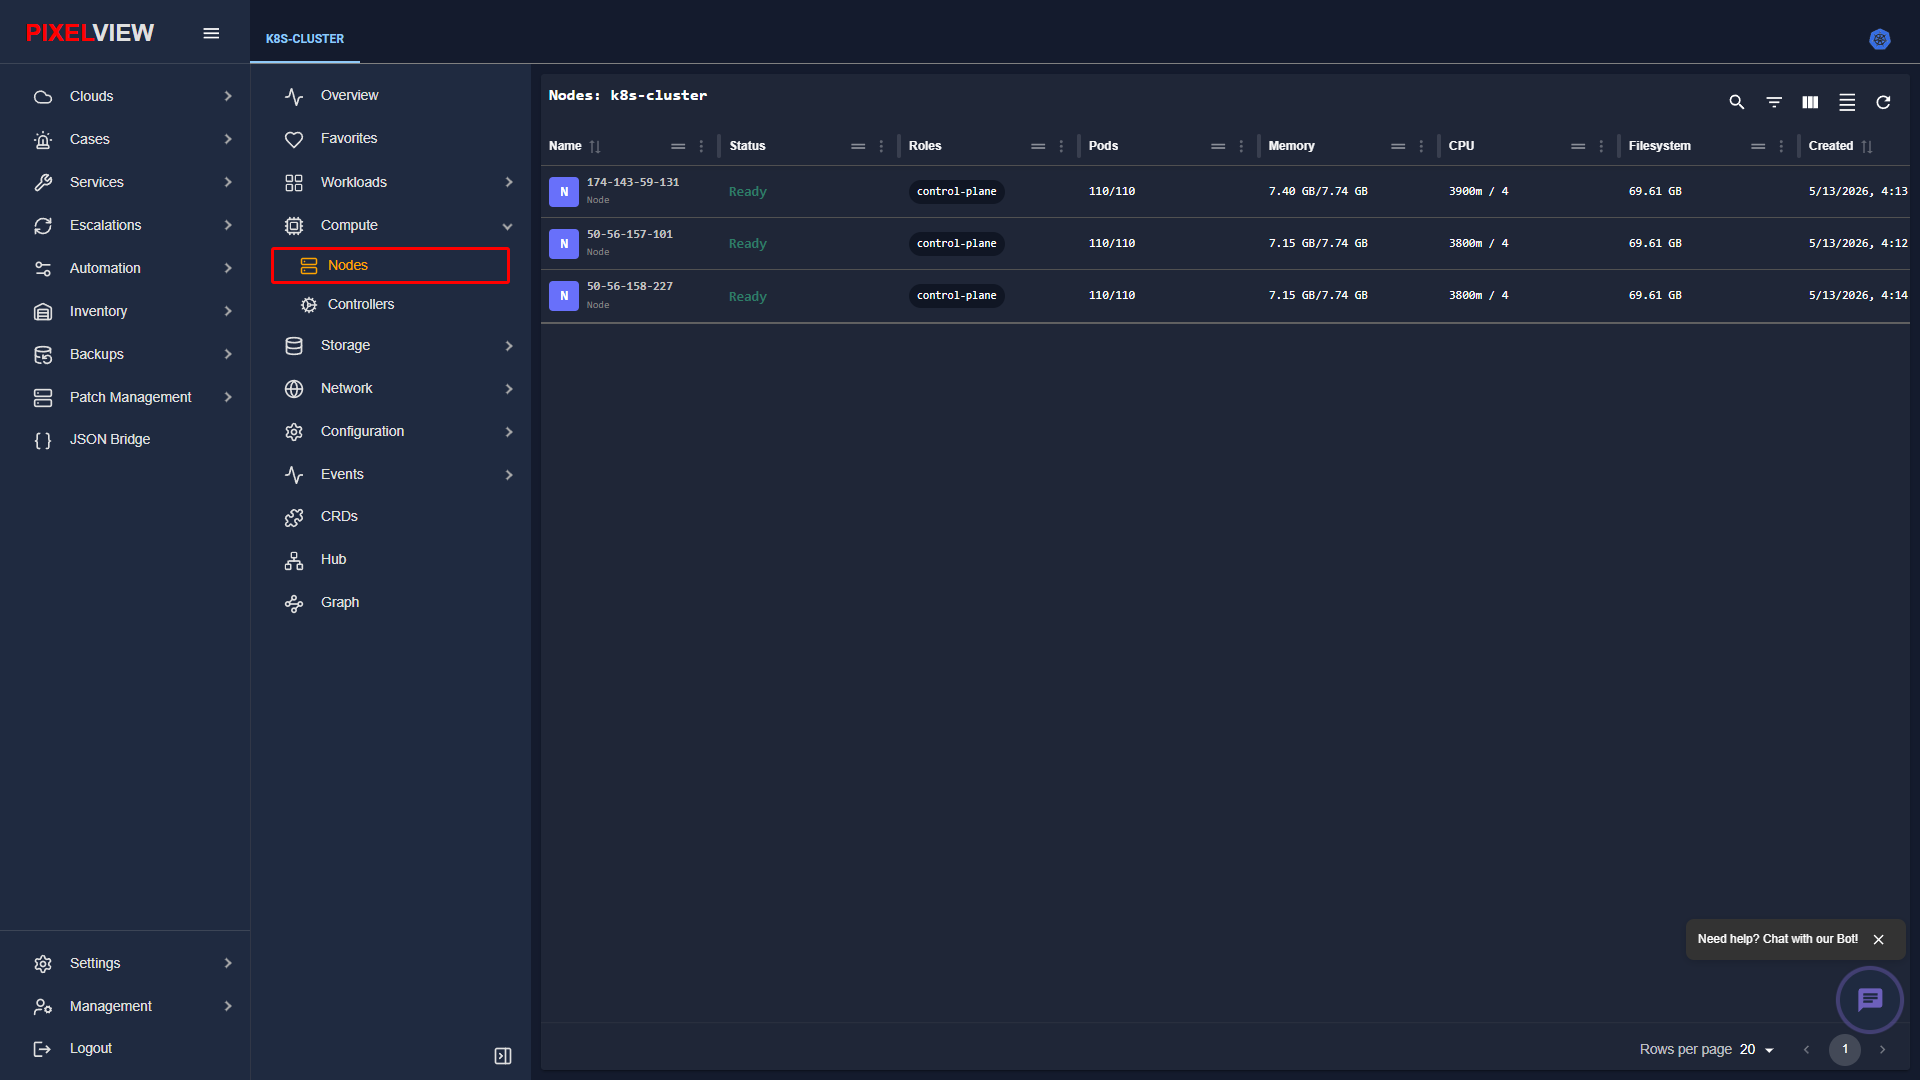
| Column | Description |
|---|---|
| Name | Node hostname / IP identifier (e.g., 174-143-59-131, 50-56-157-101). Clicking any node provides deep metrics, allocatable resources, and taint configurations. |
| Status | Node health condition badge: Ready, NotReady, SchedulingDisabled, or MemoryPressure. |
| Roles | Architectural placement designation (control-plane or worker). |
| Pods | Current pod density versus maximum schedulable capacity (e.g., 110/110). |
| Memory | Active RAM utilization vs total allocatable physical memory (e.g., 7.40 GB / 7.74 GB). |
| CPU | Active vCPU millicores consumed vs physical host cores (e.g., 3900m / 4). |
| Filesystem | Local root disk storage capacity (e.g., 69.61 GB). |
| Created | Cluster join timestamp. |
Node Deep-Dive & Hardware Telemetry
PixelView provides low-level hardware observability, kernel information, network addressing, and taint administration for every physical or virtual node in the cluster.
Selecting a Node from the Inventory
Clicking any node row in the Nodes inventory table (e.g., 174-143-59-131):
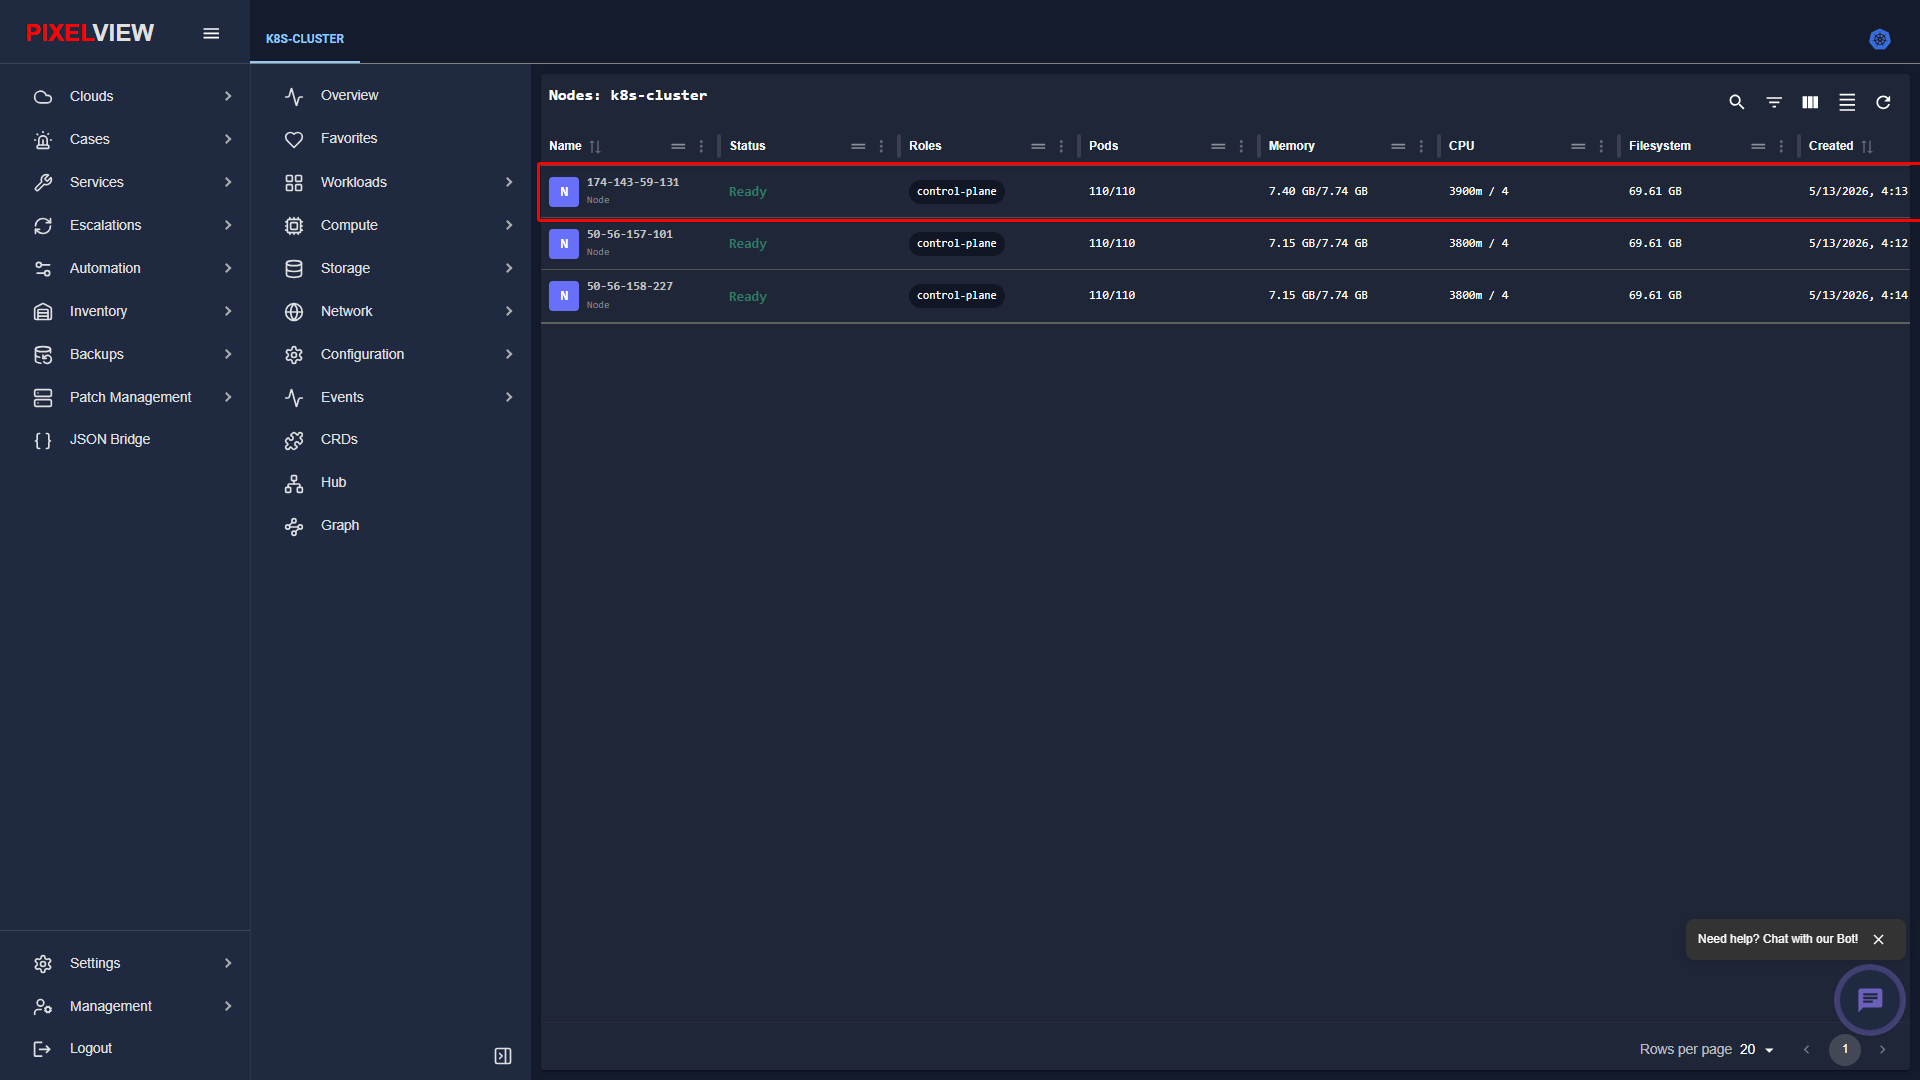
Node Details View
Upon selecting a node, PixelView opens the dedicated Node Details page (/kubernetes/:clusterName/nodes/:nodeName/details), presenting hardware specifications and five operational navigation tabs:
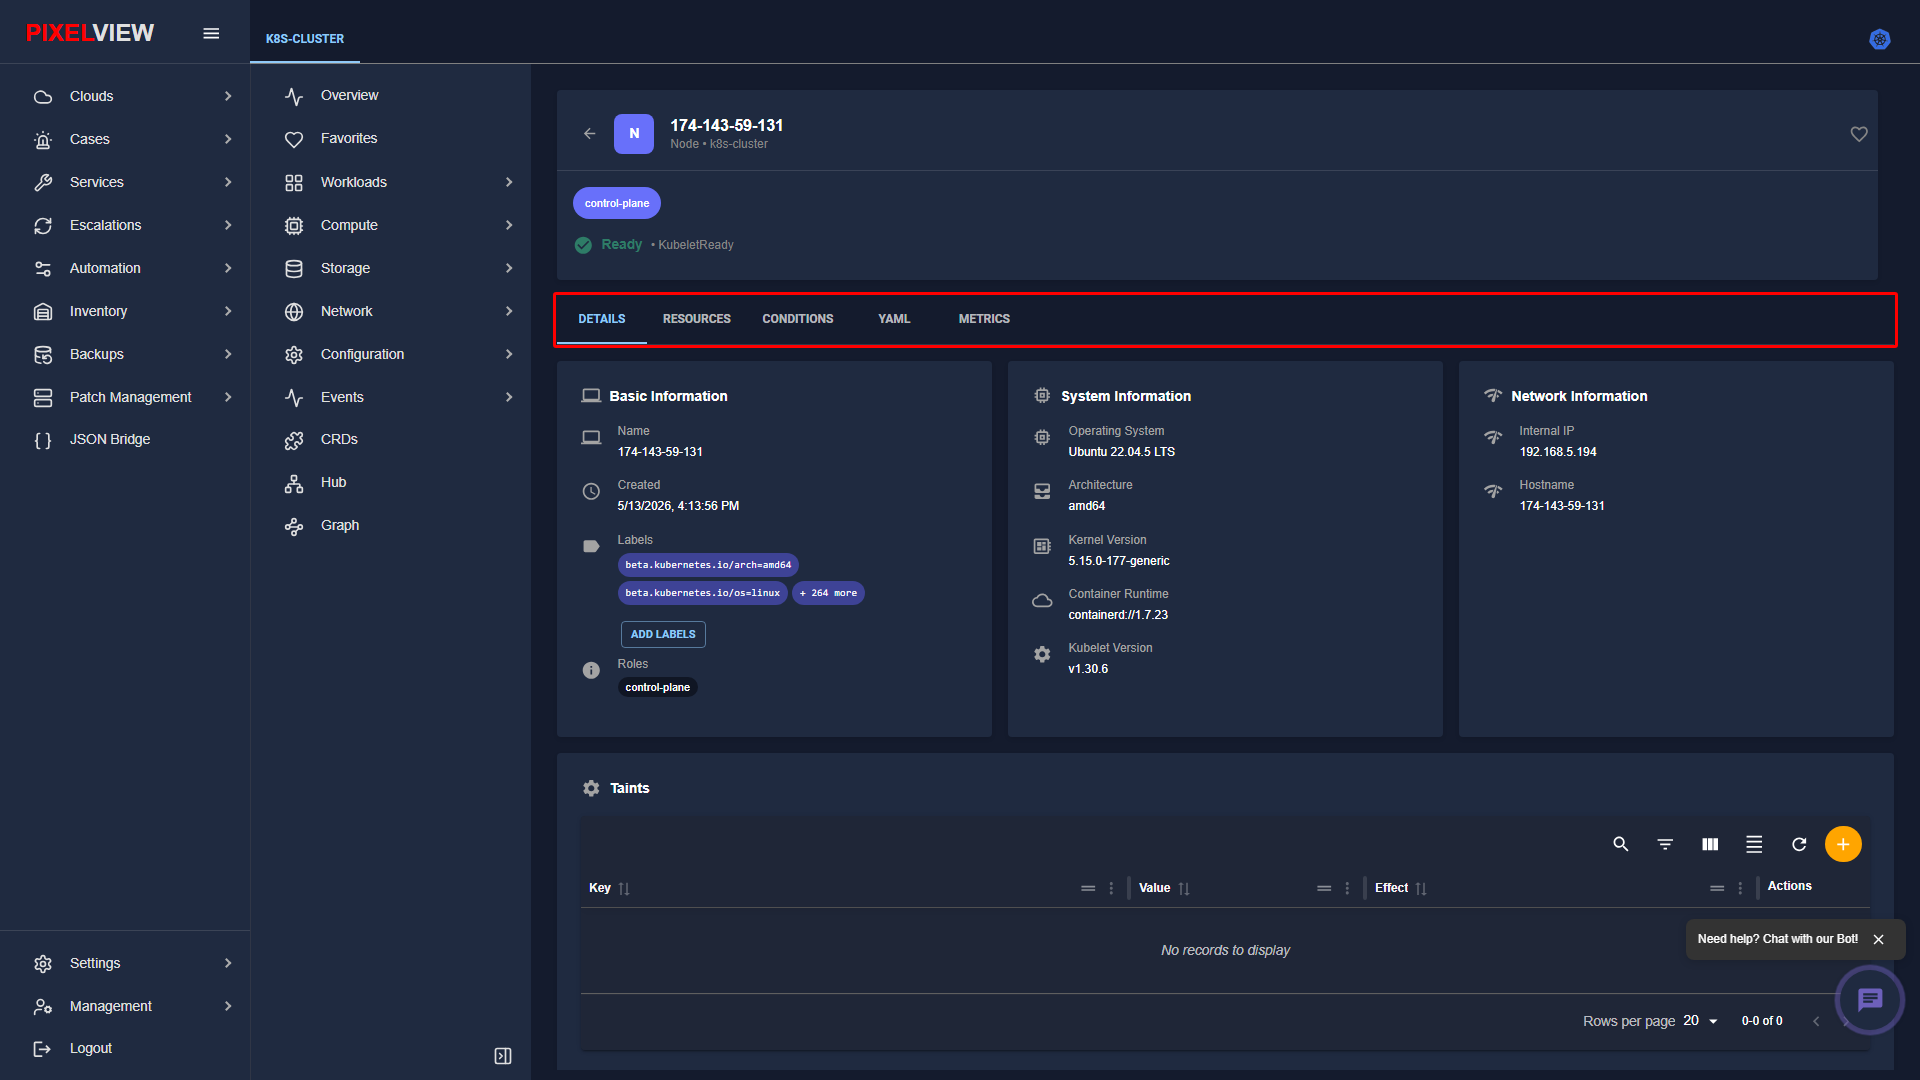
| Tab | Purpose & Operational Function |
|---|---|
DETAILS |
Primary node dashboard containing hardware inventory cards, Linux kernel specs, network addressing, and the active Taints table. |
RESOURCES |
Allocatable vs Capacity breakdown for CPU millicores, physical memory, ephemeral storage, and total schedulable pod slots. |
CONDITIONS |
Node health indicators tracking Kubelet status conditions (Ready, MemoryPressure, DiskPressure, PIDPressure, and NetworkUnavailable). |
YAML |
Live declarative Kubernetes Node object manifest with copy, export, and inline editor support. |
METRICS |
Real-time telemetry monitoring node compute footprint over time (CPU utilization curves, memory commit footprint, disk I/O throughput, and network interface traffic). |
Node Details Information Cards
- Basic Information:
- Name: Unique node hostname (
174-143-59-131). - Created: Node cluster registration timestamp (
5/13/2026, 4:13:56 PM). - Labels: Searchable key-value metadata tags (
beta.kubernetes.io/arch=amd64,beta.kubernetes.io/os=linux, etc.) with an ADD LABELS action button. - Roles: Architectural cluster roles (
control-planeorworker). - System Information:
- Operating System: Underlying Linux distribution (
Ubuntu 22.04.5 LTS). - Architecture: Hardware processor architecture (
amd64). - Kernel Version: Running Linux kernel build (
5.15.0-177-generic). - Container Runtime: Container execution engine and version (
containerd://1.7.23). - Kubelet Version: Installed Kubernetes node agent daemon version (
v1.30.6). - Network Information:
- Internal IP: Primary node private IP address (
192.168.5.194). - Hostname: System hostname used for internal cluster networking (
174-143-59-131). - Taints Management Table:
- Displays all active node taints that repel unscheduled pods unless tolerations are configured.
- Columns: Key, Value, and Effect (
NoSchedule,PreferNoSchedule, orNoExecute). - Toolbar controls: Search, Column selector, Filter, Refresh, and the bright orange circular
+(Add Taint) action button.
Node Configuration Action Triggers
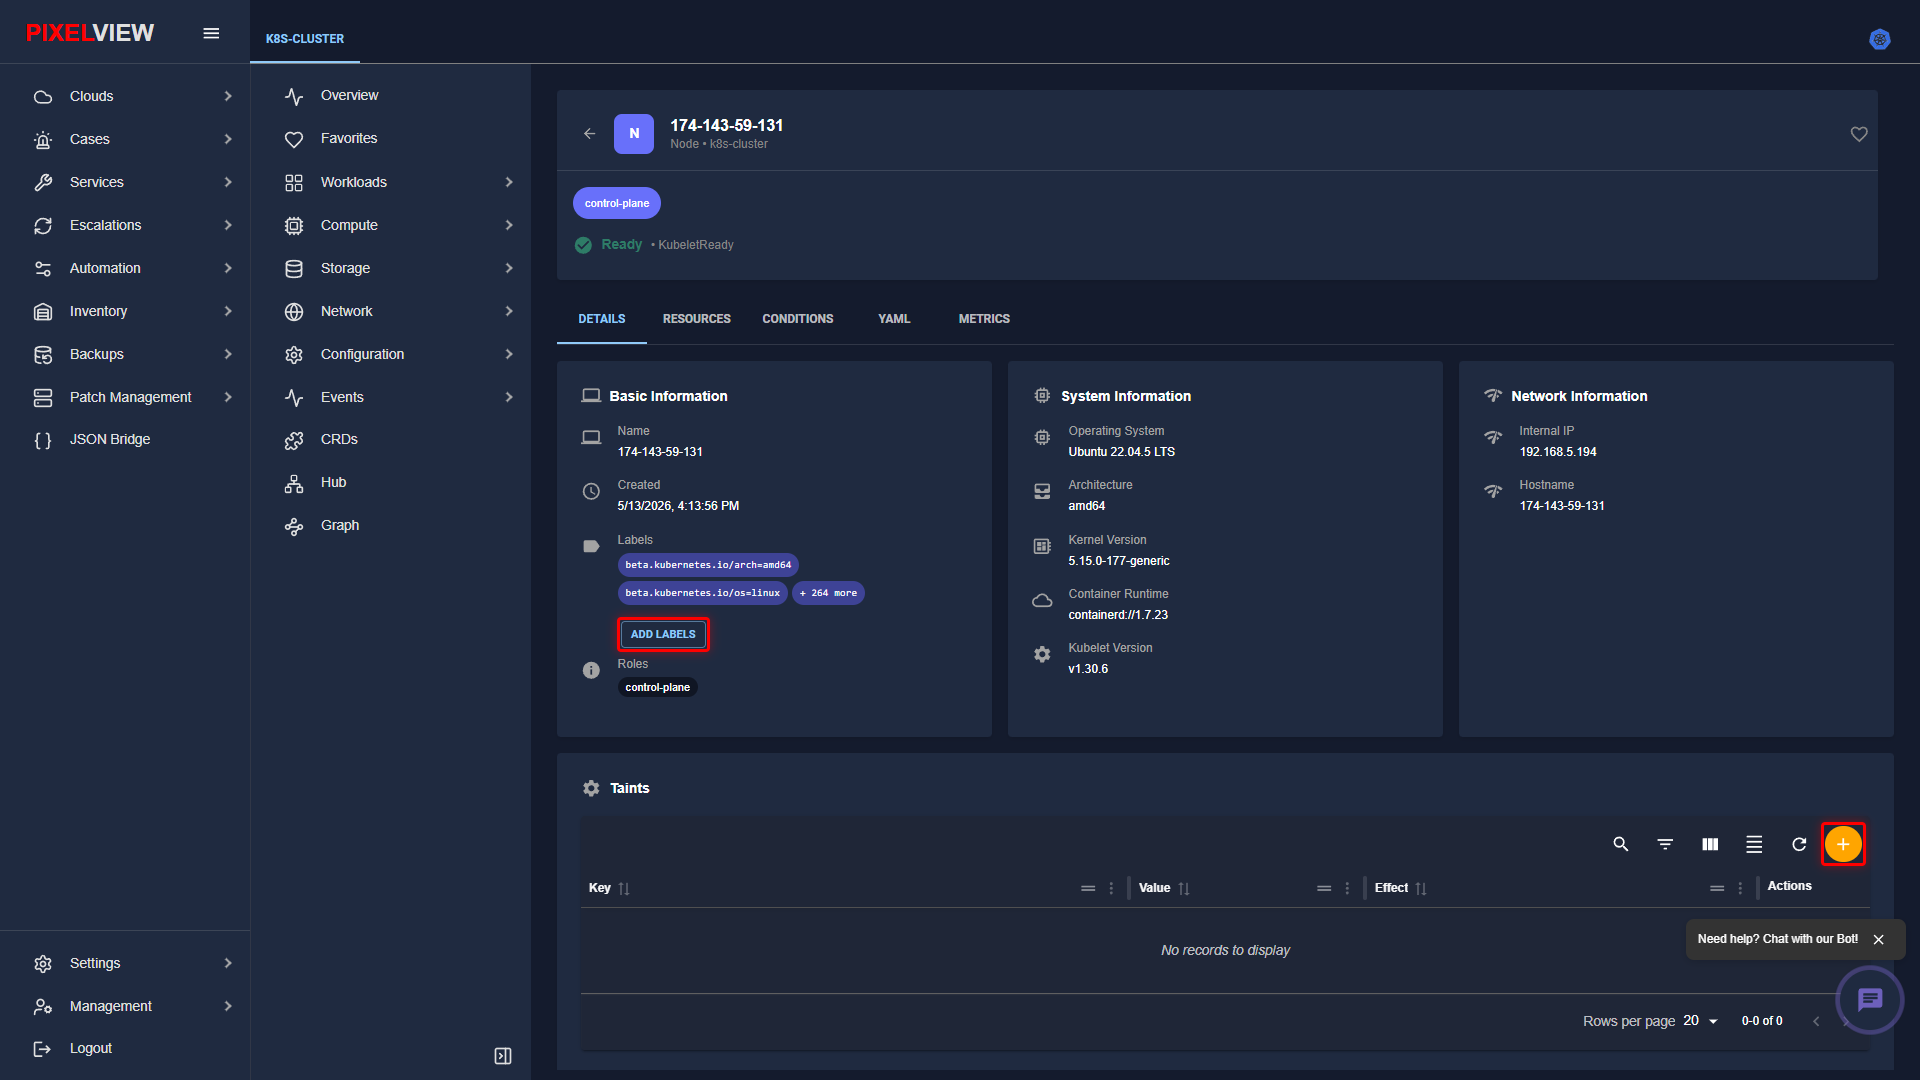
Operators can attach metadata labels to worker nodes or configure scheduling taints directly from the Node Details page using the action buttons marked below:
Adding Node Taints (Inline Form Card)
Node taints prevent pods from being scheduled onto inappropriate nodes unless those pods possess matching tolerations. To configure a new taint on a node:
* On the Node Details page, locate the Taints card.
* Click the orange circular + (Add Taint) button on the Taints table toolbar.
* PixelView immediately expands the inline Add Taint configuration card:
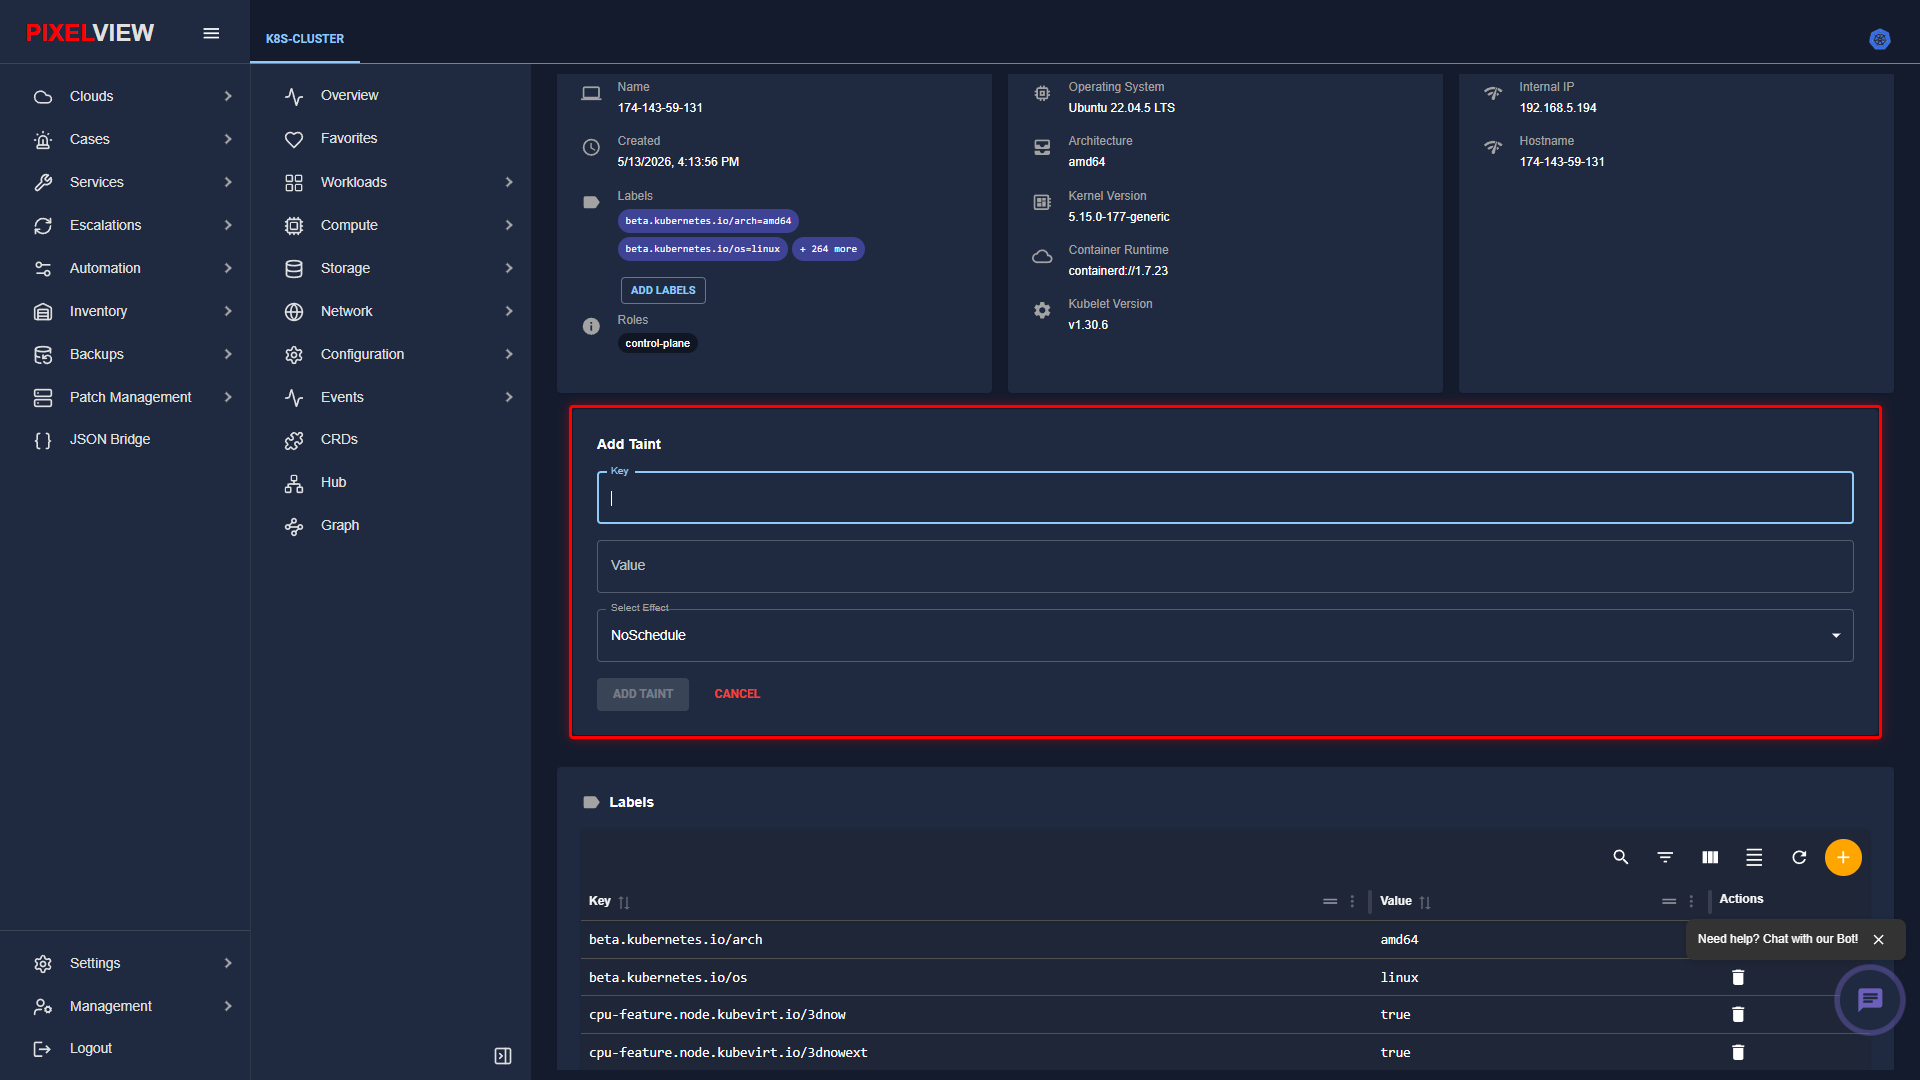
| Field | Type | Description |
|---|---|---|
| Key | Text Input (Required) | Alphanumeric identifier defining the taint condition (e.g., dedicated, maintenance, gpu-workload). |
| Value | Text Input (Optional) | Key qualifier string (e.g., true, backend, scheduled). |
| Select Effect | Dropdown Selector (Required) | Taint scheduling enforcement policy: |
NoSchedule |
Pods that do not tolerate this taint cannot be scheduled onto the node. Existing running pods are not affected. | |
PreferNoSchedule |
The Kubernetes scheduler attempts to avoid placing non-tolerating pods on this node, but may schedule them if no other nodes are available. | |
NoExecute |
Non-tolerating pods will not be scheduled on the node, and any currently running pods without a matching toleration are immediately evicted. |
- Click ADD TAINT to apply the taint directly to the node's live API specification, or click CANCEL to dismiss the form.
Adding Node Labels (Modal Dialog)
Node labels enable node affinity, tolerations, and pod topology spread constraints. To attach new labels to a node:
* In the Basic Information card, click the ADD LABELS button (or click the orange circular + button on the Labels table toolbar).
* The Add Label dialog opens:
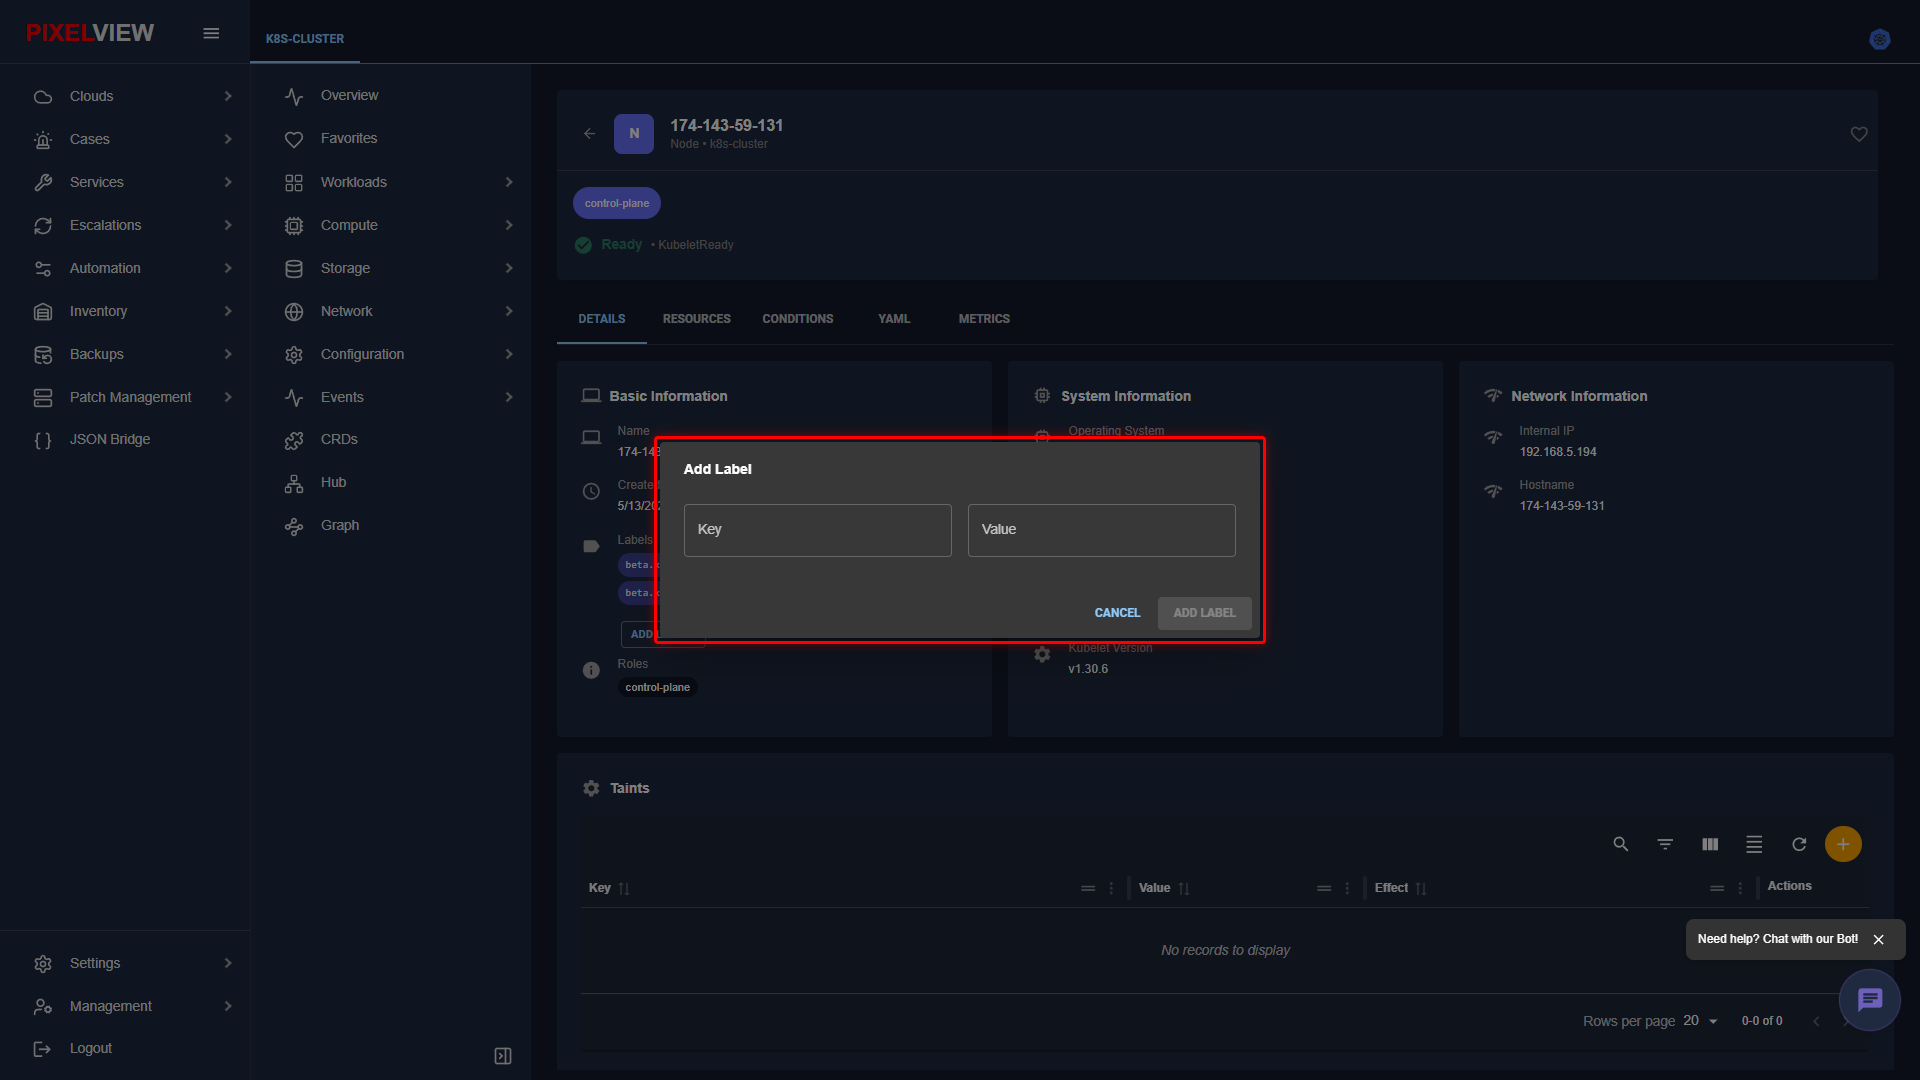
| Field | Type | Description |
|---|---|---|
| Key | Text Input (Required) | Label key adhering to Kubernetes naming rules (e.g., topology.kubernetes.io/zone, environment, node-role.kubernetes.io/worker). |
| Value | Text Input (Required) | Corresponding label value (e.g., us-east-1a, production, worker). |
- Click ADD LABEL to persist the key-value pair to the node, or CANCEL to exit.
Controllers
Controllers monitor the health of internal control-plane manager components and reconciliation loops.
Controllers Table Overview
Navigate to Compute → Controllers in the secondary sidebar:
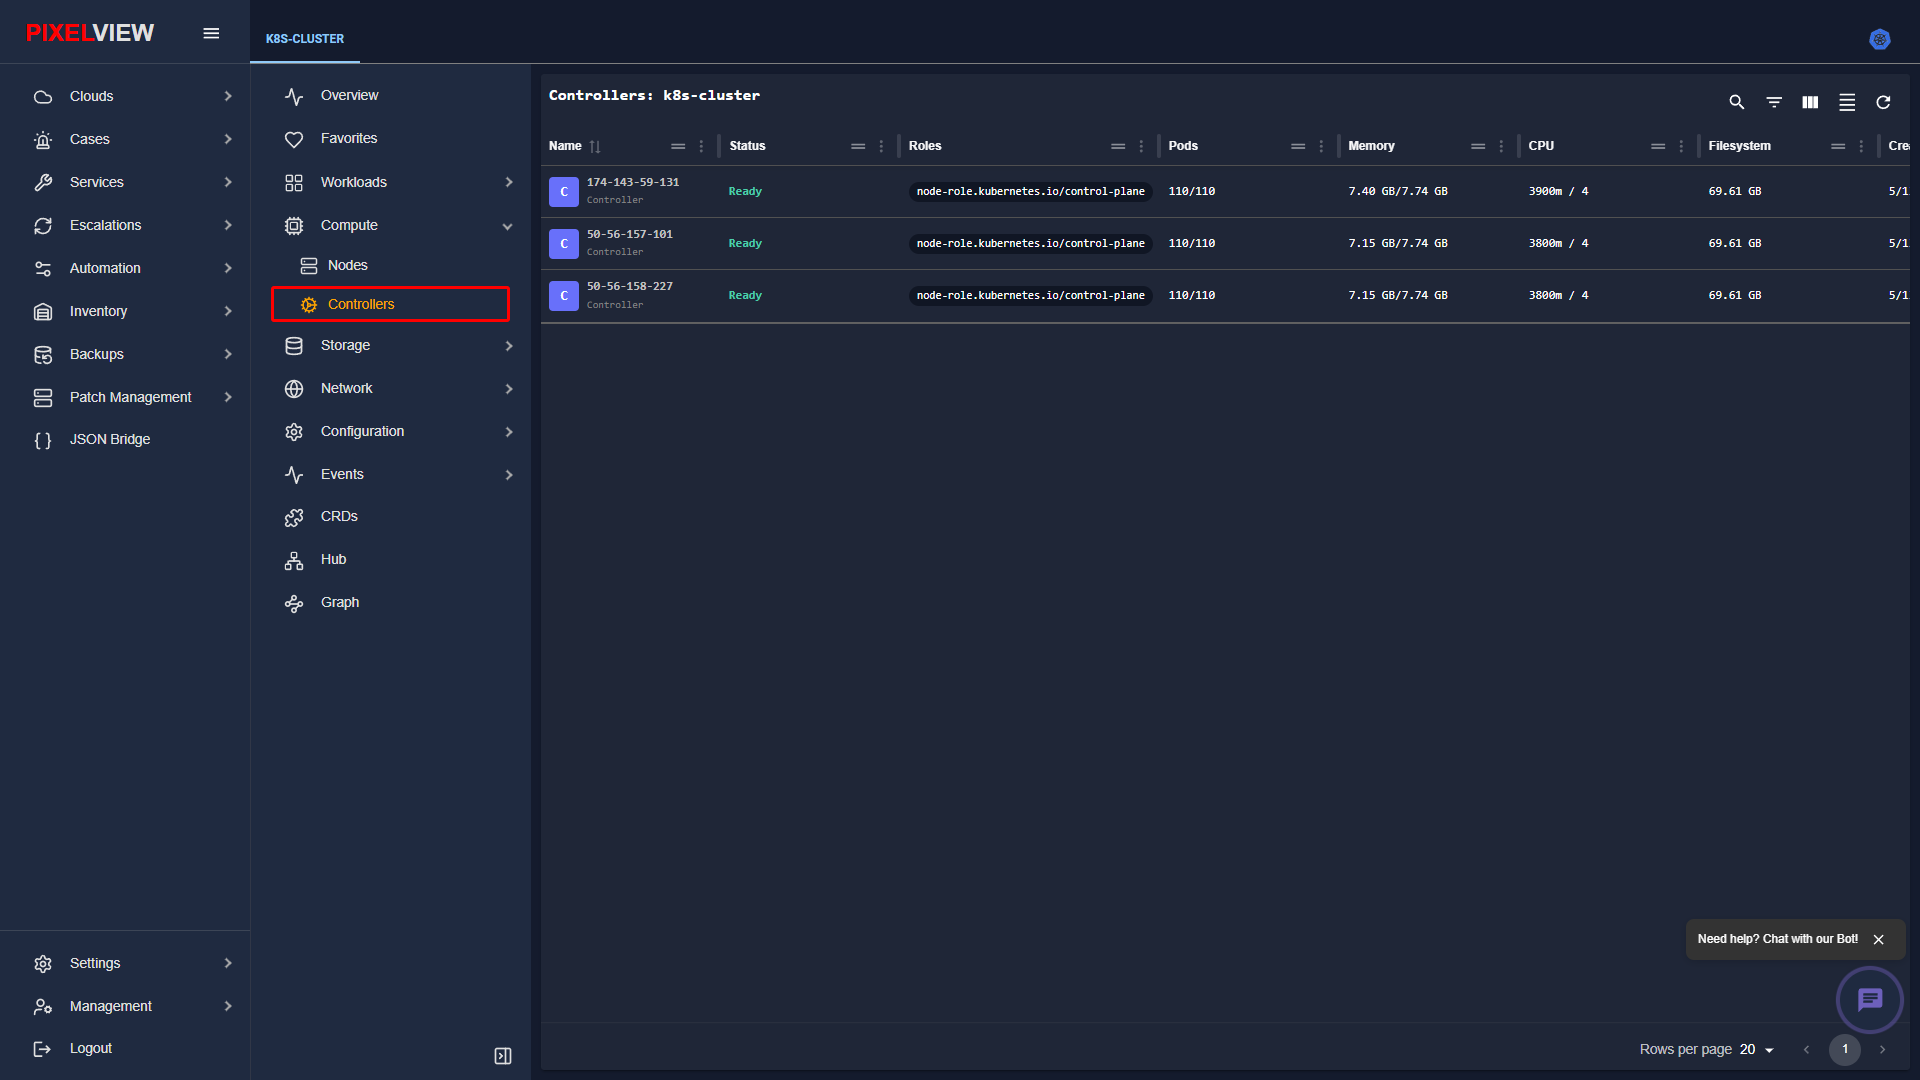
| Column | Description |
|---|---|
| Name | Internal controller identifier (e.g., node-controller, endpoint-controller). |
| Status | Operational synchronization state. |
| Replicas | Active manager replica redundancy. |
| Node Placement | Target control-plane node hosting the controller instance. |
Storage Subsystem
The Storage submenu provides complete management over durable volumes, dynamic provisioning classes, and persistent storage bindings.
Persistent Volume Claims (PVCs)
Persistent Volume Claims represent user storage requests, specifying capacity, access modes, and storage tiers that are dynamically bound to Persistent Volumes.
PVCs Table Overview
Navigate to Storage → Persistent Volume Claims in the secondary sidebar:
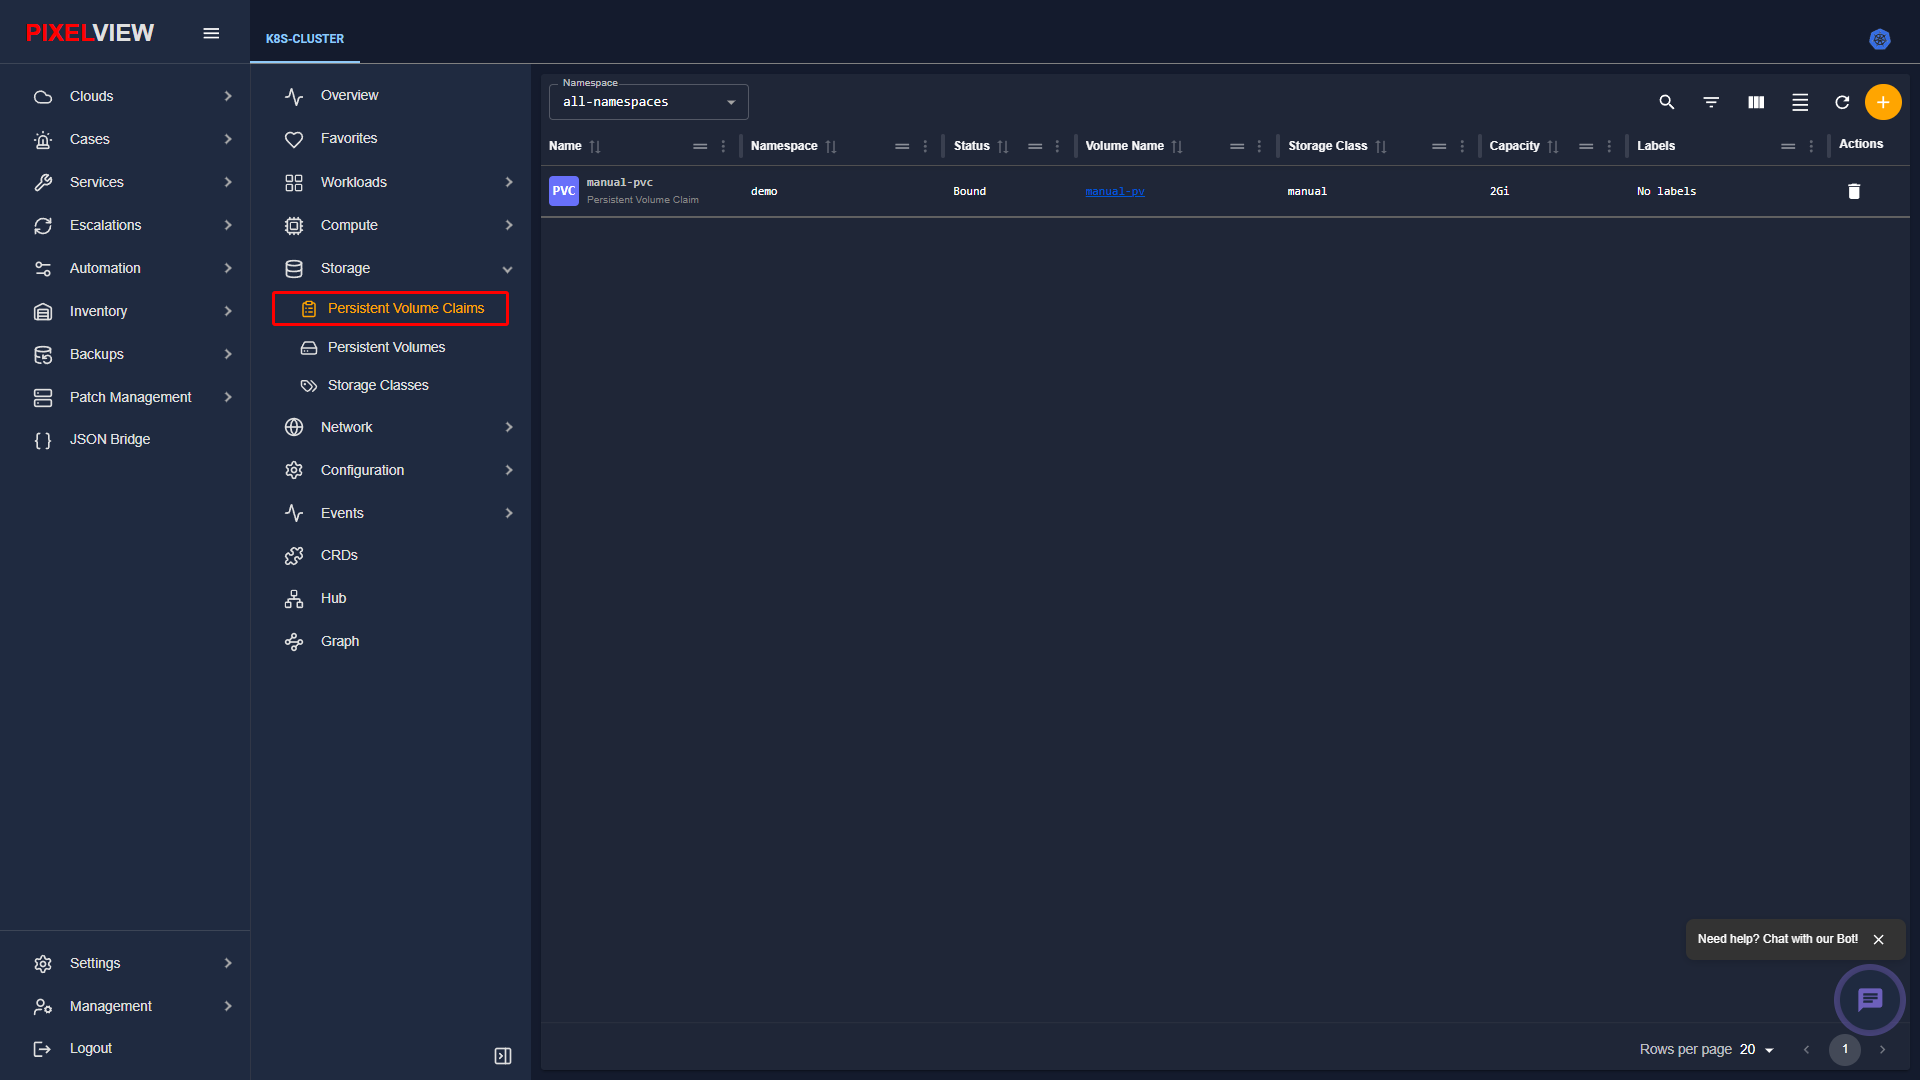
| Column | Description |
|---|---|
| Name | PVC resource label and UUID. |
| Namespace | Tenant namespace boundary containing the claim. |
| Status | Binding lifecycle state: Bound (attached to volume), Pending, or Lost. |
| Volume Name | Underlying Persistent Volume (PV) UUID satisfying the claim. |
| Storage Class | Provisioner profile defining backing storage SLA (e.g., standard, fast-ssd). |
| Capacity | Storage quota reserved for the claim (e.g., 10Gi, 100Gi). |
Persistent Volumes (PVs)
Persistent Volumes are cluster-scoped storage assets provisioned by administrators or dynamically created by storage classes, persisting independently from individual pod lifecycles.
PVs Table Overview
Navigate to Storage → Persistent Volumes in the secondary sidebar:
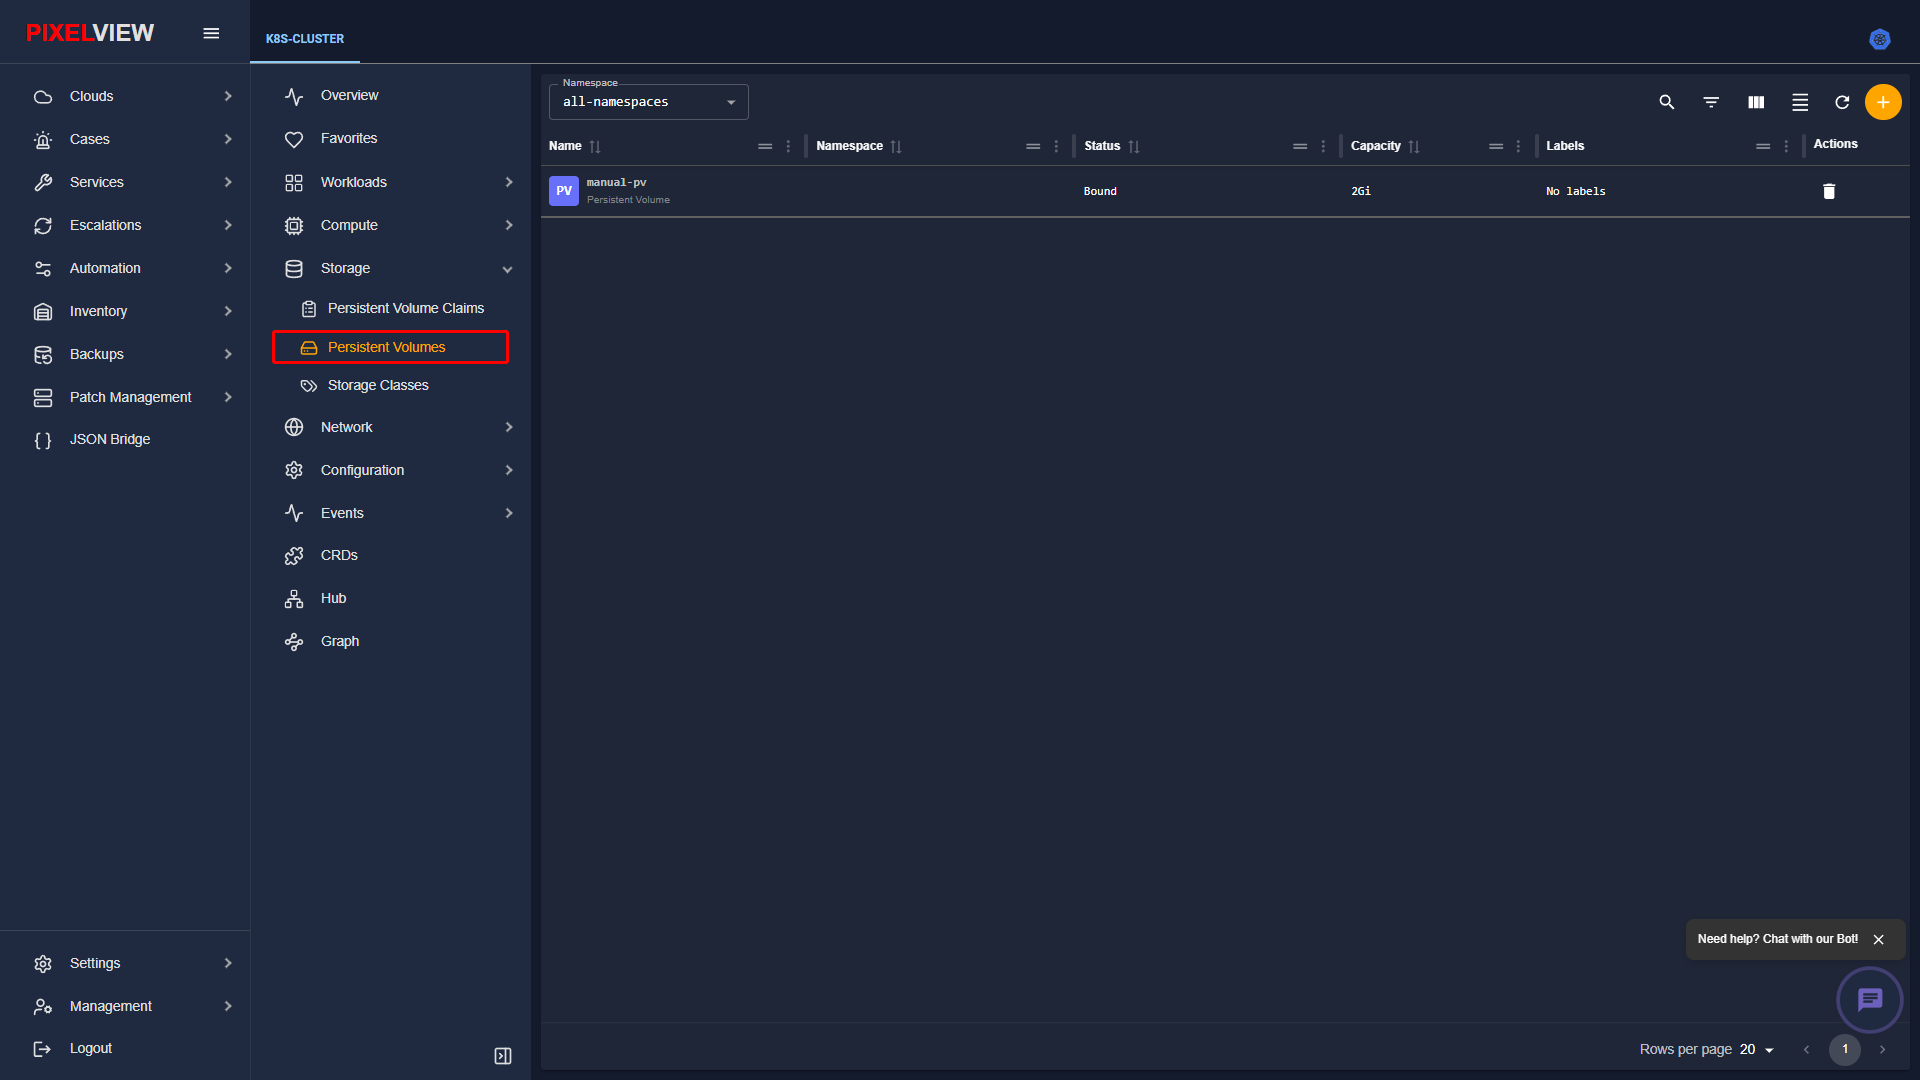
| Column | Description |
|---|---|
| Name | Persistent volume identifier. |
| Capacity | Storage capacity allocated from backend storage pools. |
| Access Modes | Storage access permissions: ReadWriteOnce (RWO), ReadOnlyMany (ROX), or ReadWriteMany (RWX). |
| Reclaim Policy | Policy applied when claim is deleted: Retain, Delete, or Recycle. |
| Status | Volume availability state: Available, Bound, or Released. |
| Claim | Scoped PVC binding reference (namespace/pvc-name). |
| Storage Class | Target storage class definition. |
Storage Classes
Storage Classes describe the "classes" of storage offered in the cluster, defining CSI driver provisioners, volume expansion capabilities, and dynamic allocation parameters.
Storage Classes Table Overview
Navigate to Storage → Storage Classes in the secondary sidebar:
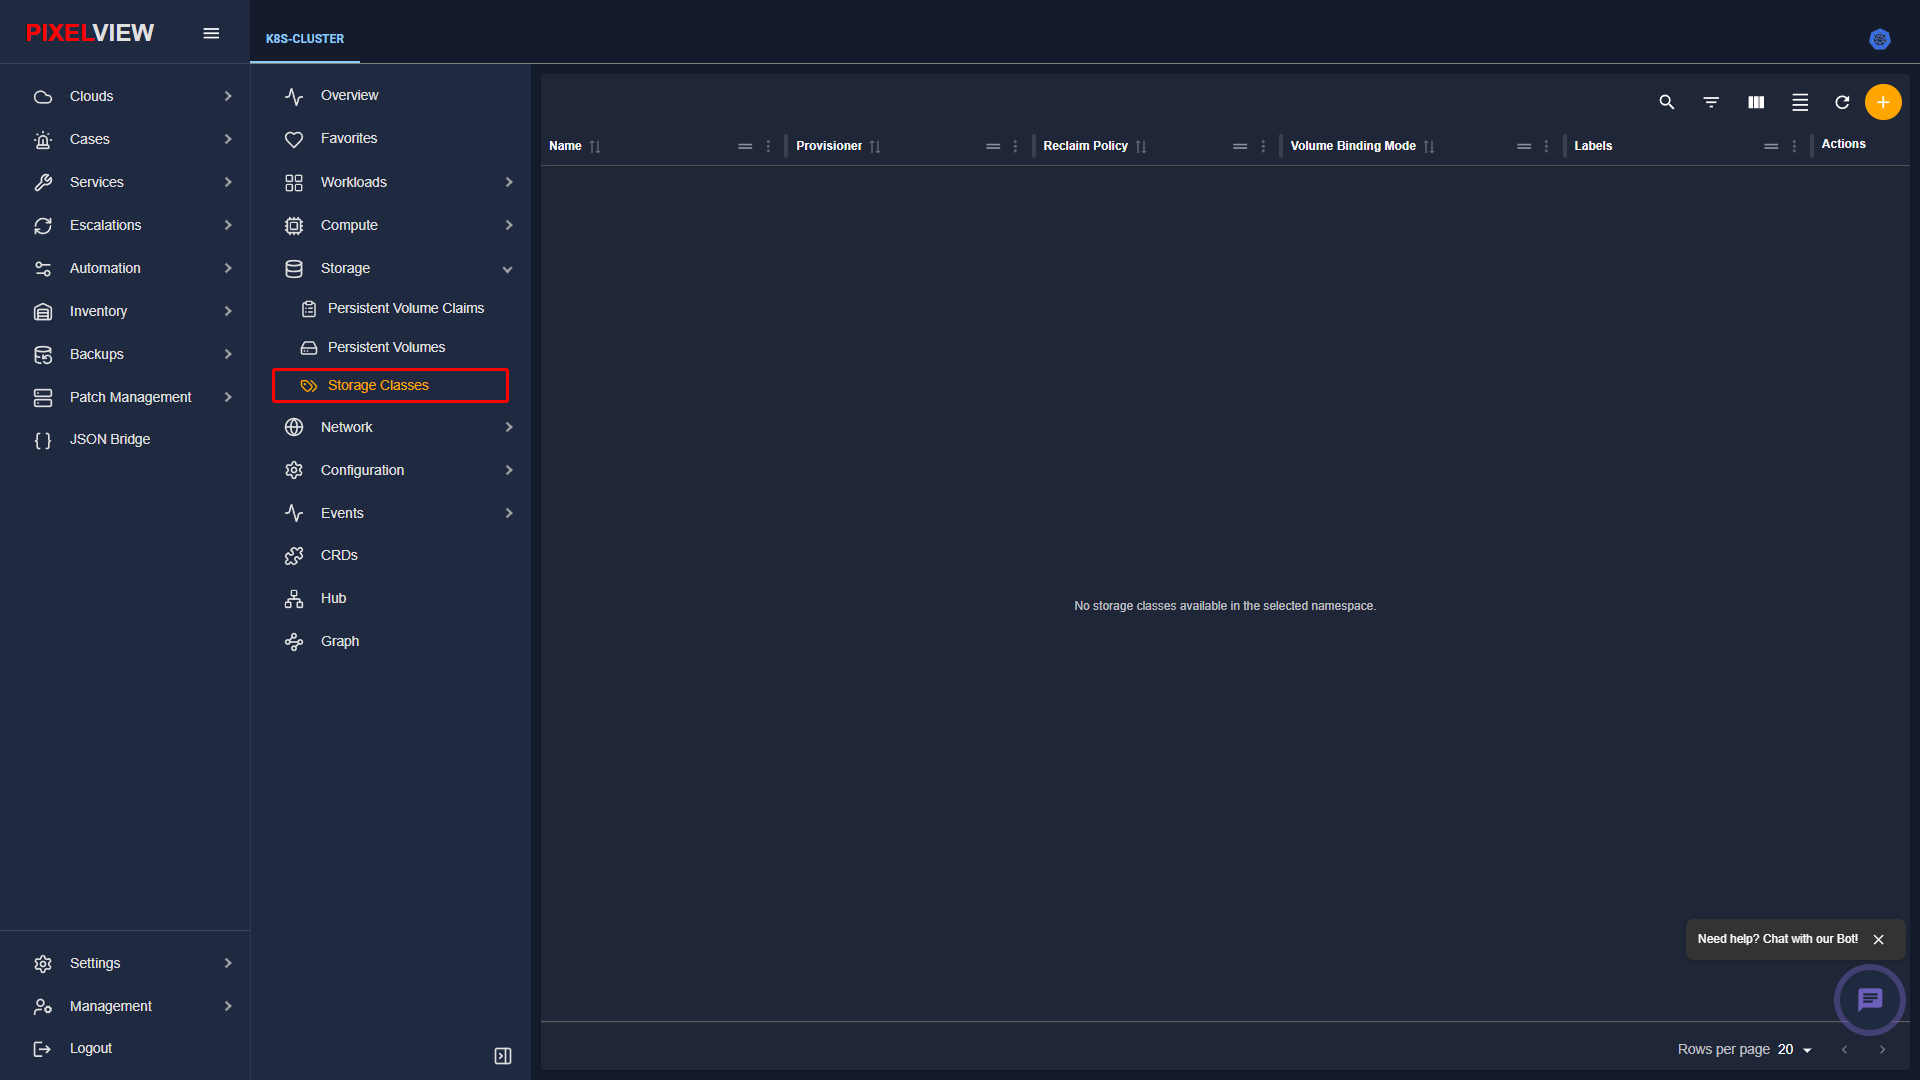
| Column | Description |
|---|---|
| Name | StorageClass name (e.g., standard, gp3, ceph-rbd). |
| Provisioner | CSI storage plugin handling dynamic creation (e.g., kubernetes.io/no-provisioner, ebs.csi.aws.com). |
| Reclaim Policy | Default lifecycle behavior for dynamically created volumes (Delete or Retain). |
| Volume Binding Mode | Immediate allocation (Immediate) or delayed until pod scheduling (WaitForFirstConsumer). |
| Allow Volume Expansion | Boolean flag indicating whether volume capacity can be extended dynamically. |
Creating a Storage Class Declaratively
To provision a dynamic storage provisioning class:
* In the secondary sidebar, navigate to Storage → Storage Classes.
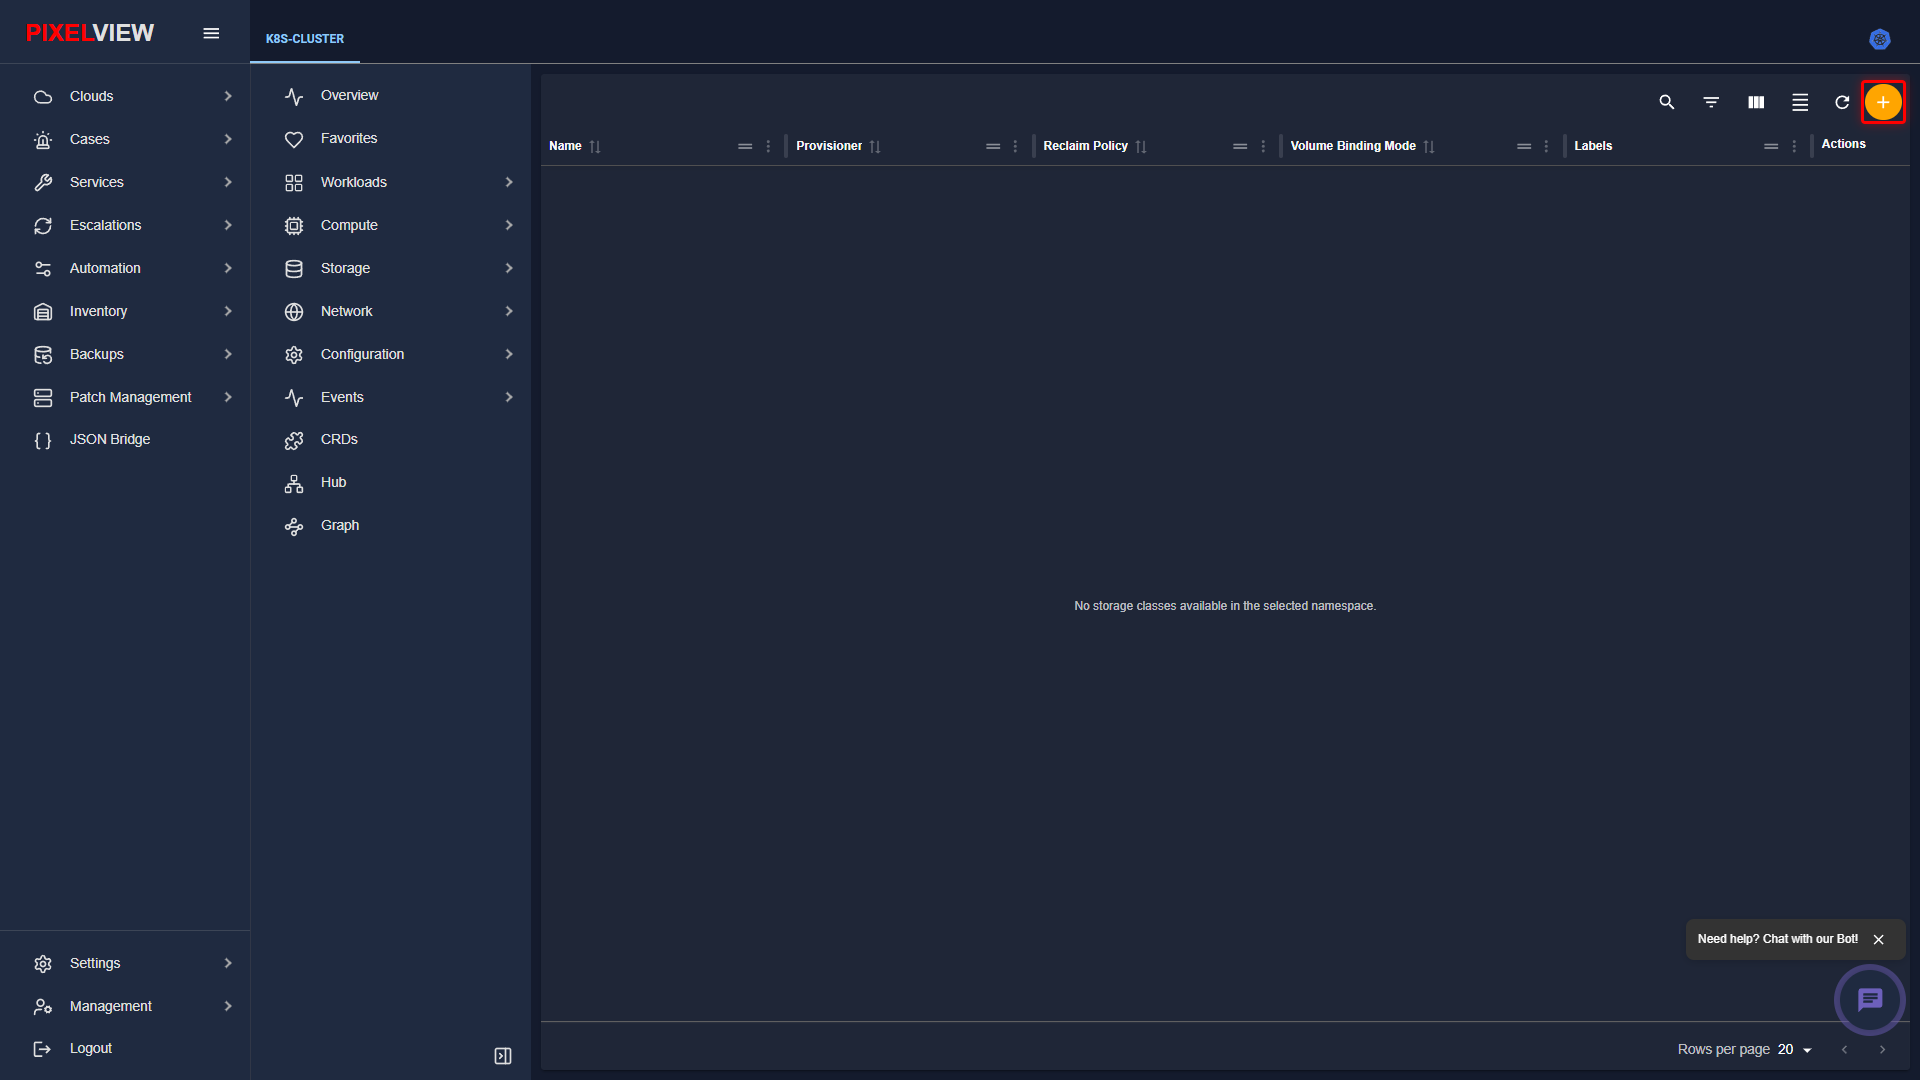
* Click the orange circular + (Create storage resource) button on the table toolbar:
- PixelView opens the Create New StorageClass Monaco editor interface:
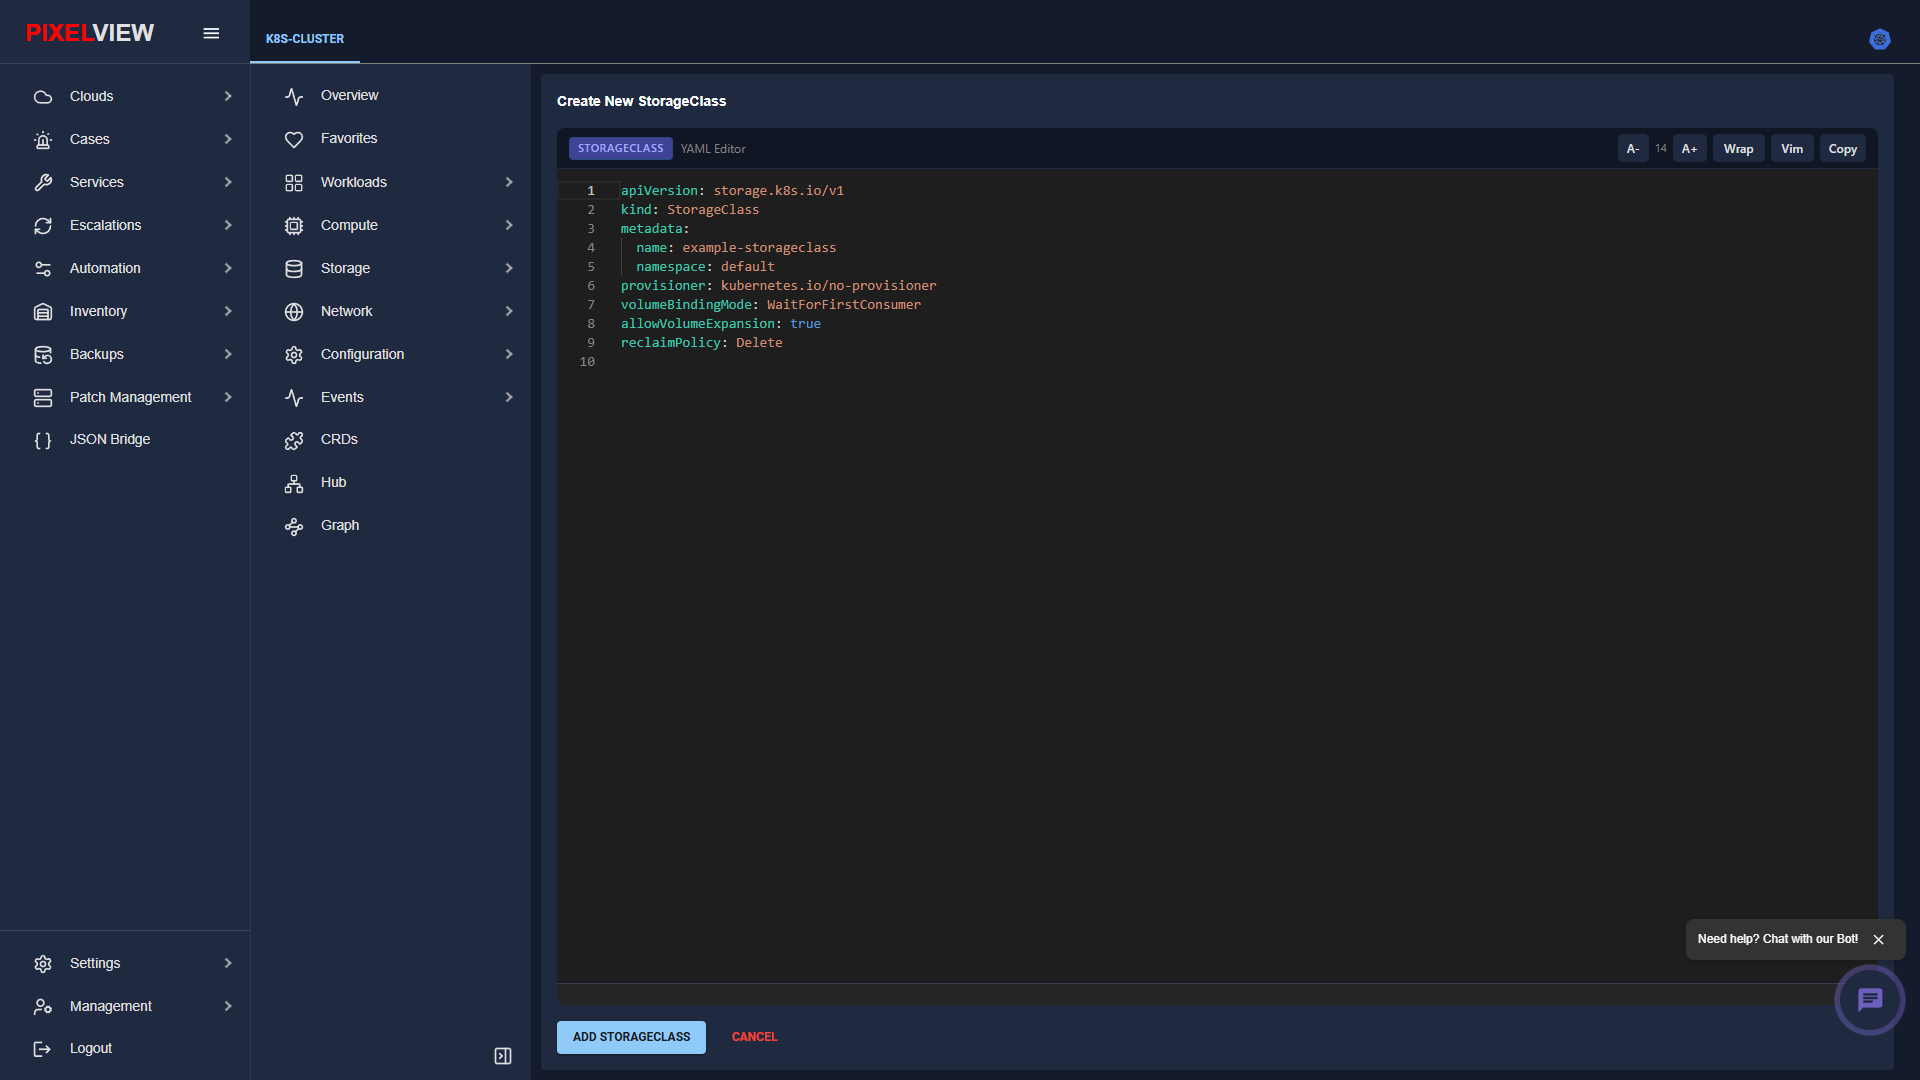
- The editor pre-populates a complete StorageClass declarative manifest:
apiVersion:storage.k8s.io/v1kind:StorageClassmetadata.name: Target storage tier name (e.g.,fast-ssd,ceph-block).provisioner: CSI driver plugin string (e.g.,kubernetes.io/no-provisioner,ebs.csi.aws.com).reclaimPolicy: Lifecycle policy (DeleteorRetain).volumeBindingMode: Provisioning timing policy (ImmediateorWaitForFirstConsumer).- Click ADD STORAGECLASS to register the storage class with the cluster.
Software-Defined Networking
The Network submenu provides comprehensive control over service endpoints, internal DNS abstractions, ingress controllers, and Gateway API resources.
Services
Services define an abstract way to expose an application running on a set of Pods as a network service with a stable IP and port.
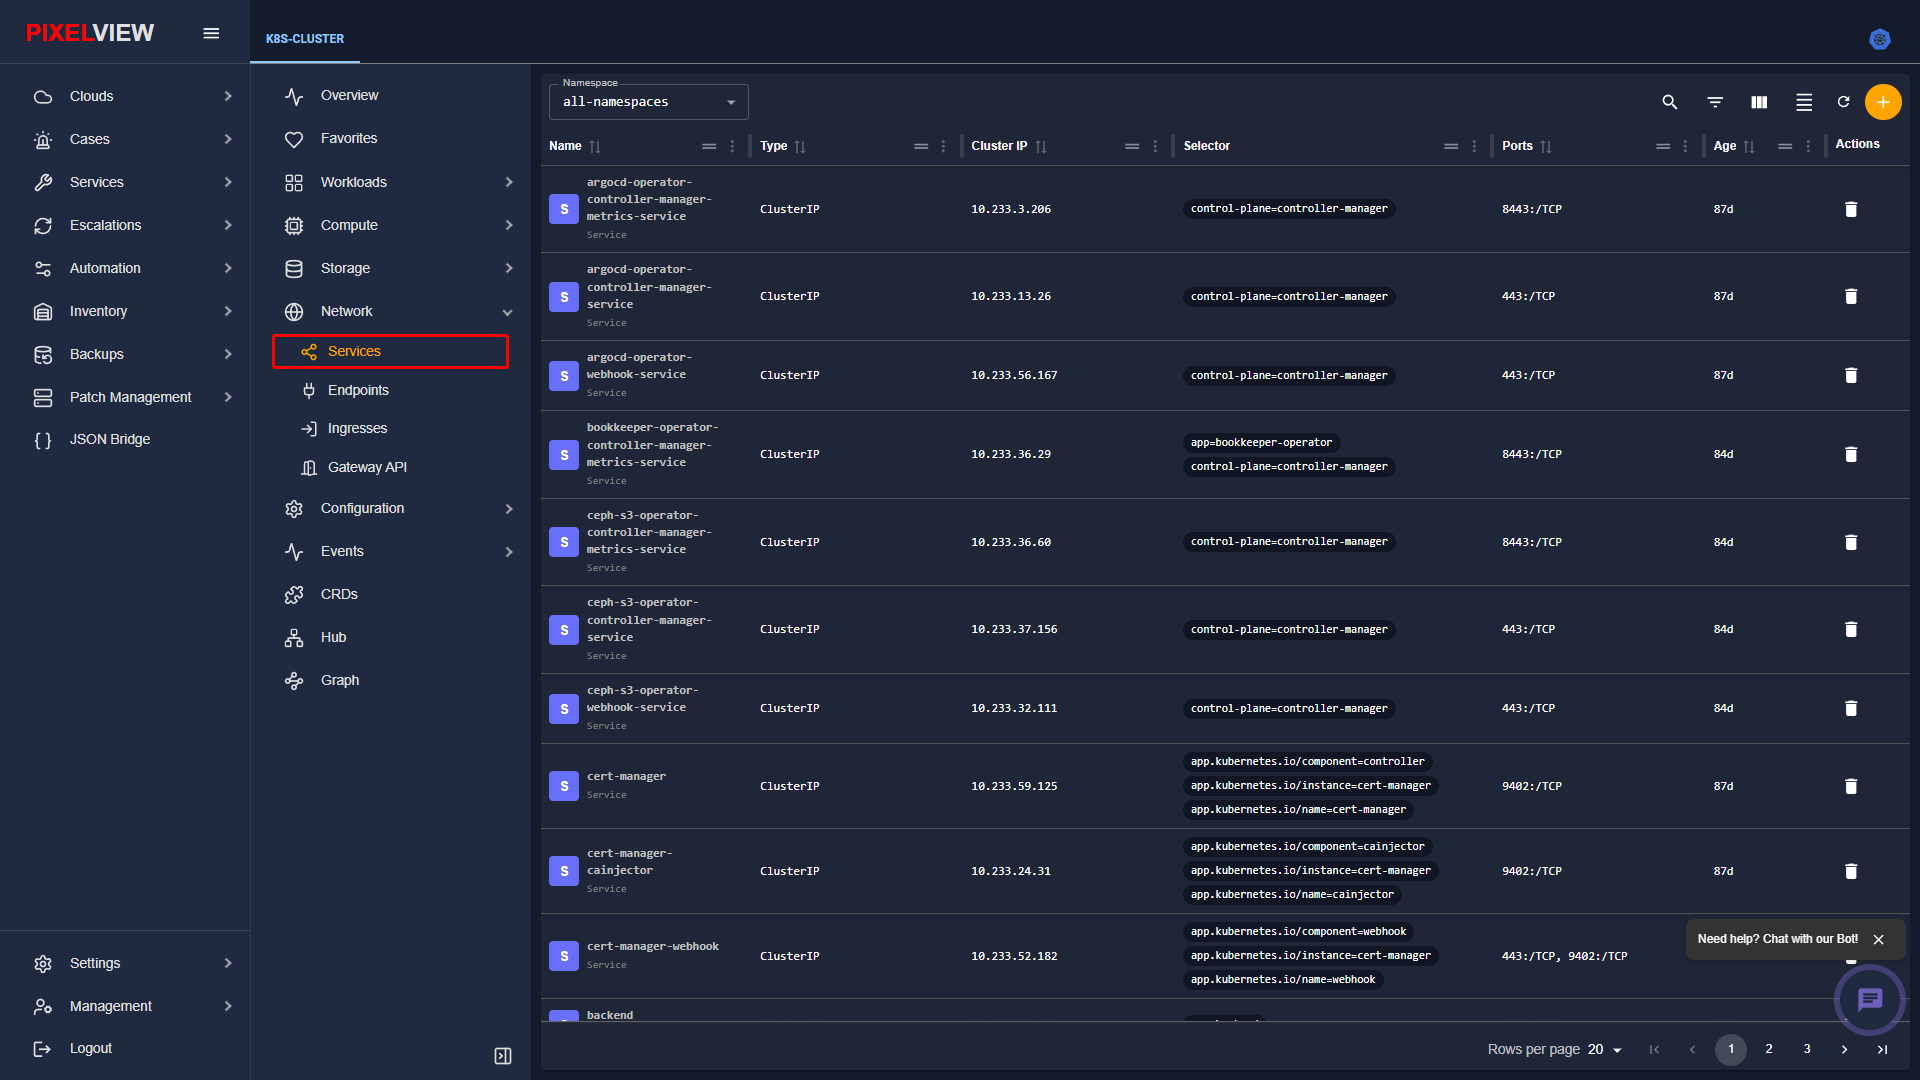
Services Table Overview
Navigate to Network → Services in the secondary sidebar:
| Column | Description |
|---|---|
| Name | Service identifier and internal DNS record hostname. |
| Type | Service routing type: ClusterIP (internal only), NodePort (node port forwarding), or LoadBalancer (public cloud VIP). |
| Cluster IP | Stable virtual IP address assigned from the service CIDR pool. |
| Selector | Label query matching backend target pods. |
| Ports | Port mapping matrix showing frontend service port to target container port (e.g., 80:8080/TCP). |
| Age | Duration elapsed since service creation. |
Service Deep-Dive & Endpoints Routing
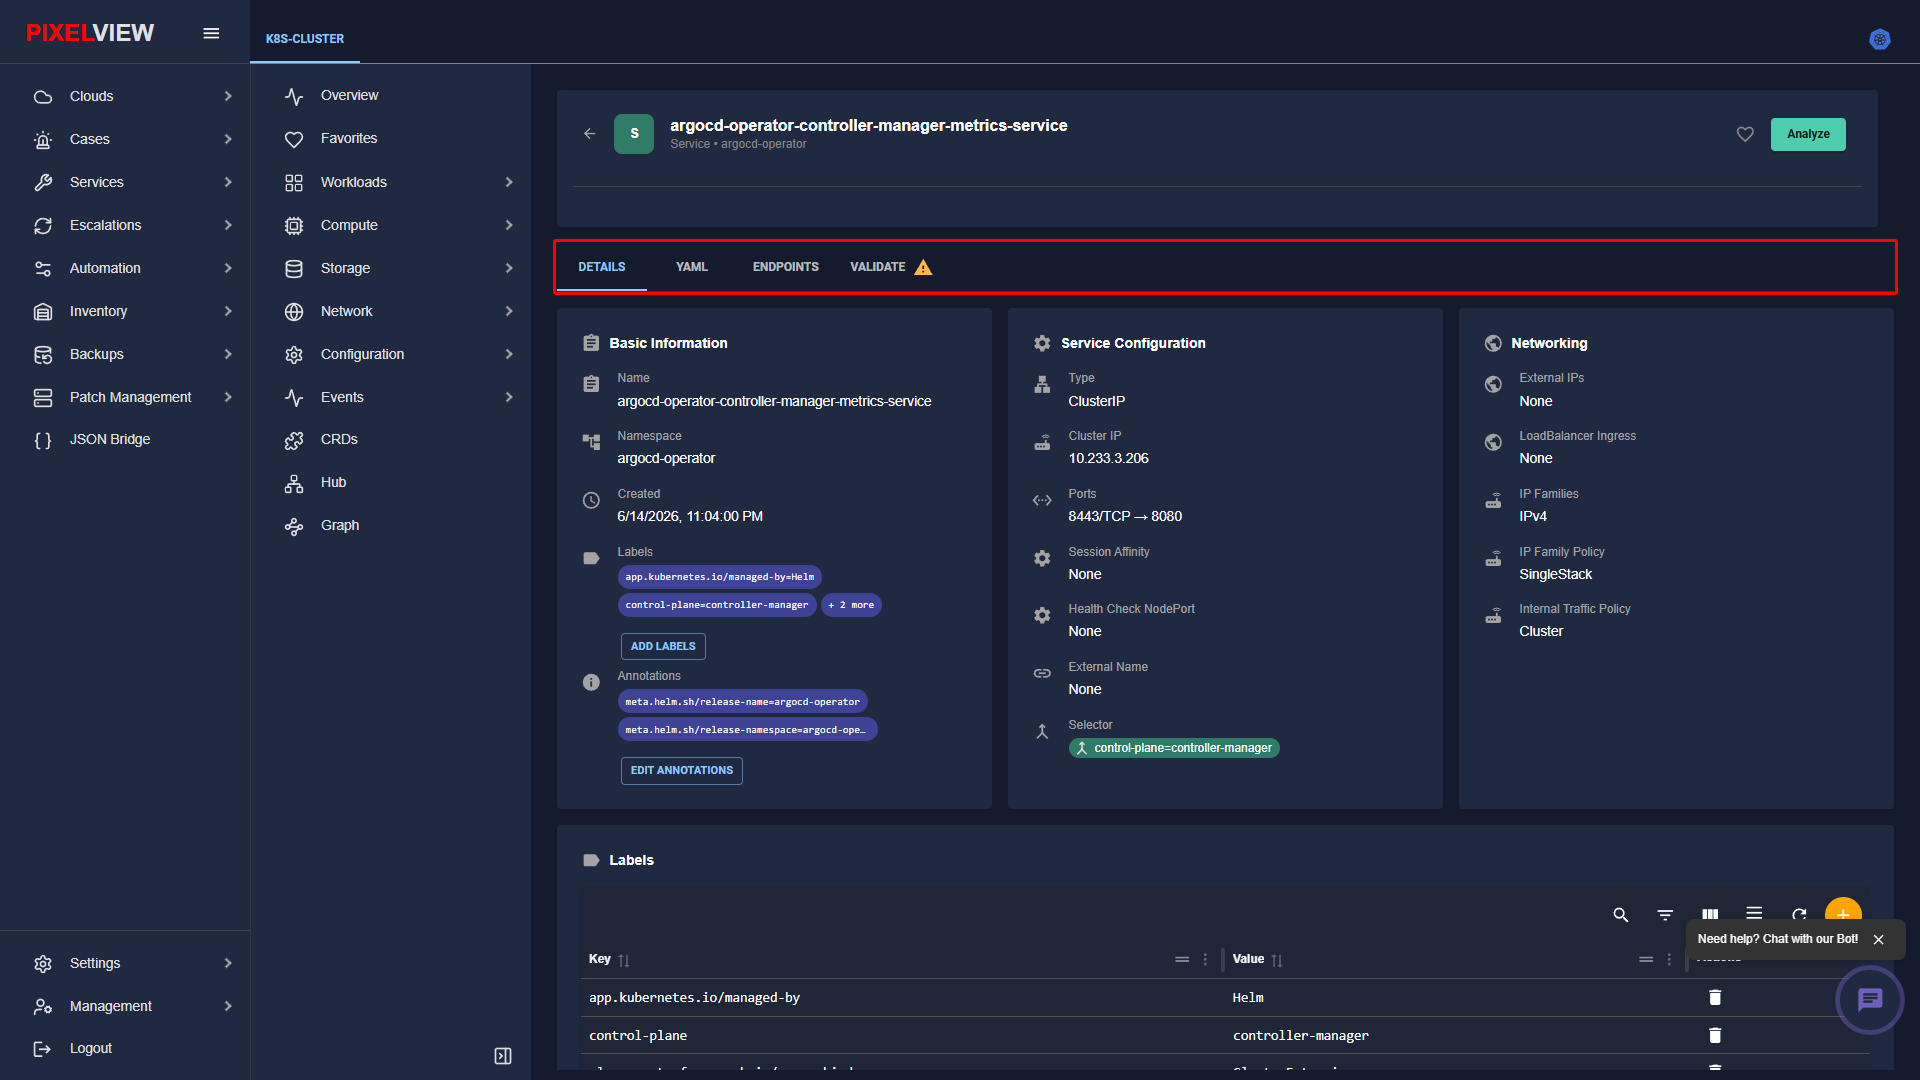
Clicking any service row in the inventory table navigates to the dedicated Service Details page (/kubernetes/:clusterName/services/:namespace/:serviceName/details):
| Tab | Purpose & Capabilities |
|---|---|
DETAILS |
Primary service overview including virtual Cluster IP, service routing type, frontend/backend port mappings, session affinity, and selector criteria. |
YAML |
Live interactive declarative Kubernetes Service manifest viewer with copy, download, and inline edit options. |
ENDPOINTS |
Live status table of backend pod IPs, ready addresses, target ports, and node placements satisfying the service selector. |
VALIDATE |
Automated networking linter checking for selector mismatches, missing endpoint targets, port conflicts, and DNS resolution readiness. |
Service Details Cards
- Basic Information: Service Name (
argocd-operator-controller-manager-metrics-service), Namespace (argocd-operator), Creation timestamp, Labels list with ADD LABELS modal, and Annotations list with EDIT ANNOTATIONS modal. - Service Configuration: Routing Type (
ClusterIP), Cluster IP (10.233.3.206), Port Mapping (8443/TCP -> 8080), Session Affinity (None), Health Check NodePort, External Name, and Pod Selector query (control-plane=controller-manager). - Networking: External IPs, LoadBalancer Ingress IPs, IP Families (
IPv4), IP Family Policy (SingleStack), and Internal Traffic Policy (Cluster). - Labels: Key-value pairs for metadata association and automated traffic routing.
Endpoints
Endpoints track the live IP addresses and ports of the pods matching a Service's selector, dynamically updating as pods scale up or fail.
Endpoints Table Overview
Navigate to Network → Endpoints in the secondary sidebar:
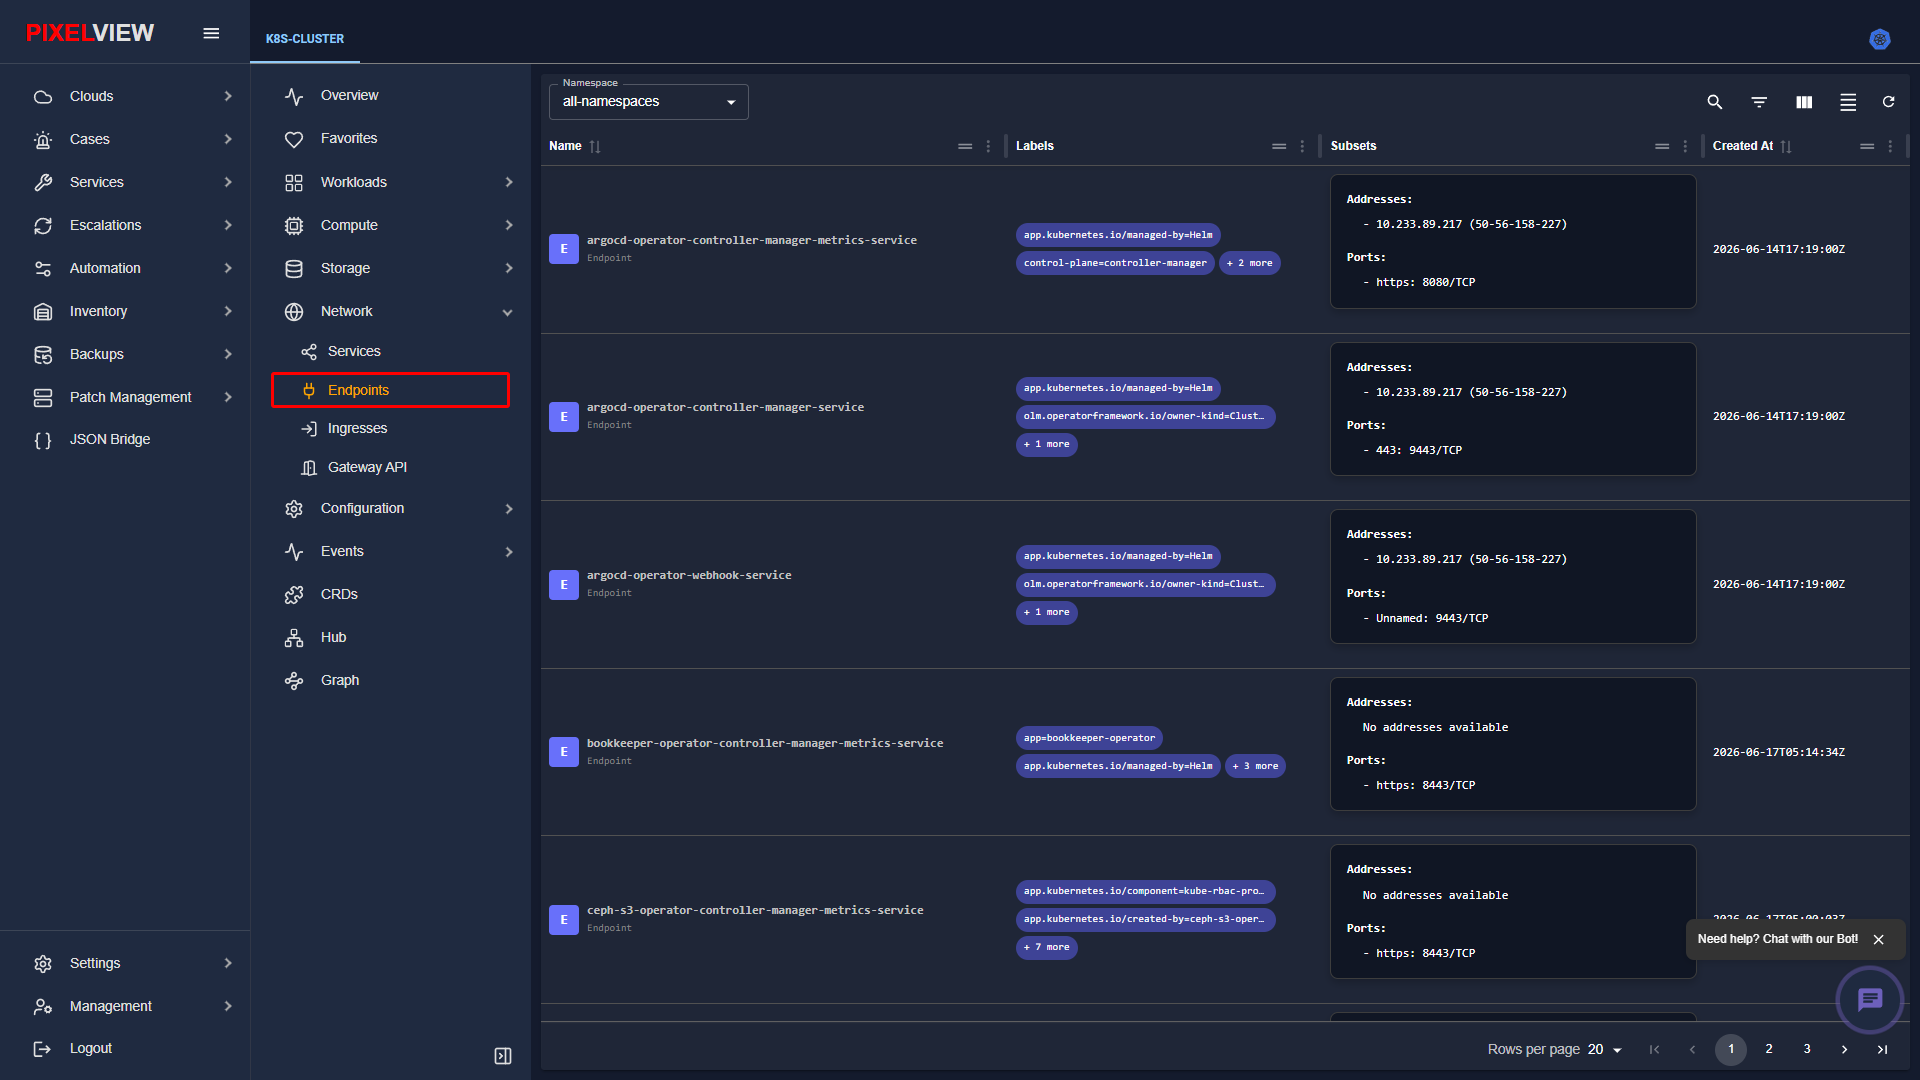
| Column | Description |
|---|---|
| Name | Target service name associated with the endpoints. |
| Namespace | Host namespace boundary. |
| Endpoints | Comma-separated list of active backend Pod IP addresses and port bindings. |
| Age | Resource age. |
Ingresses (L7 Routing)
Ingress exposes HTTP and HTTPS routes from outside the cluster to services within the cluster, handling name-based virtual hosting, SSL/TLS termination, and path-based routing.
Ingresses Table Overview
Navigate to Network → Ingresses in the secondary sidebar:
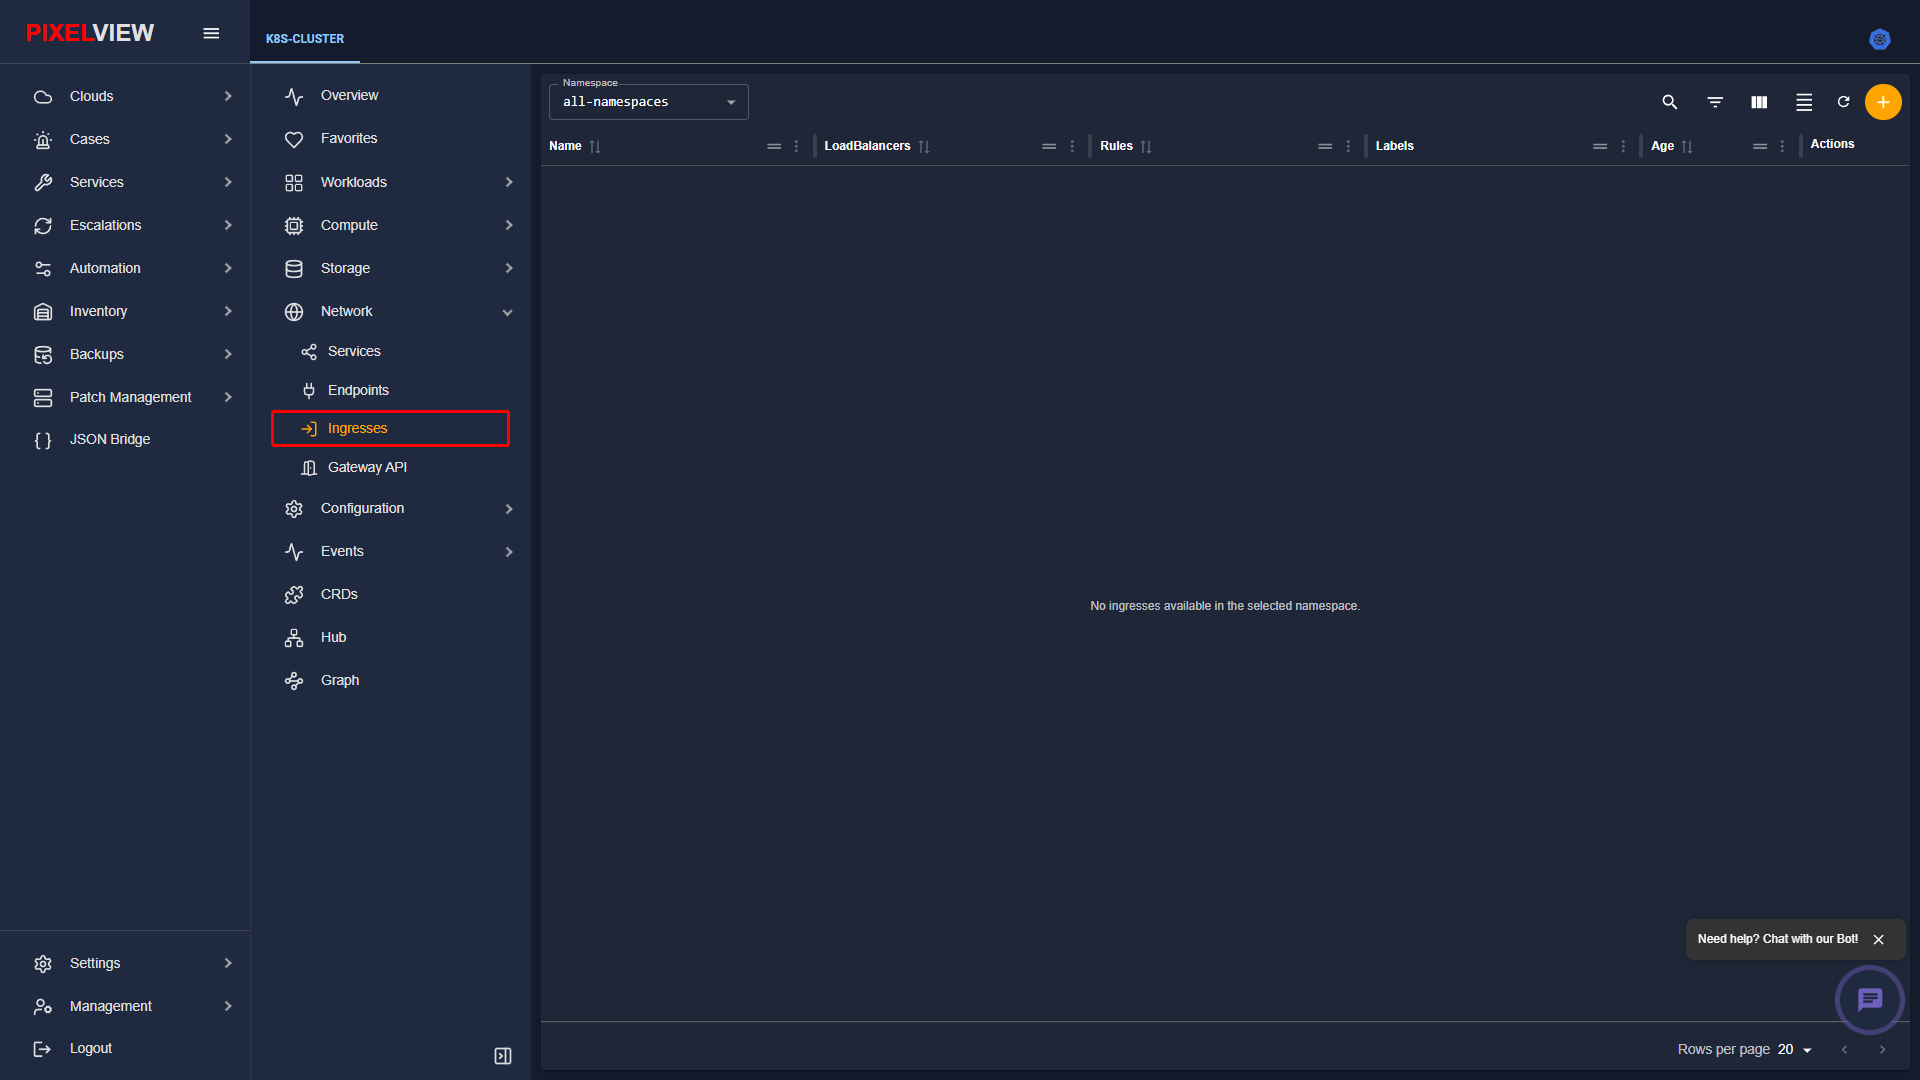
| Column | Description |
|---|---|
| Name | Ingress resource identifier. |
| Namespace | Target namespace. |
| Class | Ingress controller handling the route (e.g., nginx, traefik). |
| Hosts | Fully Qualified Domain Names (FQDNs) matched by the ingress rules (e.g., app.pixelvirt.com). |
| Address | External IP address or load balancer hostname serving incoming client traffic. |
| Ports | Exposed listening ports (80, 443). |
| Age | Resource creation age. |
Gateway API
The Kubernetes Gateway API provides role-oriented, expressive, and extensible interfaces for service networking, evolving beyond traditional Ingress.
Gateway API Table Overview
Navigate to Network → Gateway API in the secondary sidebar:
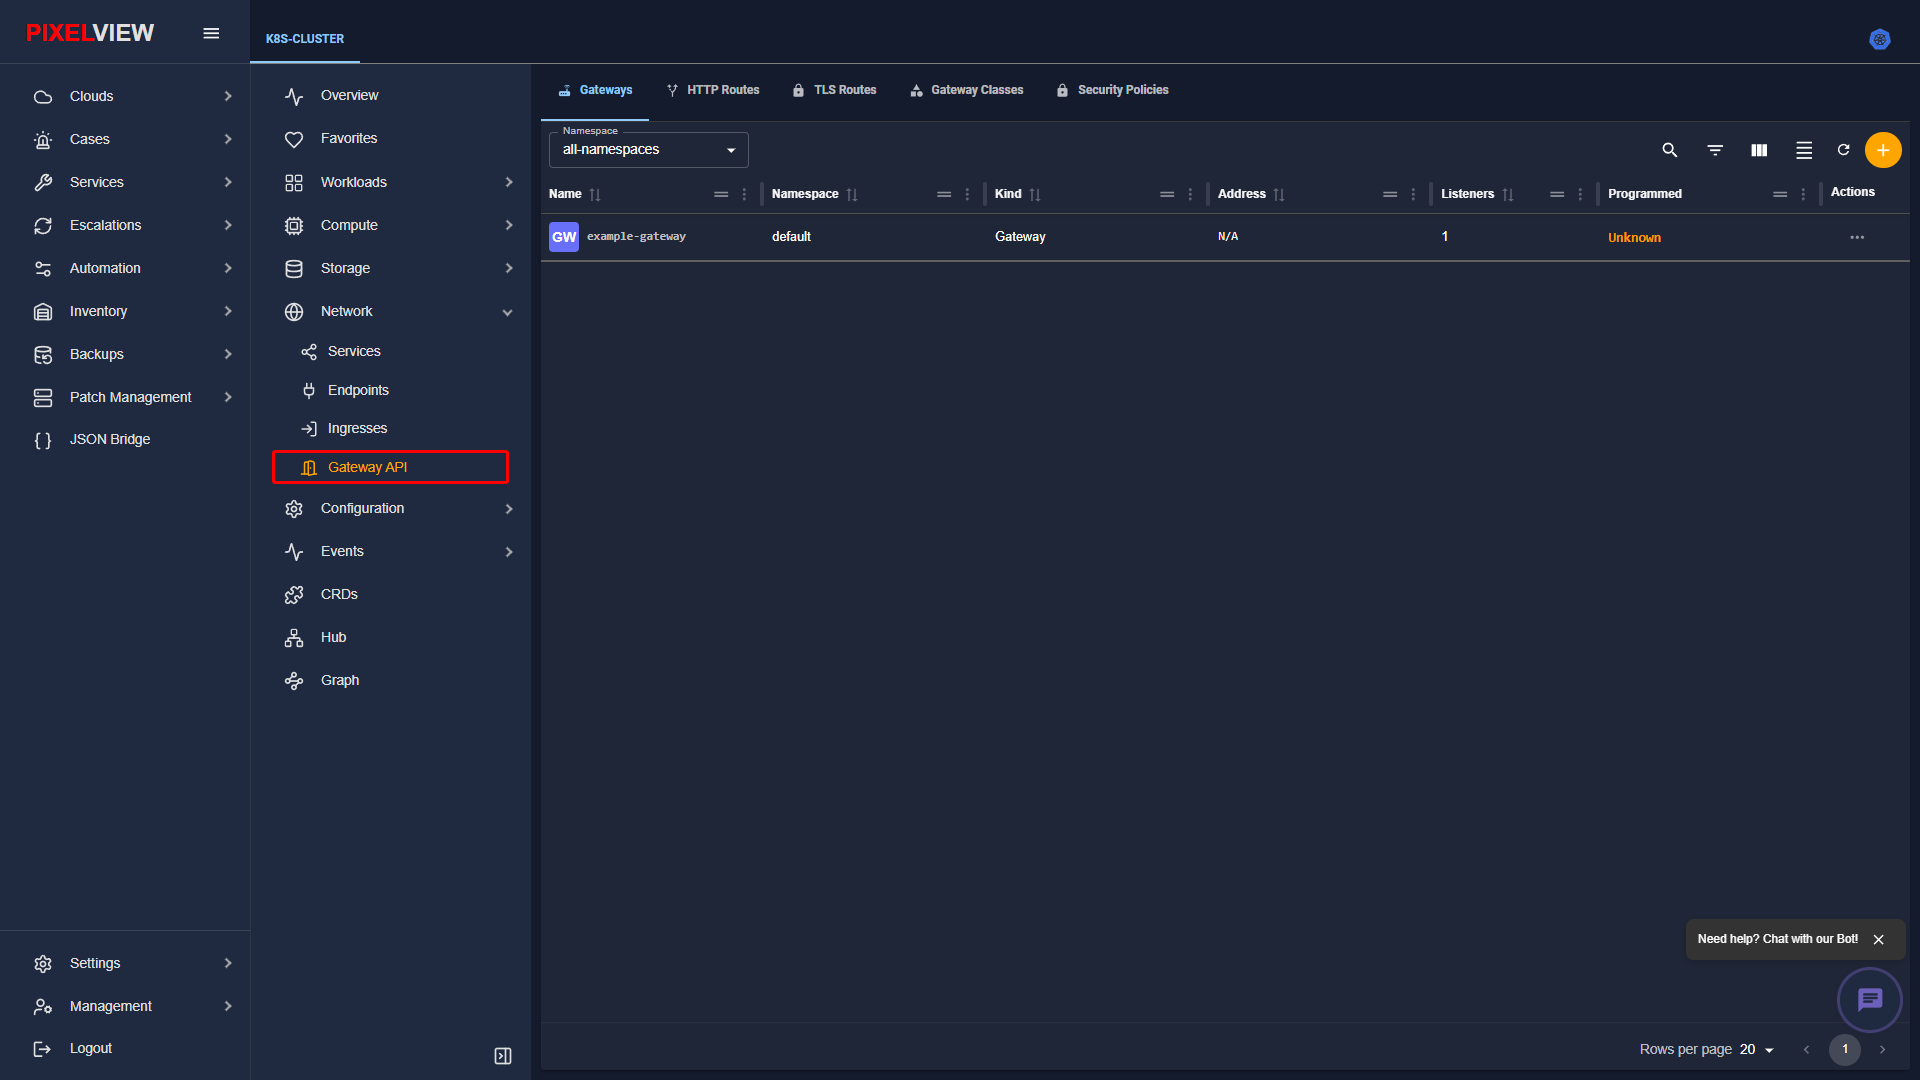
| Column | Description |
|---|---|
| Name | Gateway resource identifier. |
| Namespace | Scoped namespace. |
| Gateway Class | Infrastructure provider class (e.g., envoy-gateway). |
| Addresses | Network IP endpoints bound to the gateway. |
| Conditions | Readiness status flags (Programmed, Accepted). |
| Age | Resource age. |
Configuration & Governance
The Configuration submenu manages application environment parameters, encrypted credentials, quota enforcement, autoscaling policies, and high-availability drain budgets.
Namespaces
Namespaces provide virtual isolation boundaries within a single physical Kubernetes cluster, separating multi-tenant projects, environments (staging/production), and team workloads.
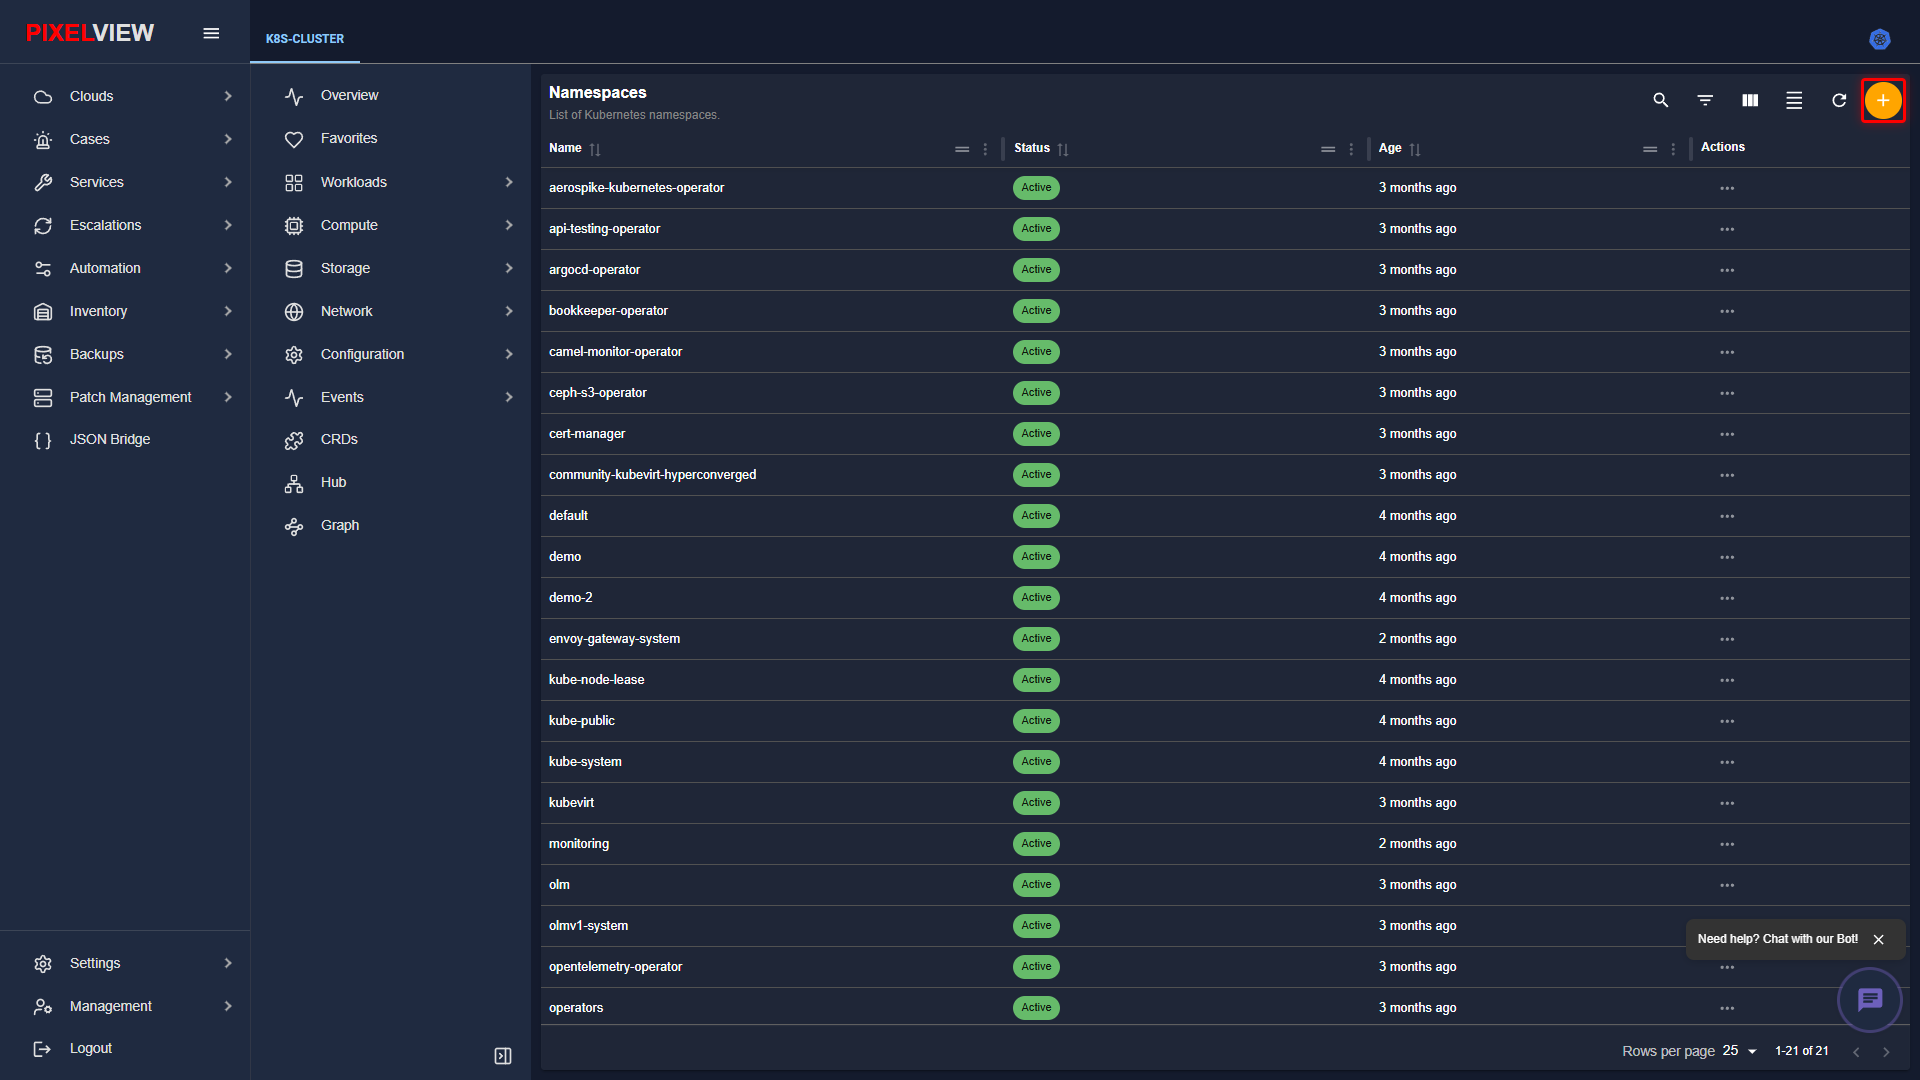
Namespaces Table Overview
Navigate to Configuration → Namespaces in the secondary sidebar:
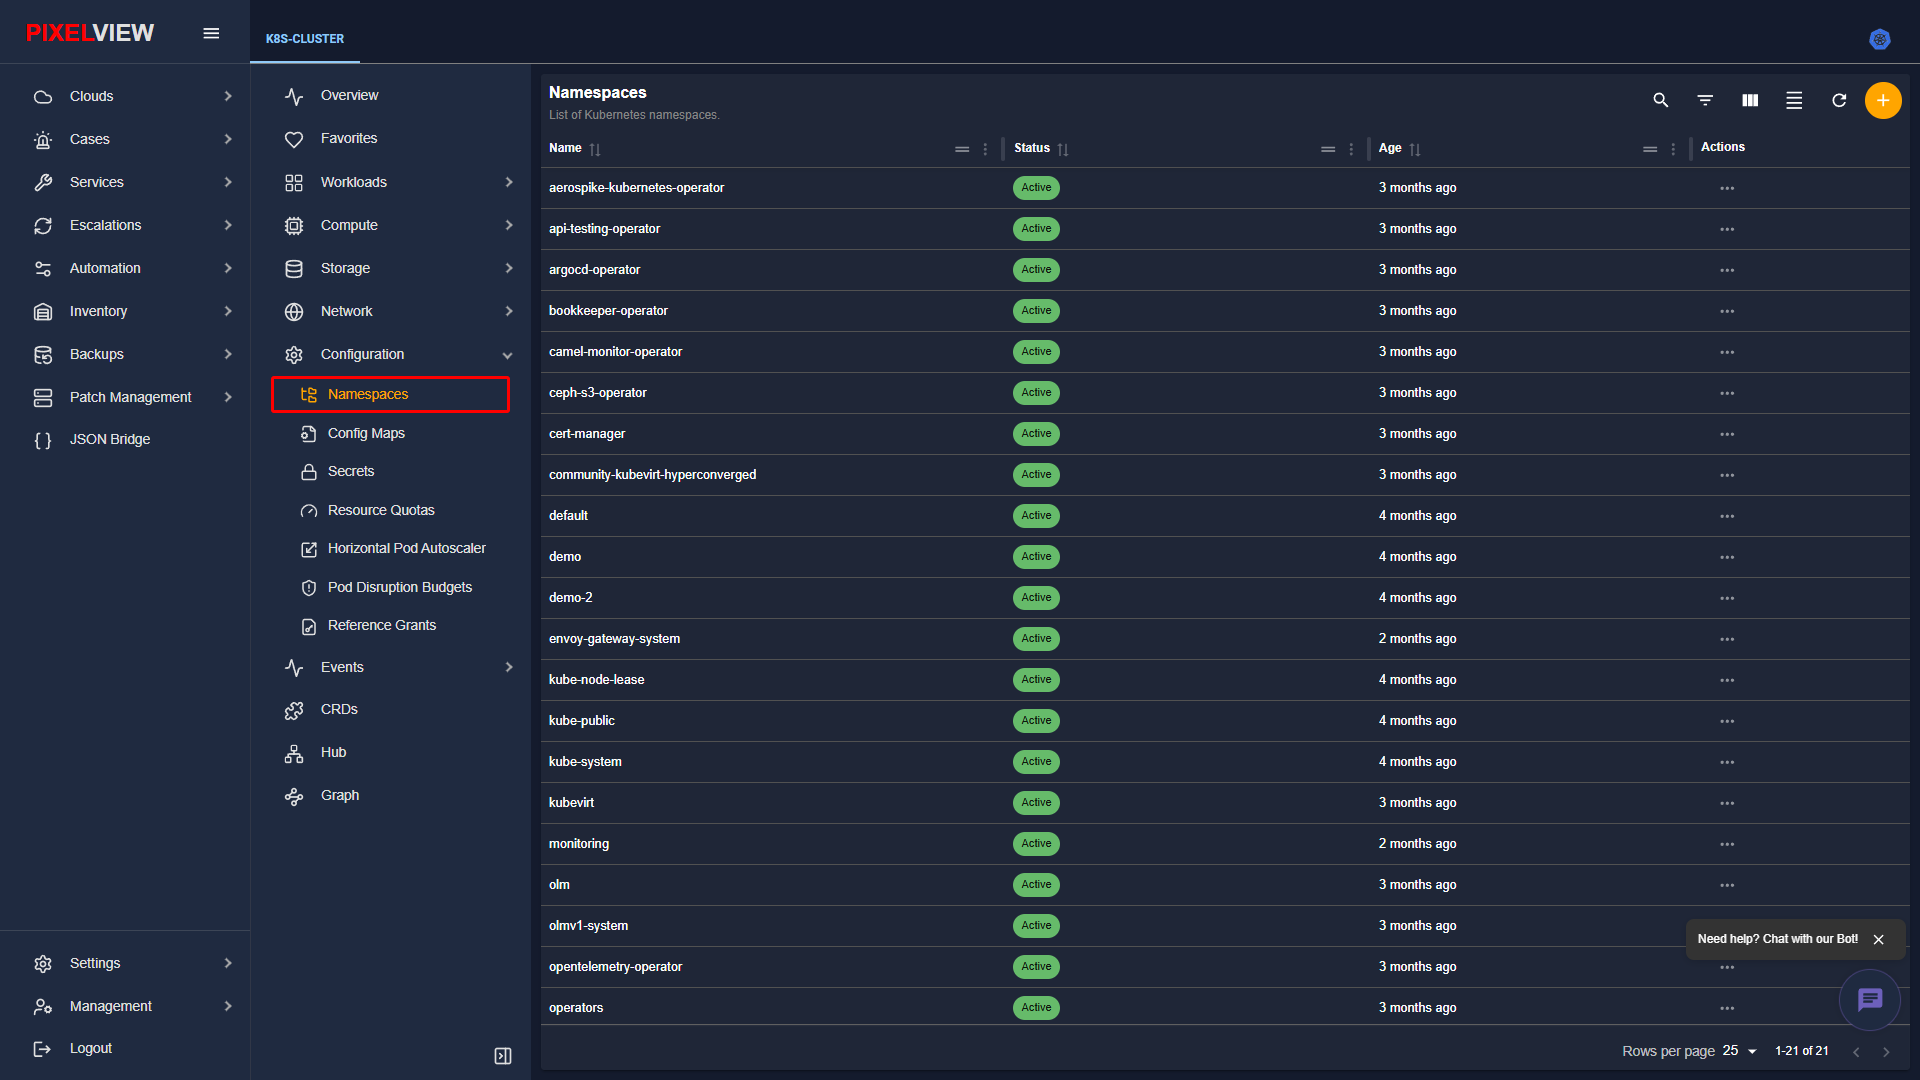
| Column | Description |
|---|---|
| Name | Namespace identifier (e.g., default, kube-system, monitoring, cert-manager). |
| Status | Namespace condition badge: Active or Terminating. |
| Age | Time elapsed since namespace creation. |
| Actions | Manage namespace resource quotas, role bindings, or delete namespace. |
Creating a Namespace Declaratively
To provision an isolated tenant or project namespace:
* In the secondary sidebar, navigate to Configuration → Namespaces.
* Click the orange circular + (Create namespace) button on the table toolbar:
- PixelView opens the Create New Namespace editor:
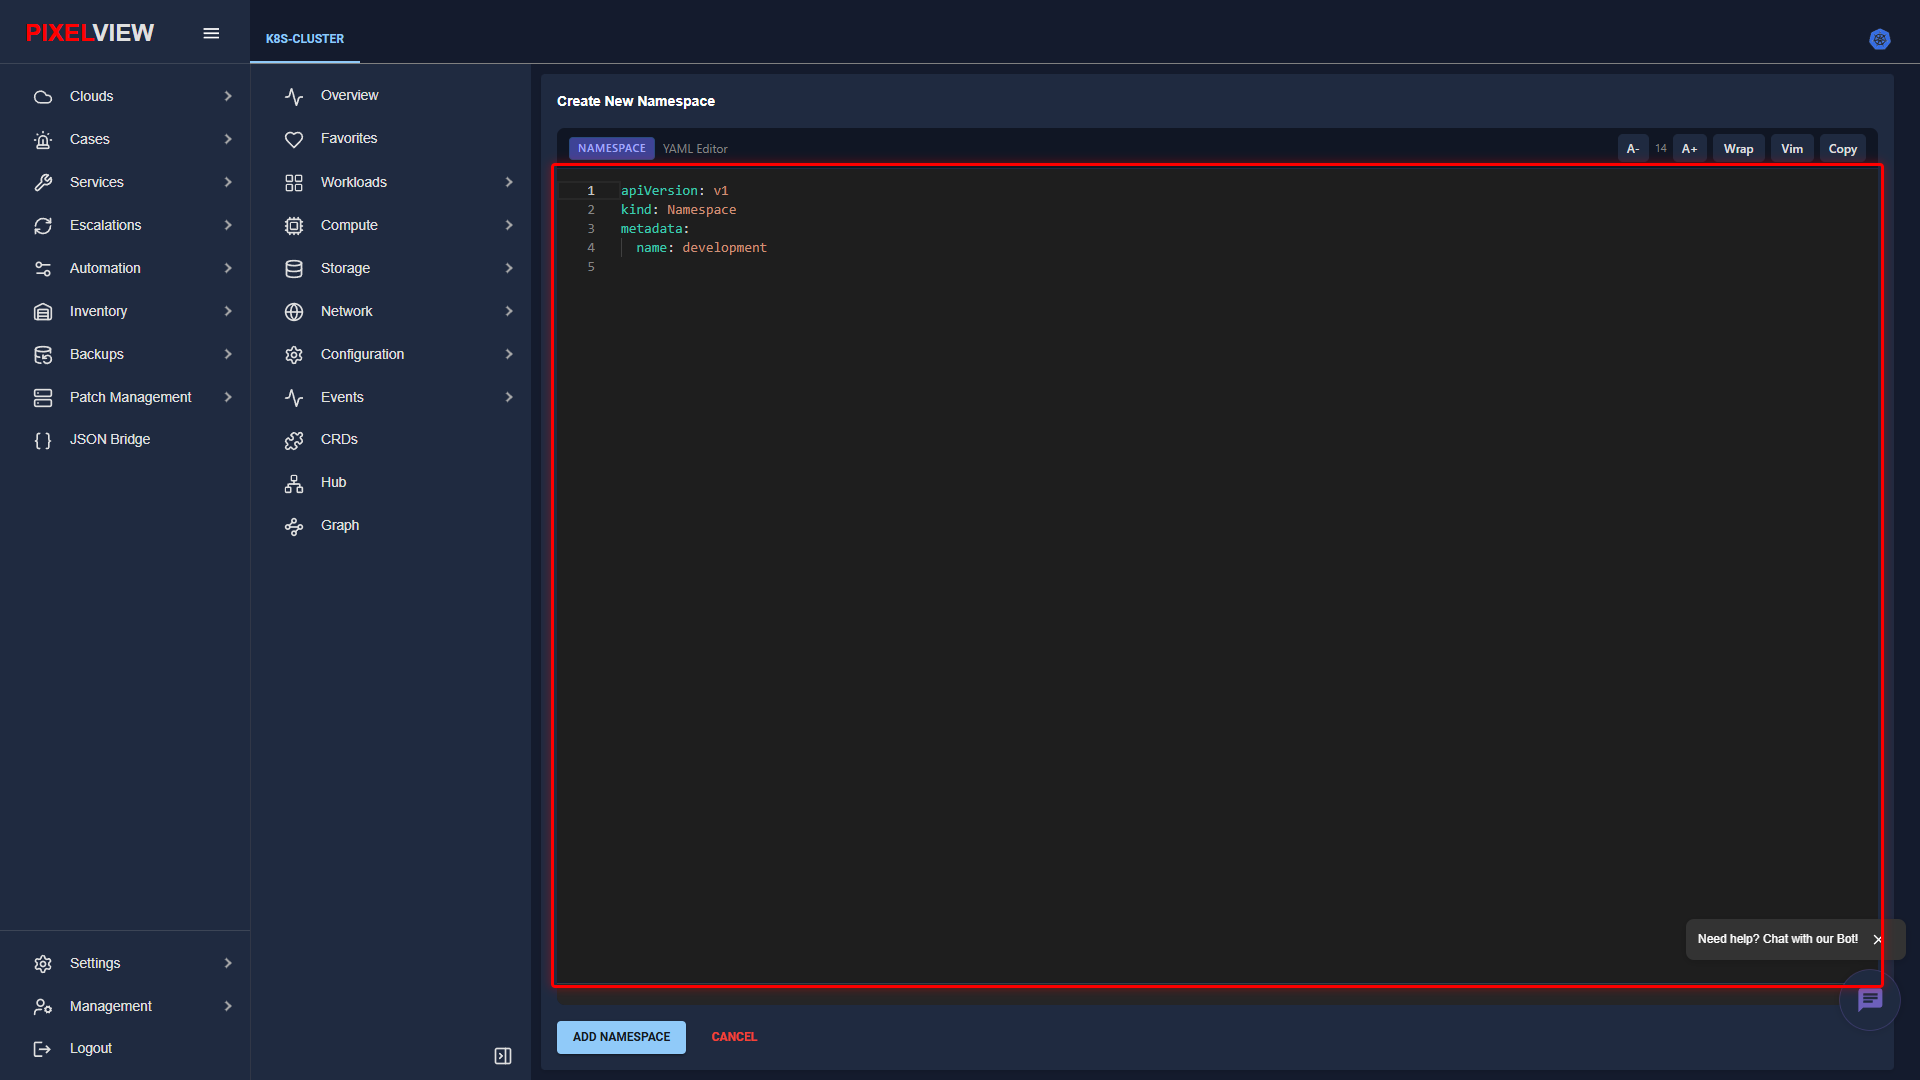
- The editor pre-populates a clean Namespace specification:
apiVersion:v1kind:Namespacemetadata.name: Target namespace identifier (e.g.,development,staging,production).- Click ADD NAMESPACE to apply the manifest to the cluster.
Config Maps
ConfigMaps store non-confidential key-value configuration data, decoupling application environment variables and configuration files from container images.
Config Maps Table Overview
Navigate to Configuration → Config Maps in the secondary sidebar:
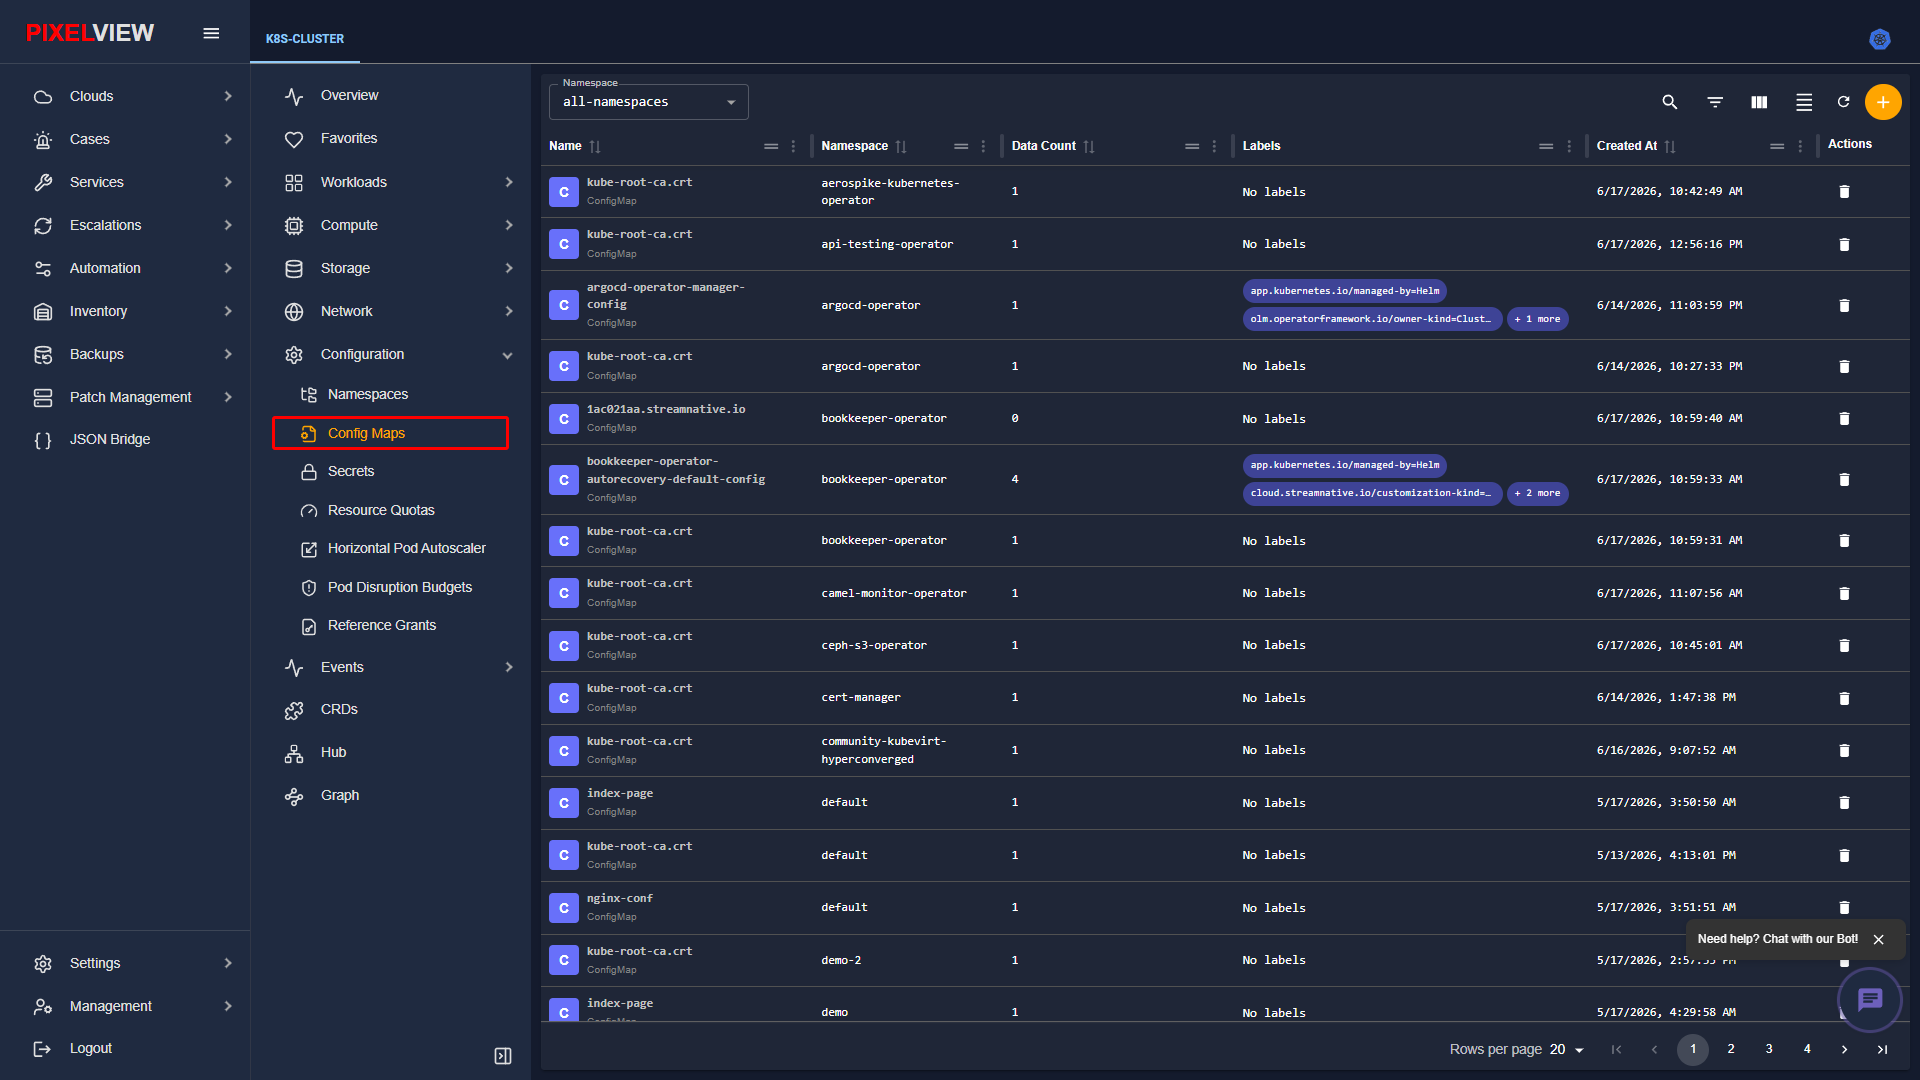
| Column | Description |
|---|---|
| Name | ConfigMap identifier. |
| Namespace | Tenant namespace boundary. |
| Data Count | Total number of configuration keys, properties, or mounted configuration files stored. |
| Labels | Organizational metadata tags. |
| Created At | Creation timestamp. |
| Actions | Edit configuration data keys, view raw YAML, or delete. |
Creating a ConfigMap Declaratively
To create a new configuration resource:
* In the secondary sidebar, navigate to Configuration → Config Maps.
* Click the orange circular + (Add ConfigMap) button on the table toolbar:
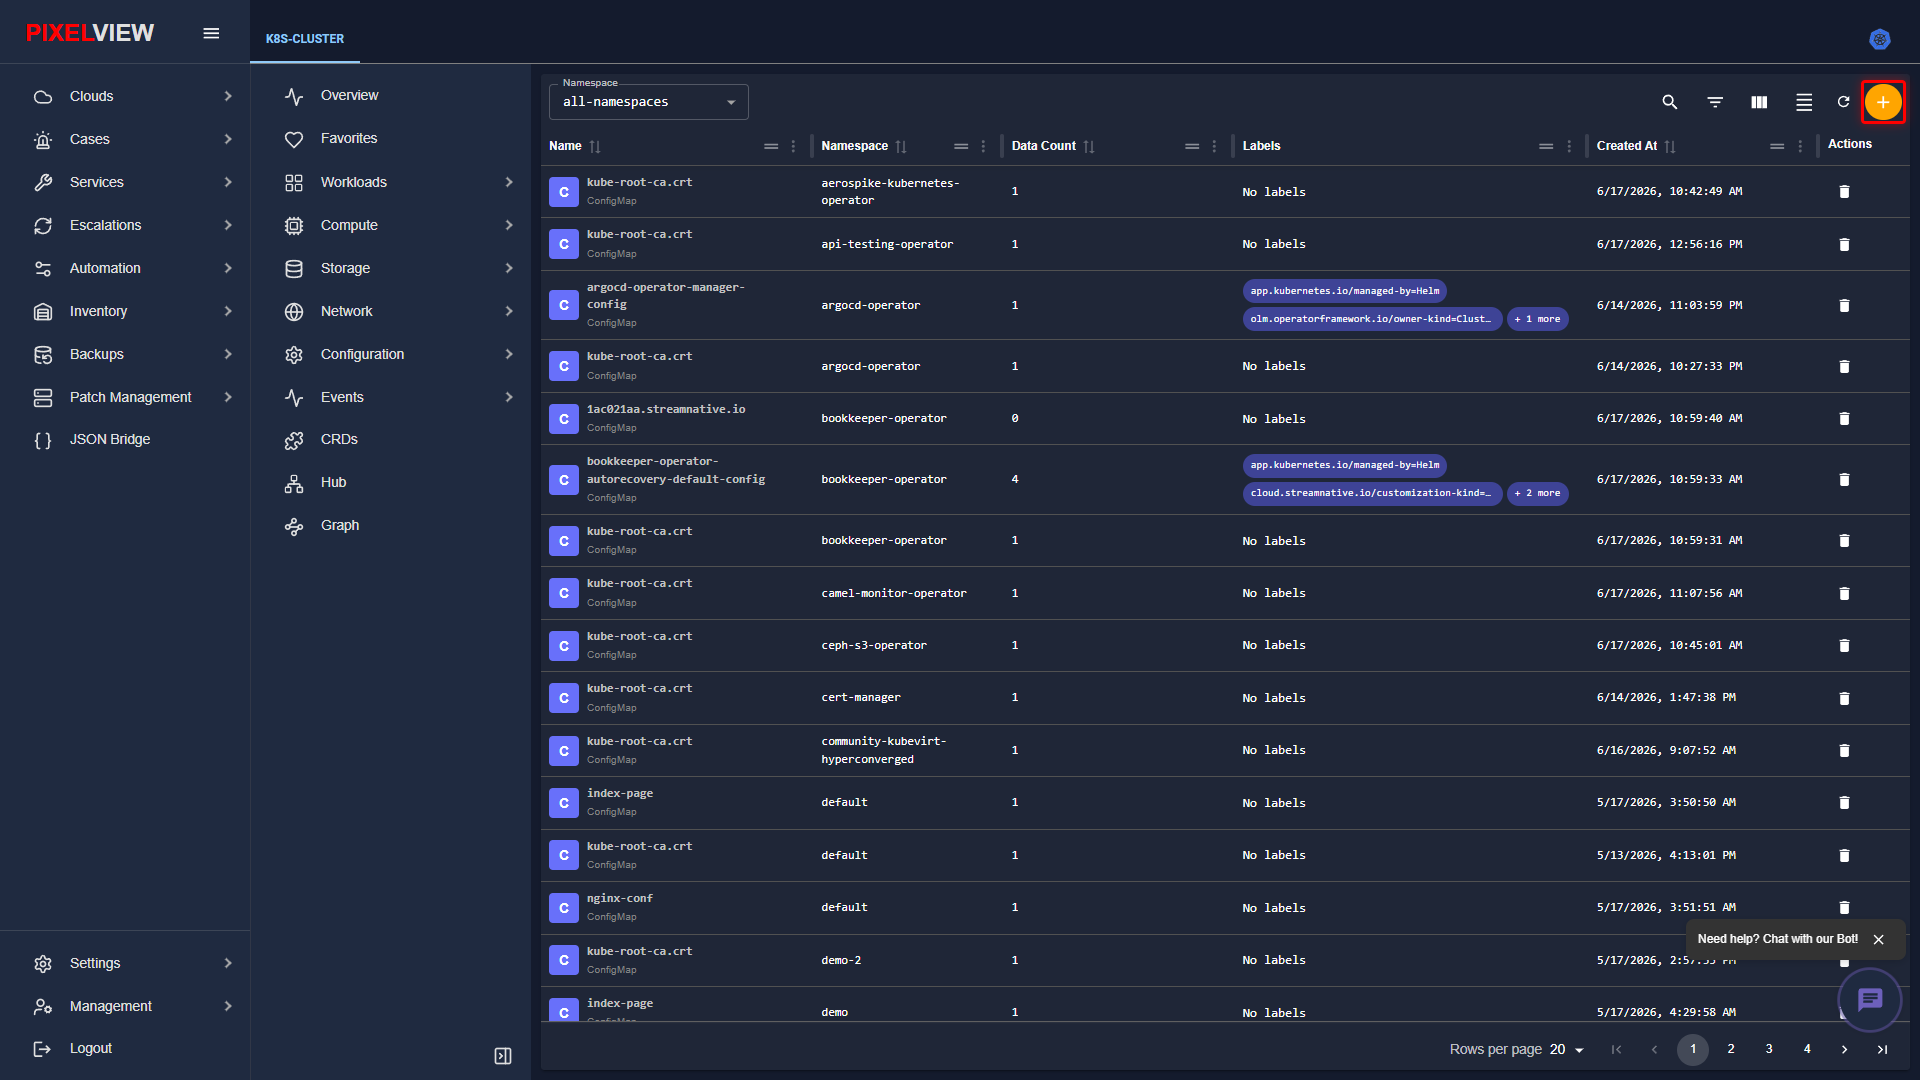
- PixelView opens the Create New ConfigMap editor:
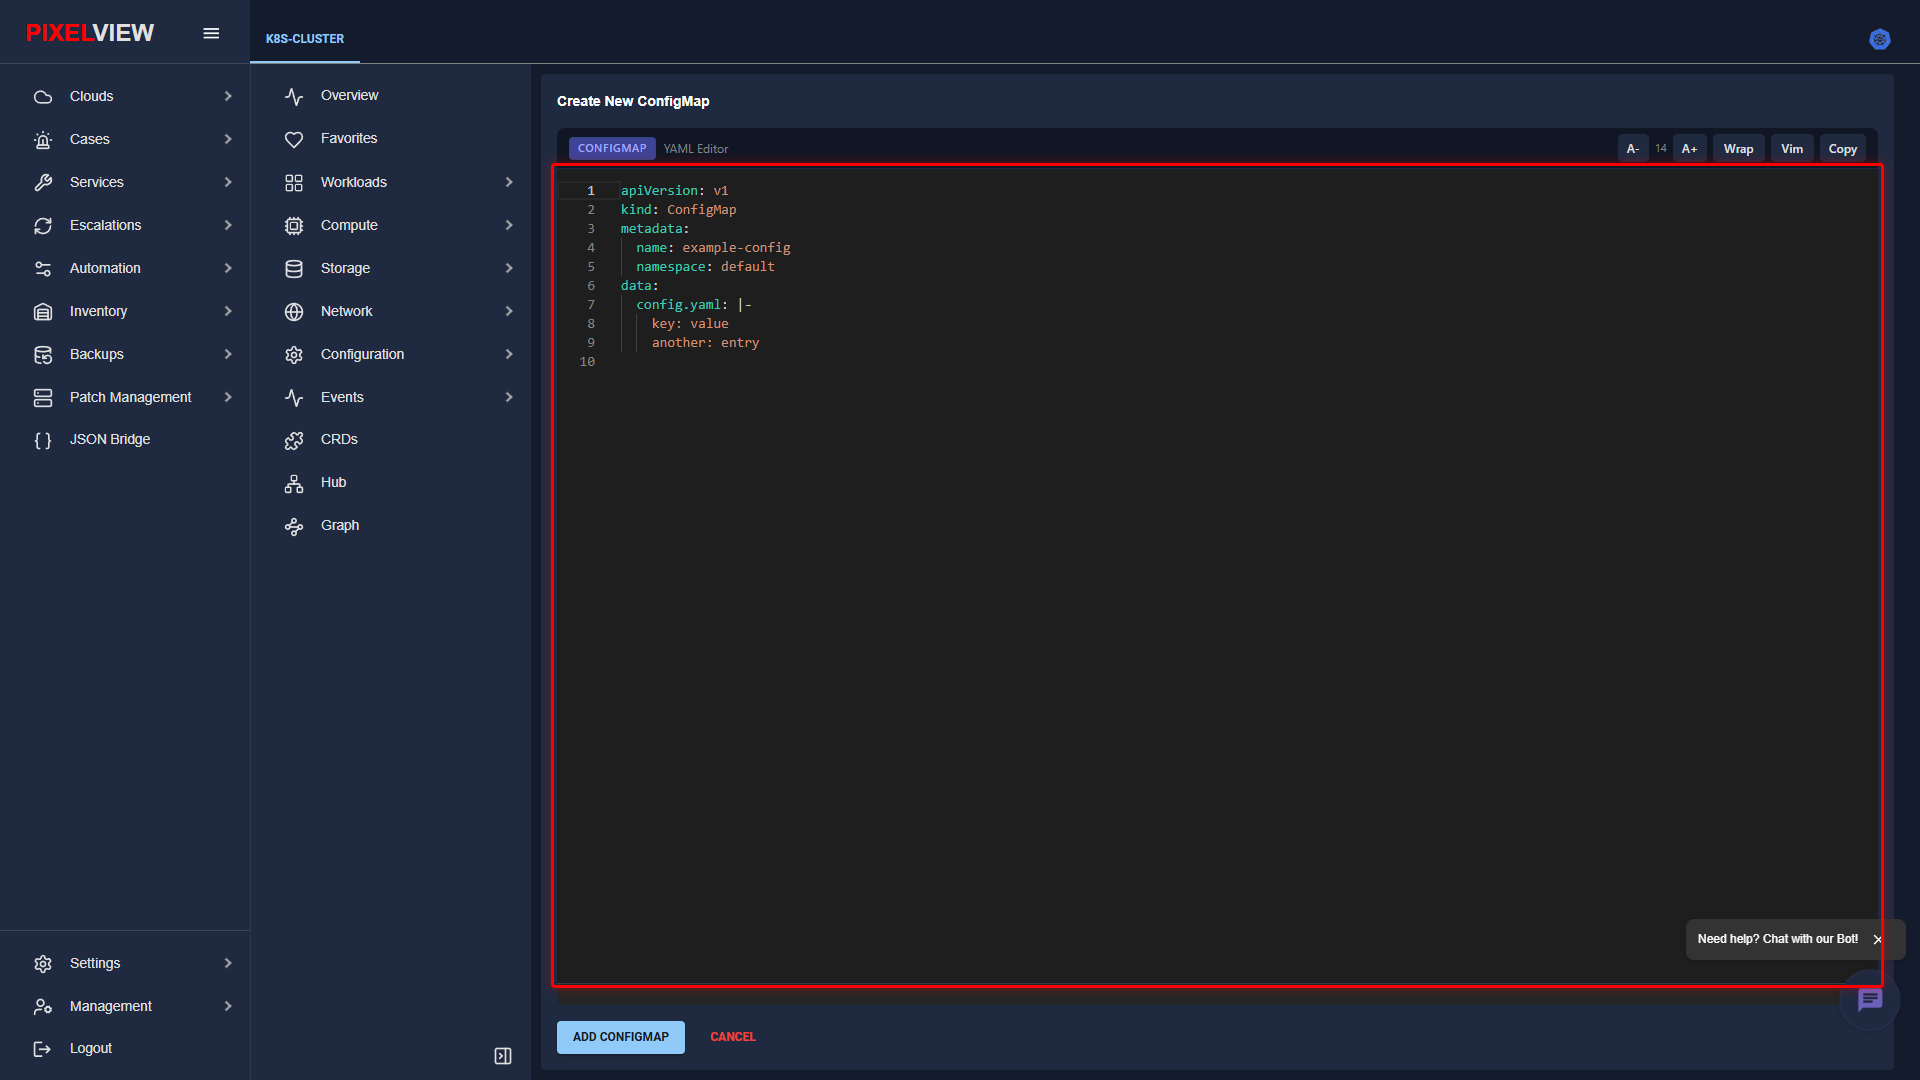
- The editor provides a ready-to-use ConfigMap manifest:
metadata.name: Configuration resource name (e.g.,example-config).metadata.namespace: Target namespace scope (defaults todefault).data: Key-value data map or multi-line configuration file content (e.g.,config.yaml: |-).- Click ADD CONFIGMAP to persist the configuration data.
Secrets
Secrets store and manage sensitive information such as passwords, OAuth tokens, SSH private keys, and TLS certificates.
Secrets Table Overview
Navigate to Configuration → Secrets in the secondary sidebar:
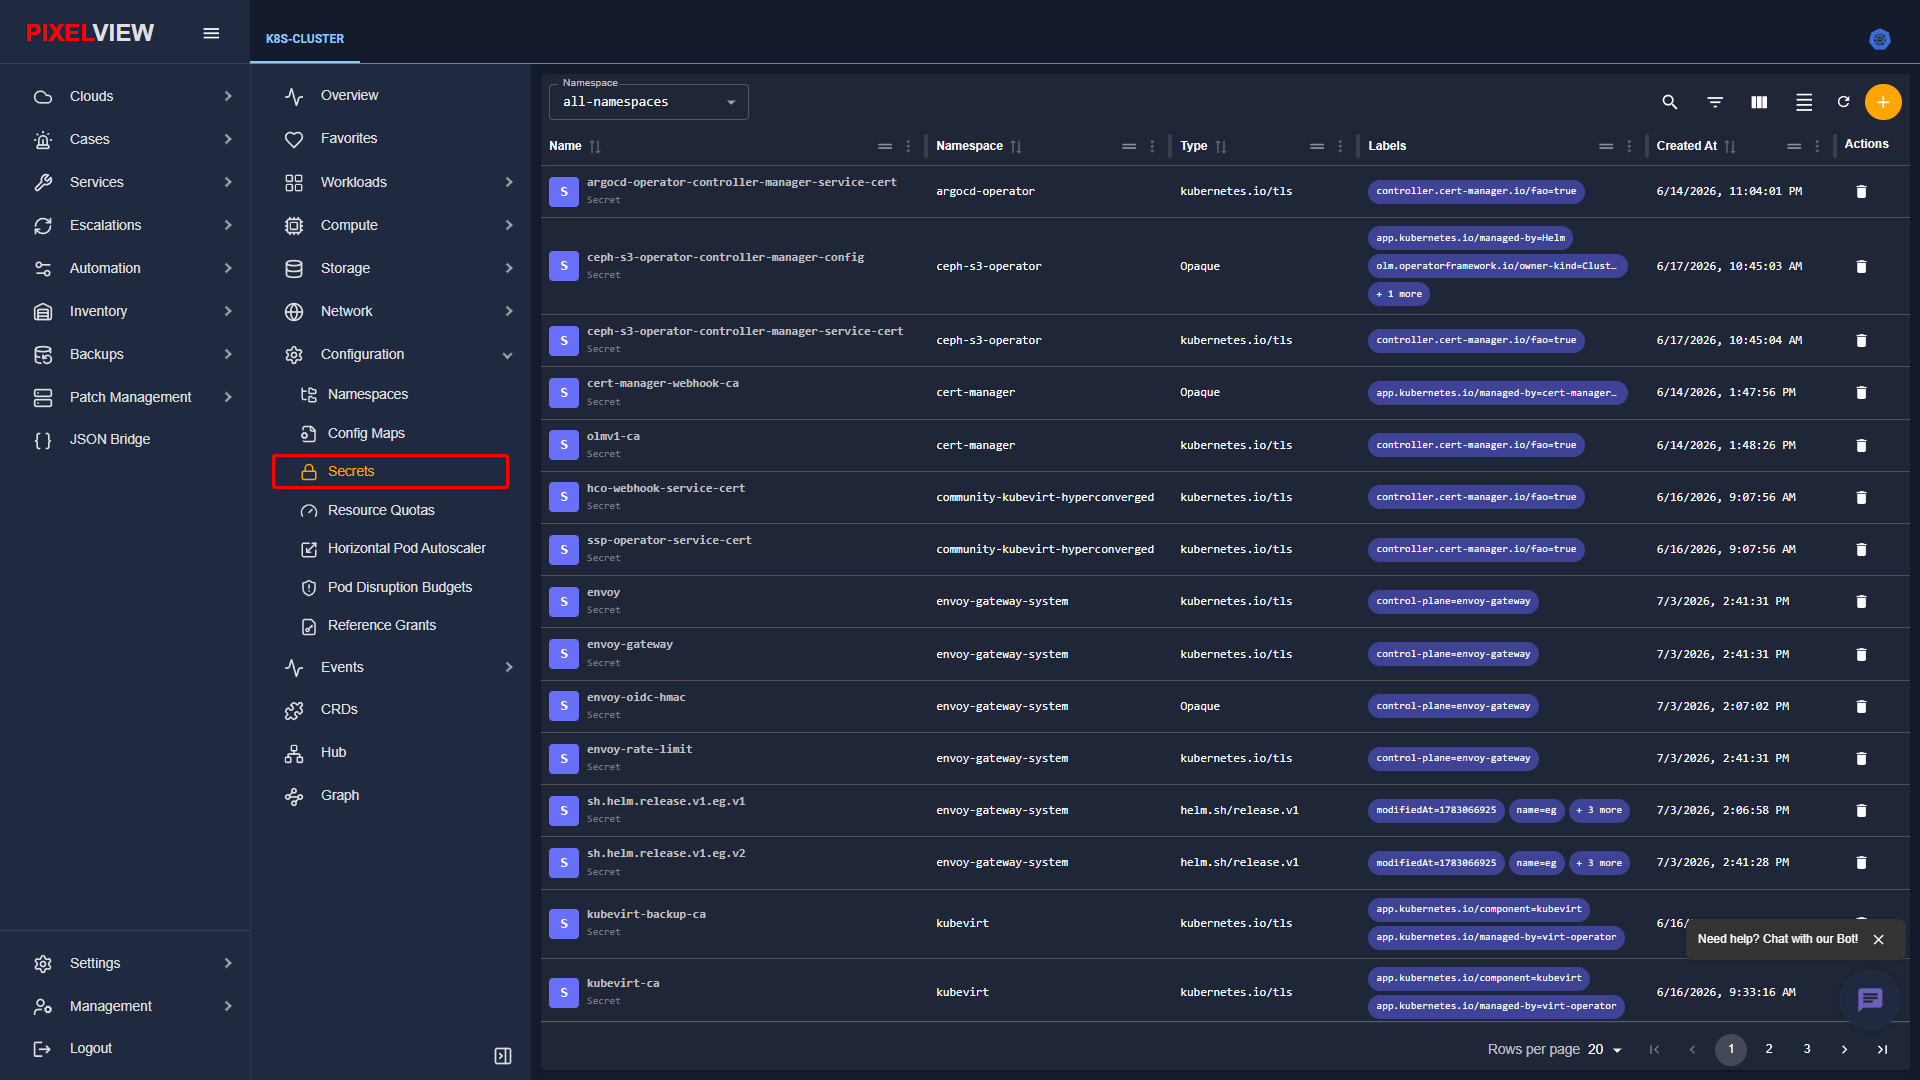
| Column | Description |
|---|---|
| Name | Secret resource identifier. |
| Namespace | Scoped namespace. |
| Type | Secret category: Opaque, kubernetes.io/tls, kubernetes.io/service-account-token, or kubernetes.io/dockerconfigjson. |
| Data Keys | Number of encrypted entries preserved in the secret payload. |
| Created At | Creation timestamp. |
| Actions | Reveal decoded secrets, rotate credentials, or delete. |
Creating a Secret Declaratively
To create encrypted sensitive application credentials:
* In the secondary sidebar, navigate to Configuration → Secrets.
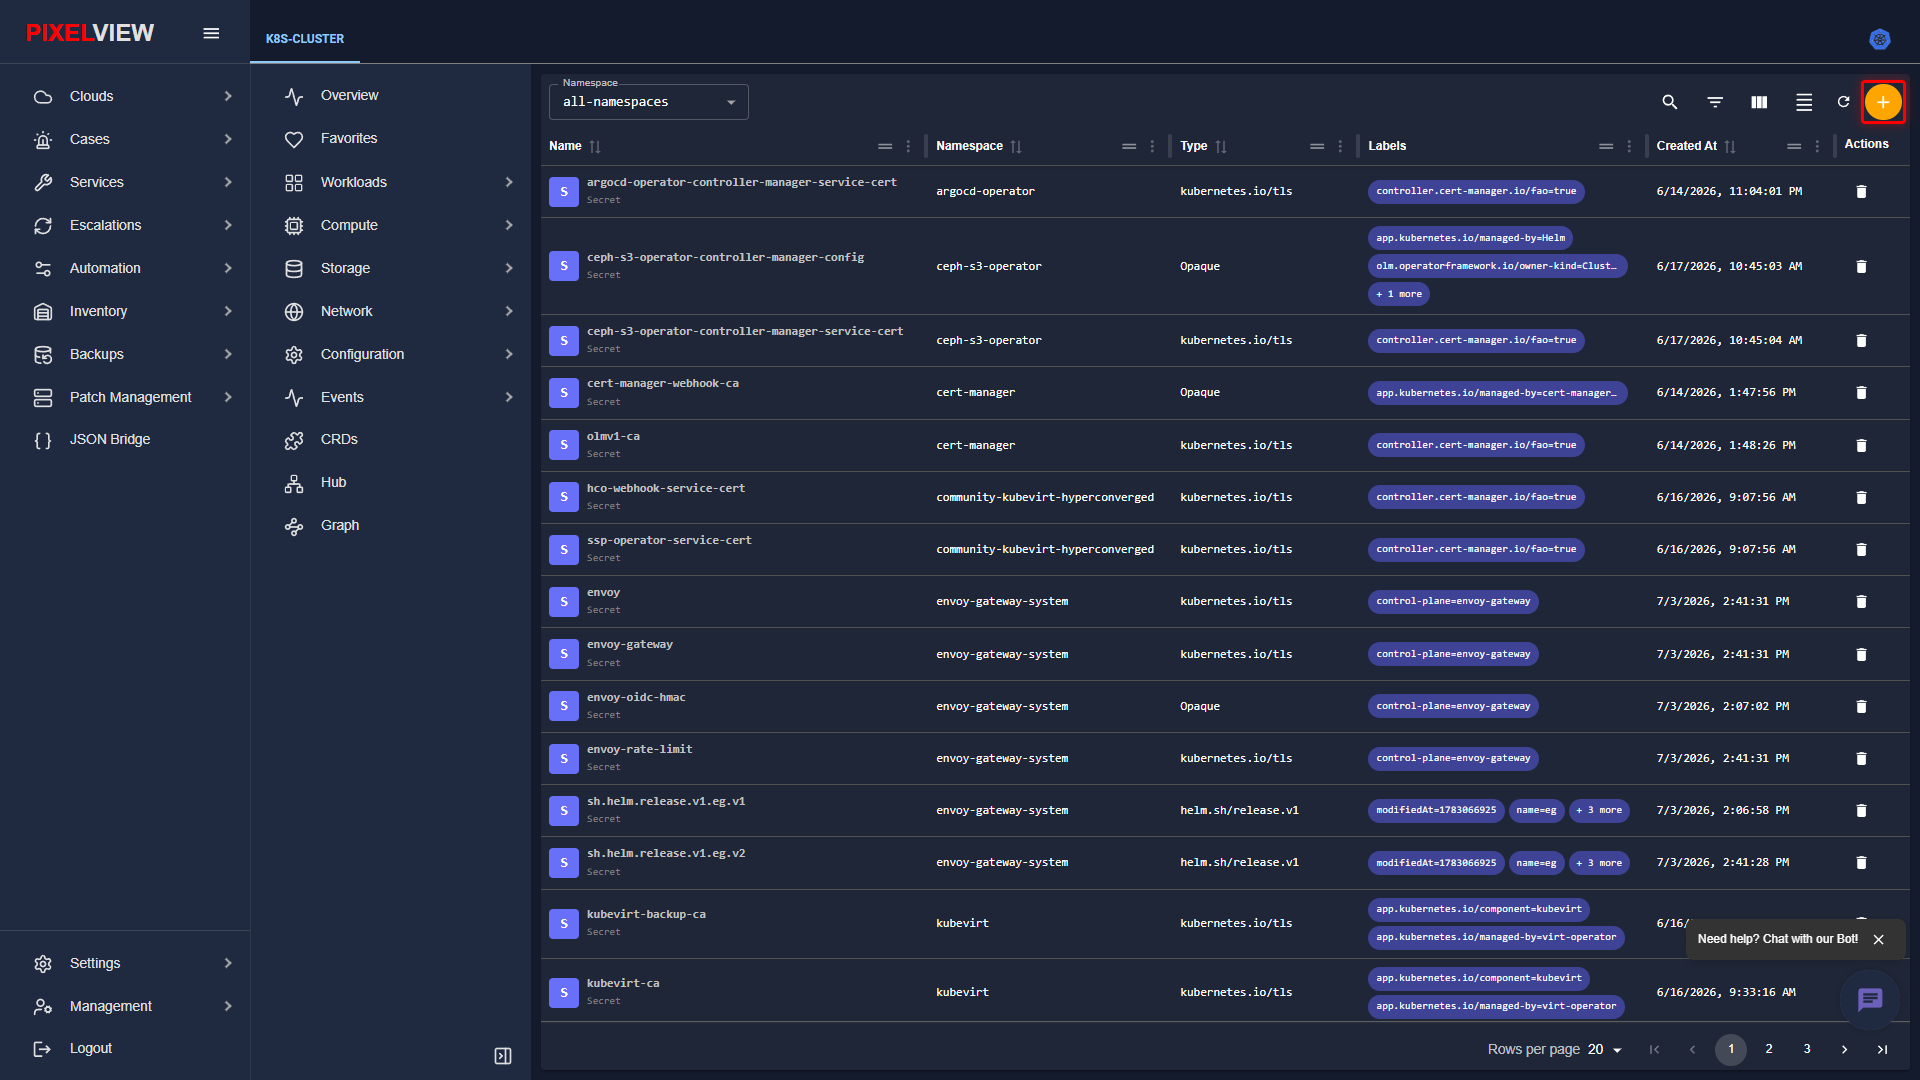
* Click the orange circular + (Add Secret) button on the table toolbar:
- PixelView opens the Create New Secret editor:
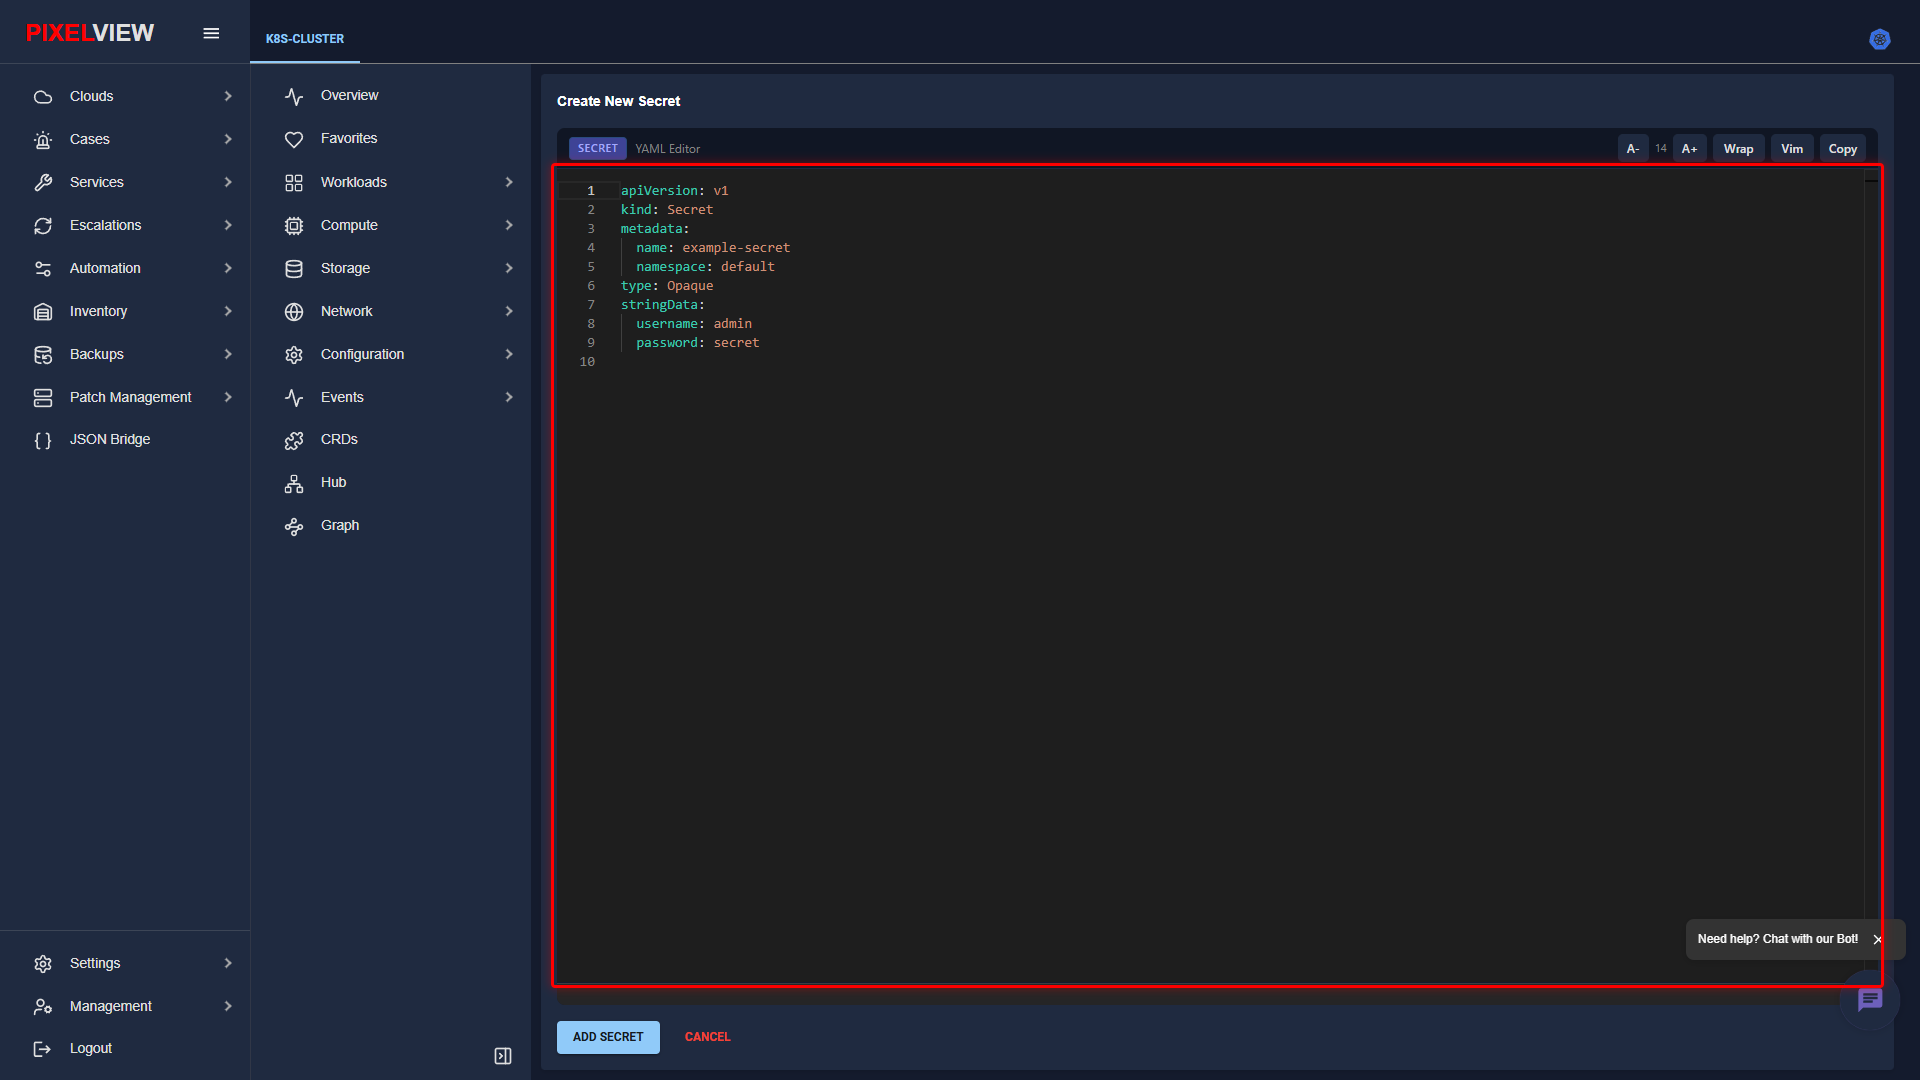
- The editor supplies an Opaque secret template:
metadata.name: Secret identifier (e.g.,example-secret).metadata.namespace: Scoped tenant namespace (defaults todefault).type: Secret category (Opaque,kubernetes.io/tls, etc.).stringData: Plaintext key-value credentials (e.g.,username: admin,password: secret) automatically base64-encoded by the Kubernetes API server upon submission.- Click ADD SECRET to securely inject the secret into the cluster.
Resource Quotas
Resource Quotas set hard consumption constraints per namespace, limiting aggregated CPU, memory, and total object counts (pods, services, PVCs) to prevent tenant resource starvation.
Resource Quotas Table Overview
Navigate to Configuration → Resource Quotas in the secondary sidebar:
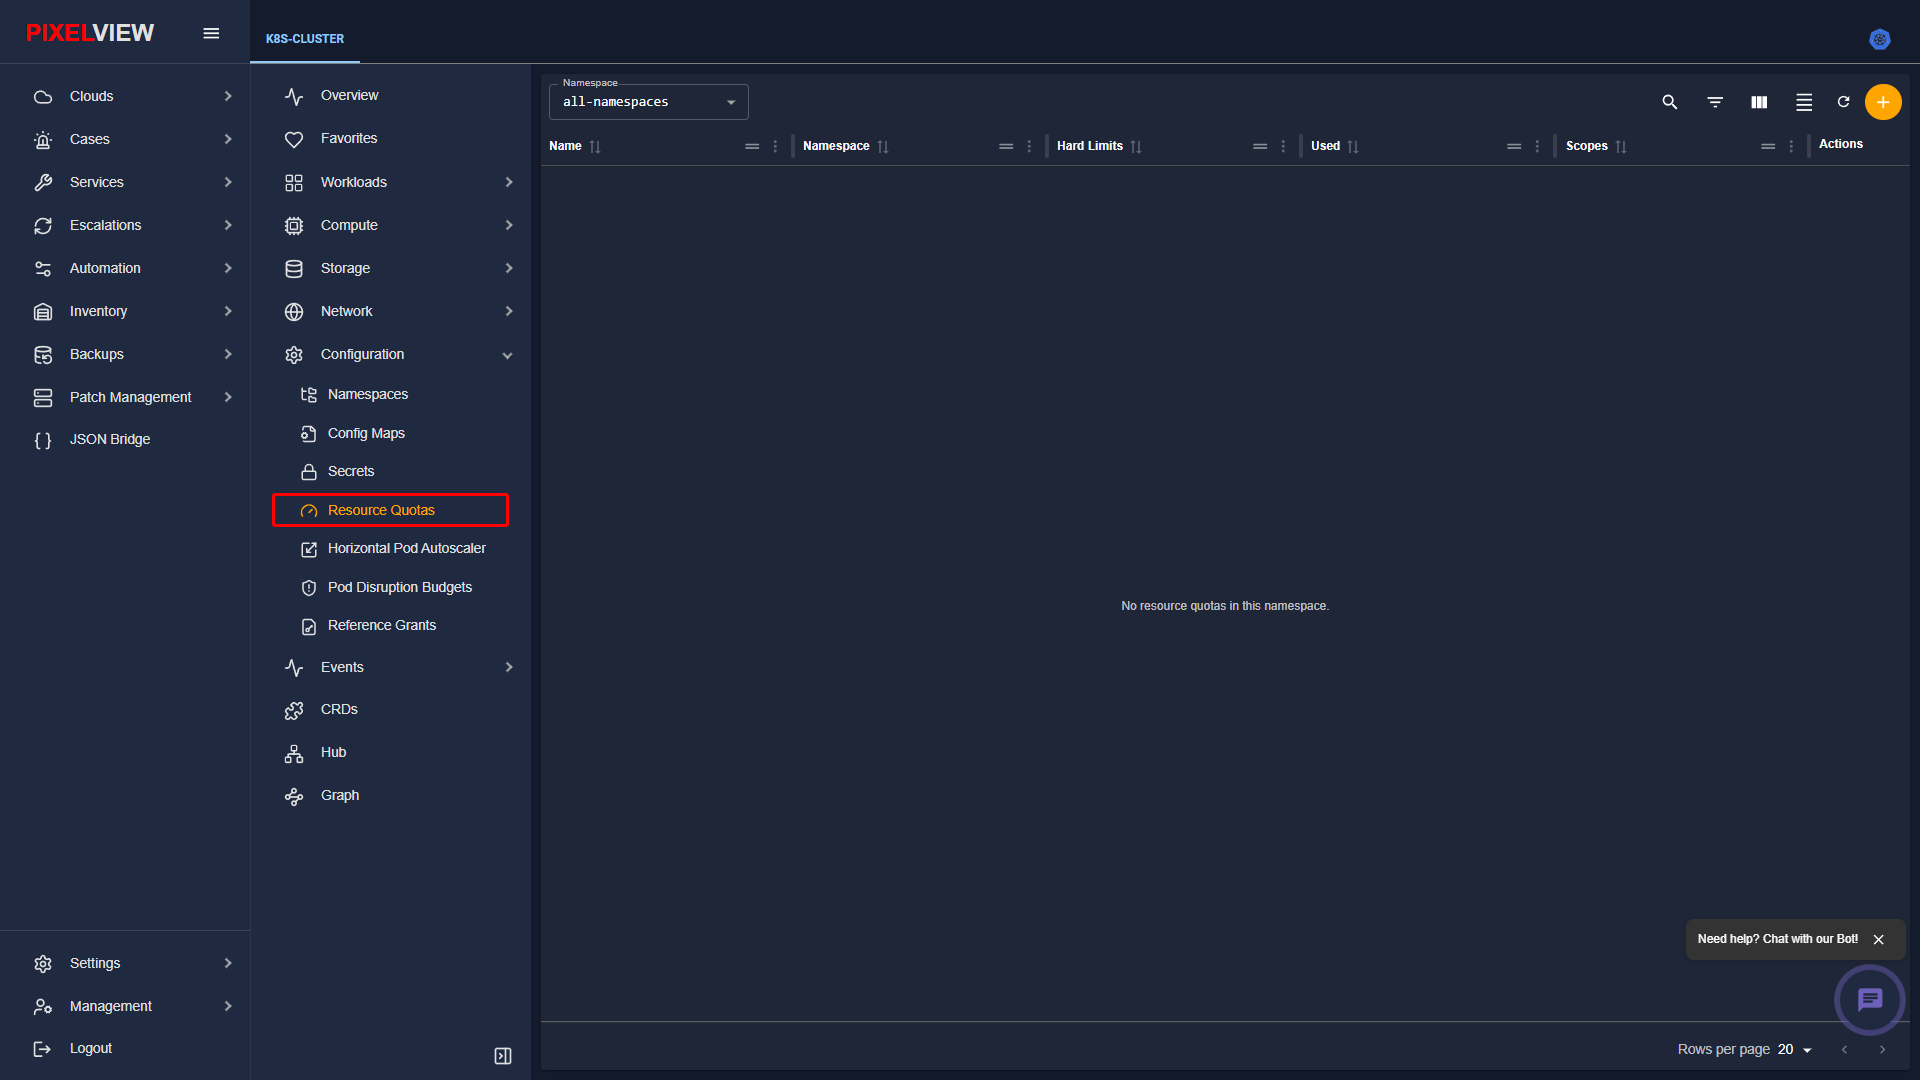
| Column | Description |
|---|---|
| Name | Quota policy identifier. |
| Namespace | Scoped tenant namespace. |
| CPU Limits | Maximum compute cores permitted across all pods in the namespace. |
| Memory Limits | Maximum RAM capacity permitted in the namespace. |
| Storage Quota | Aggregated persistent storage capacity allocation limit. |
Horizontal Pod Autoscalers (HPA)
Horizontal Pod Autoscalers automatically scale the number of Pods in a Deployment or StatefulSet based on observed CPU utilization or custom application metrics.
HPA Table Overview
Navigate to Configuration → Horizontal Pod Autoscalers in the secondary sidebar:
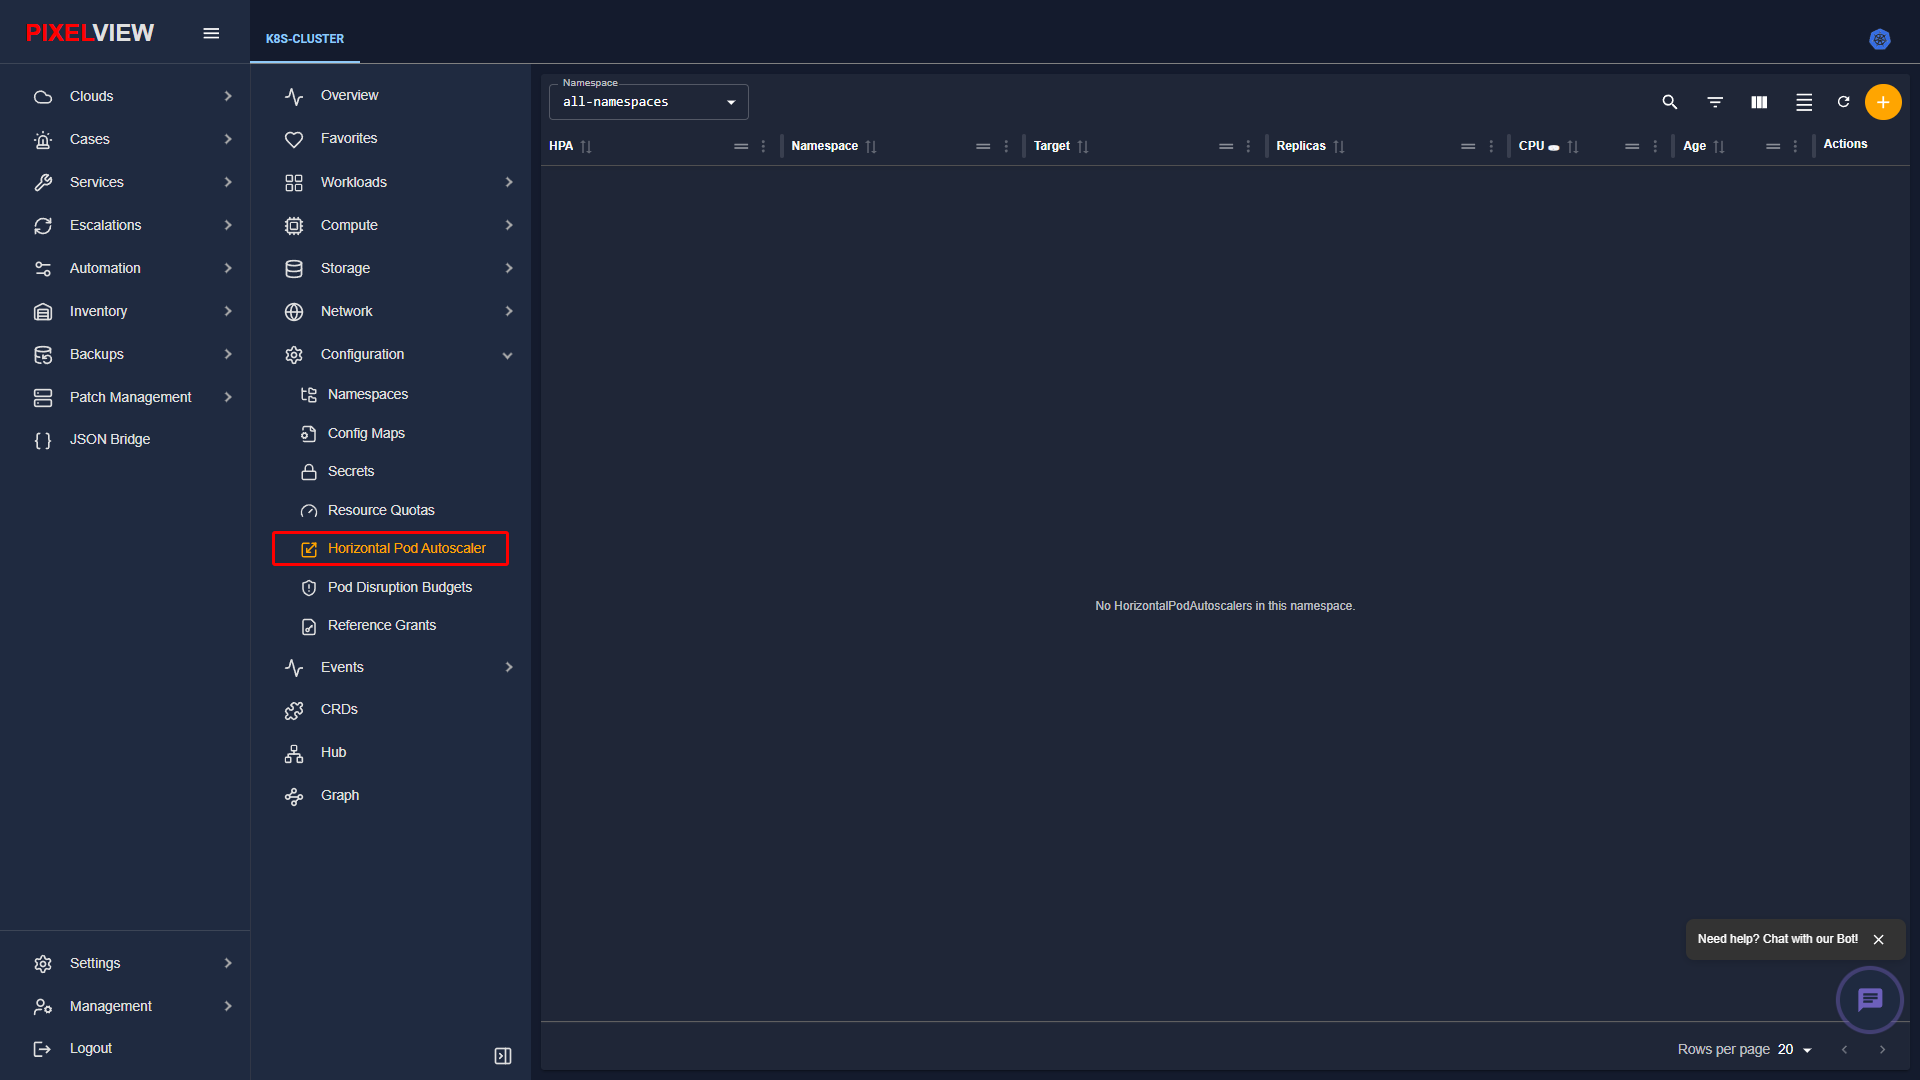
| Column | Description |
|---|---|
| Name | Autoscaler policy name. |
| Namespace | Host namespace boundary. |
| Reference Target | Target controller scaled by the HPA (e.g., Deployment/web-frontend). |
| Targets Metric | Current metric threshold vs target trigger (e.g., 65% / 80% CPU). |
| Min / Max Pods | Scaling boundary constraints (e.g., min: 2, max: 20). |
| Replicas | Current active replica count dynamically provisioned by the HPA. |
Pod Disruption Budgets (PDB)
Pod Disruption Budgets limit the number of Pods of a replicated application that are down simultaneously from voluntary disruptions (e.g., node drains during maintenance or kernel upgrades).
PDB Table Overview
Navigate to Configuration → Pod Disruption Budgets in the secondary sidebar:
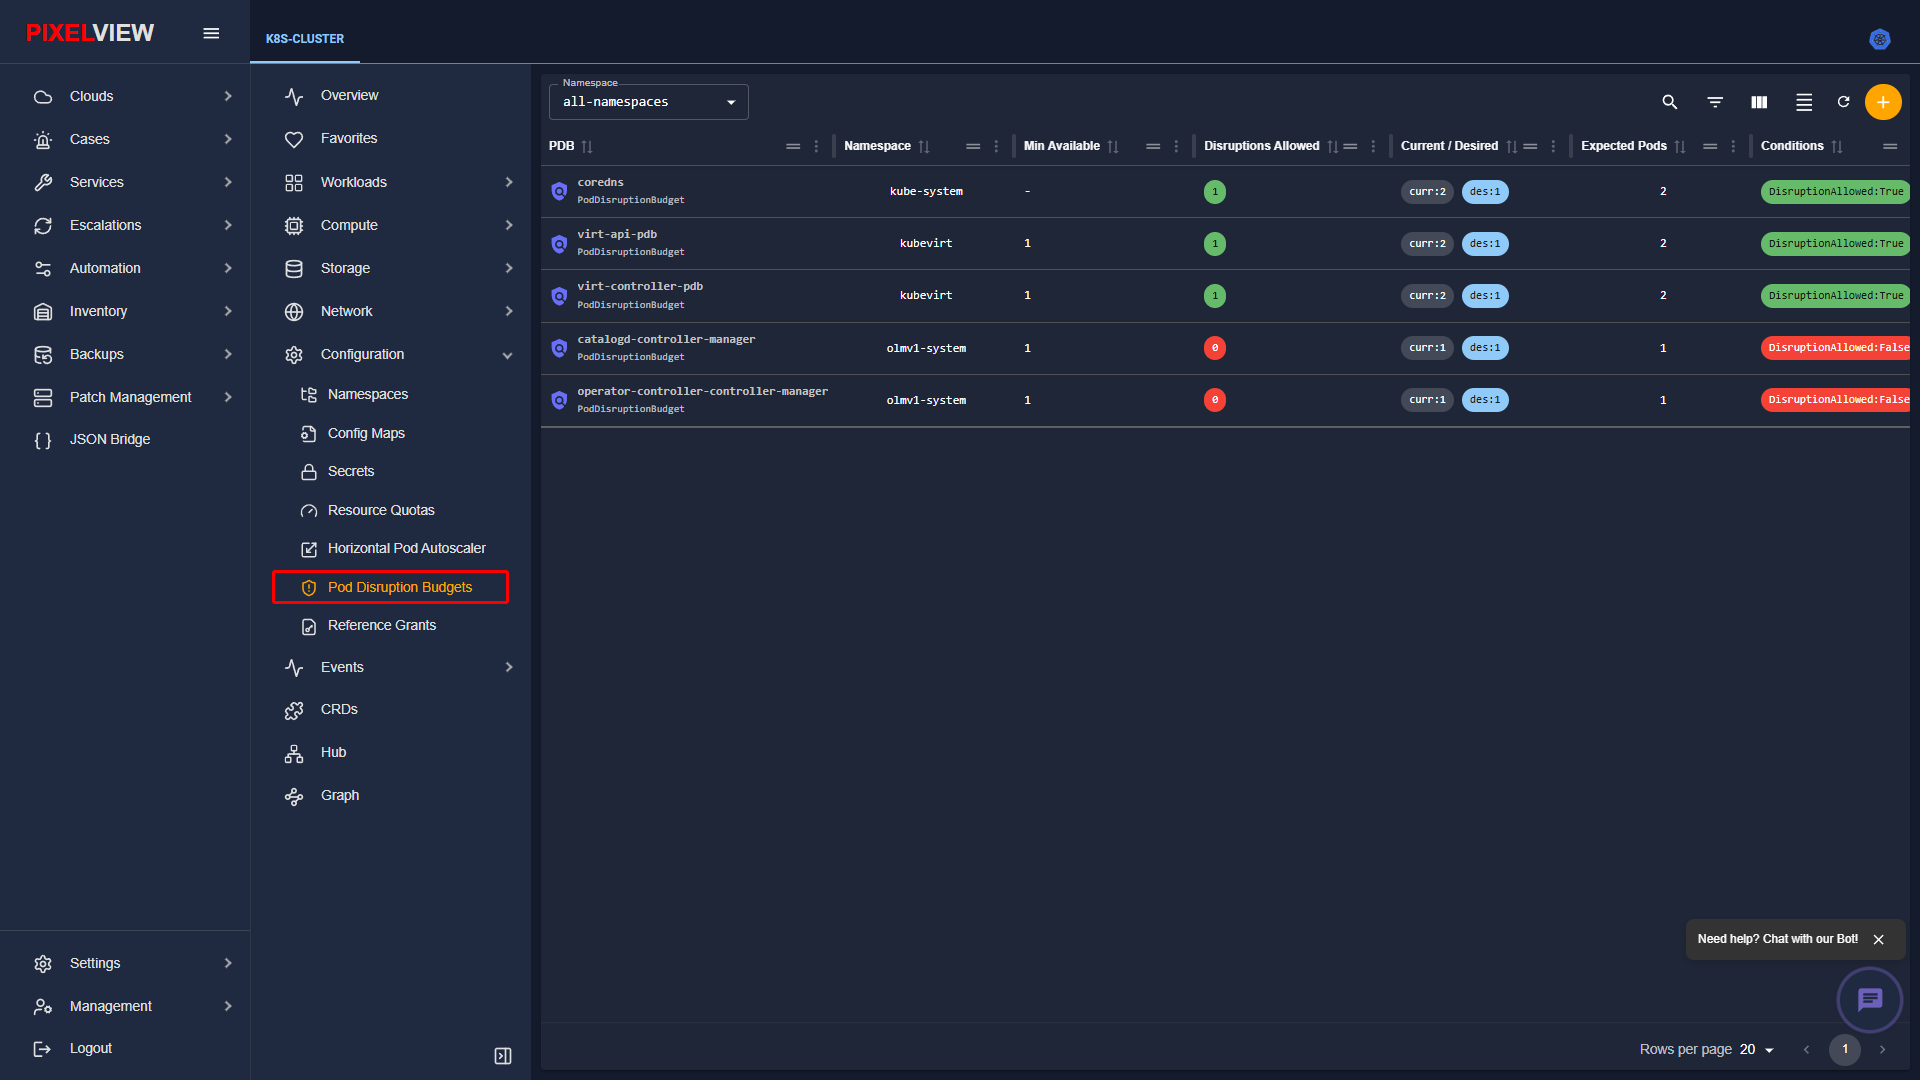
| Column | Description |
|---|---|
| Name | Budget policy identifier. |
| Namespace | Scoped namespace. |
| Min Available | Minimum number (or percentage) of pods that must remain operational. |
| Max Unavailable | Maximum pods that can be taken offline simultaneously during node draining. |
| Current Healthy | Active healthy pods currently verified by readiness probes. |
| Desired Healthy | Required baseline pods enforced by the disruption budget. |
Cluster Events Stream
The Events stream (/kubernetes/:clusterName/events) records cluster state changes, scheduler actions, container lifecycle transitions, and warning errors across all namespaces in real time. PixelView consumes Kubernetes event objects (events.k8s.io/v1) directly from the API server stream, caching and aggregating them to provide instant visibility into cluster health and automated incident correlation.
Events Table Overview
Navigate to Events in the secondary sidebar:
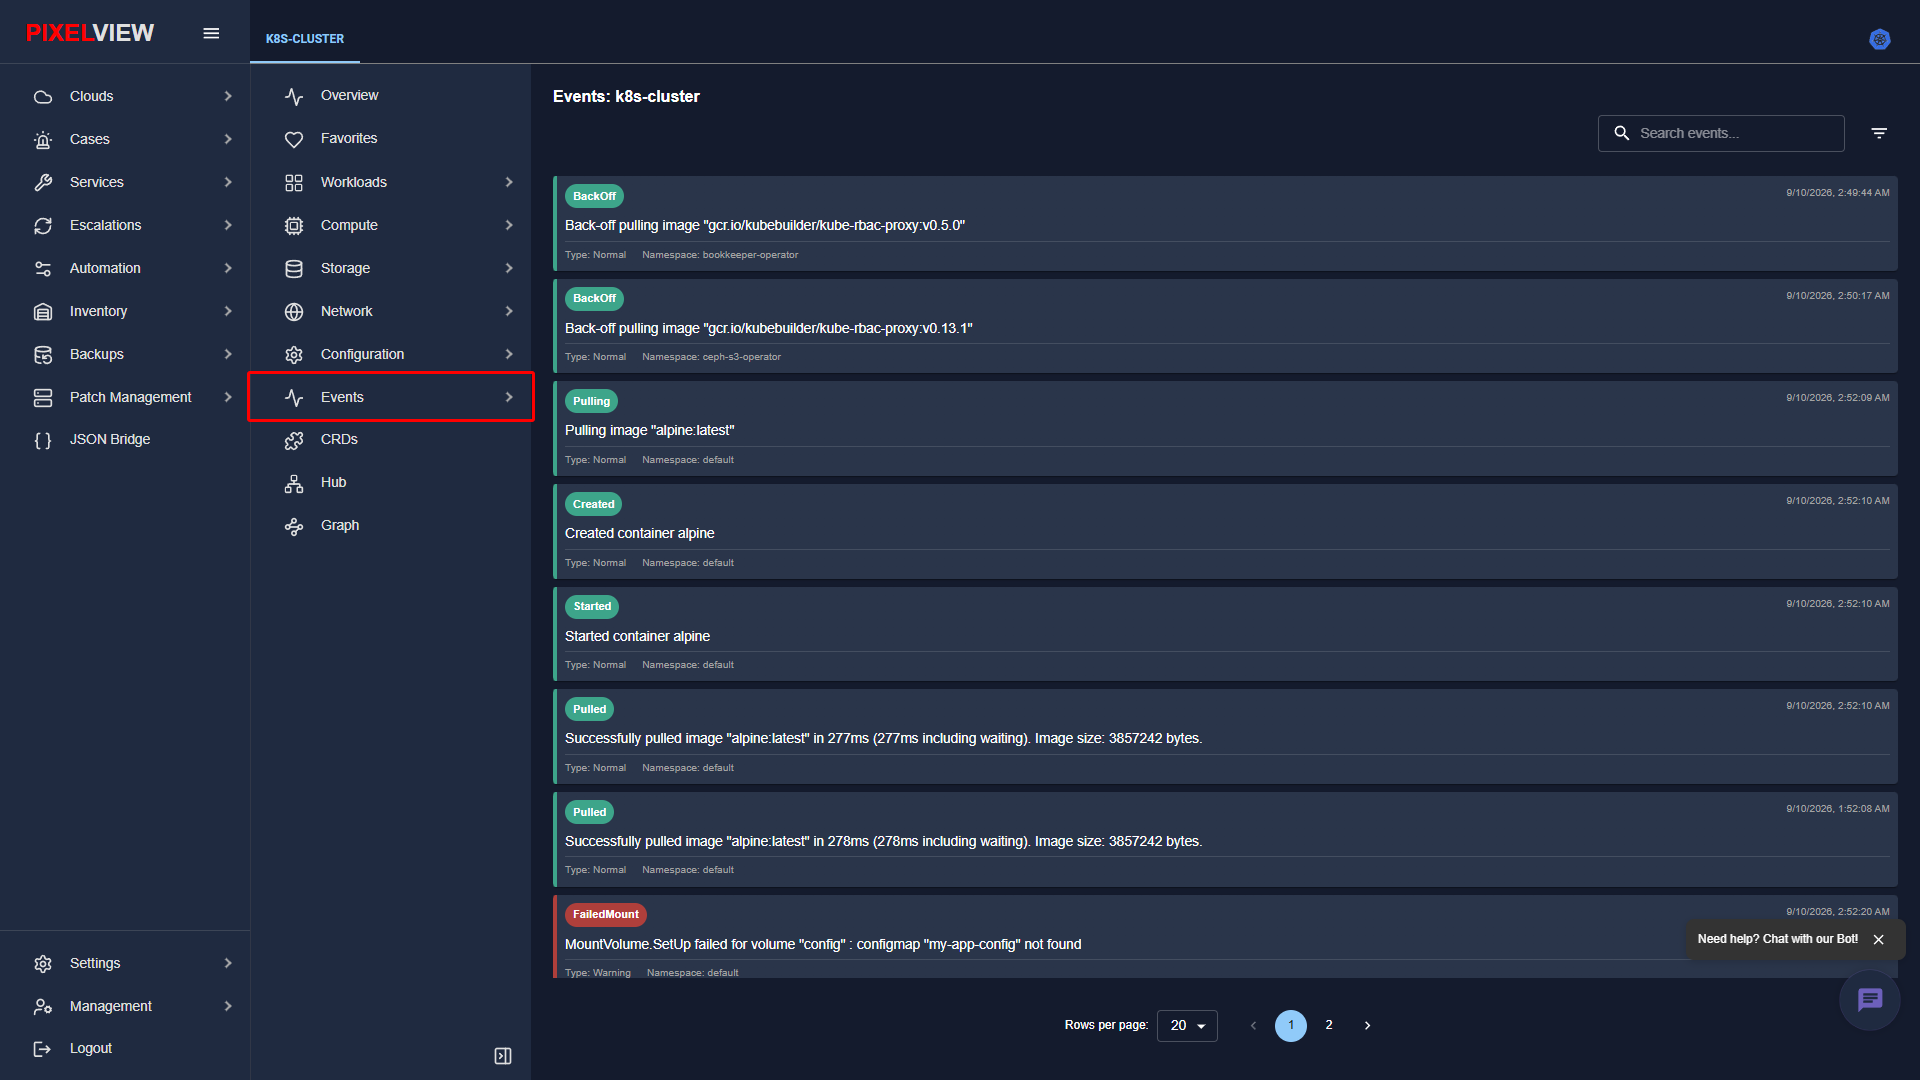
| Column | Description |
|---|---|
| Type | Severity level badge: Normal (routine state transitions such as scheduled pods, image pulls, and successful volume attachments) or Warning (actionable failures, crash loops, probe timeouts, failed scheduling). |
| Reason | Machine-readable error or action code (e.g., BackOff, Pulling, Created, FailedMount, NodeReady, Killing, FailedScheduling). |
| Message | Detailed human-readable explanation emitted by Kubelet, the scheduler, or controller managers detailing the root condition. |
| Object | Target Kubernetes resource kind and name (e.g., Pod/alpine-nginx, PersistentVolumeClaim/db-data, Node/worker-01). Clicking the object opens its resource inspection drawer. |
| Namespace | Scoped namespace where the event originated. Operators can filter across all namespaces or isolate individual tenant workloads. |
| Timestamp | Relative and absolute occurrence timestamp with aggregation counter (Count) showing how many times an identical event fired within the deduplication window. |
Event Retention & Ingestion Mechanics
- etcd Retention Window: Standard Kubernetes API servers retain events in etcd for 1 hour (
--event-ttl=1h0m0s). - PixelView Aggregated Stream: PixelView maintains a persistent operational event history, preventing critical diagnostic records from being lost during prolonged cluster outages or rolling node replacements.
- Severity Filtering: Operators can toggle the event stream filter between
All Events,Warnings Only, or filter by specific error reasons such asFailedSchedulingorUnhealthy.
Custom Resource Definitions (CRDs)
Custom Resource Definitions extend the Kubernetes API beyond built-in primitives, allowing operators and custom controllers to define specialized resources.
CRDs Table Overview
Navigate to CRDs in the secondary sidebar:
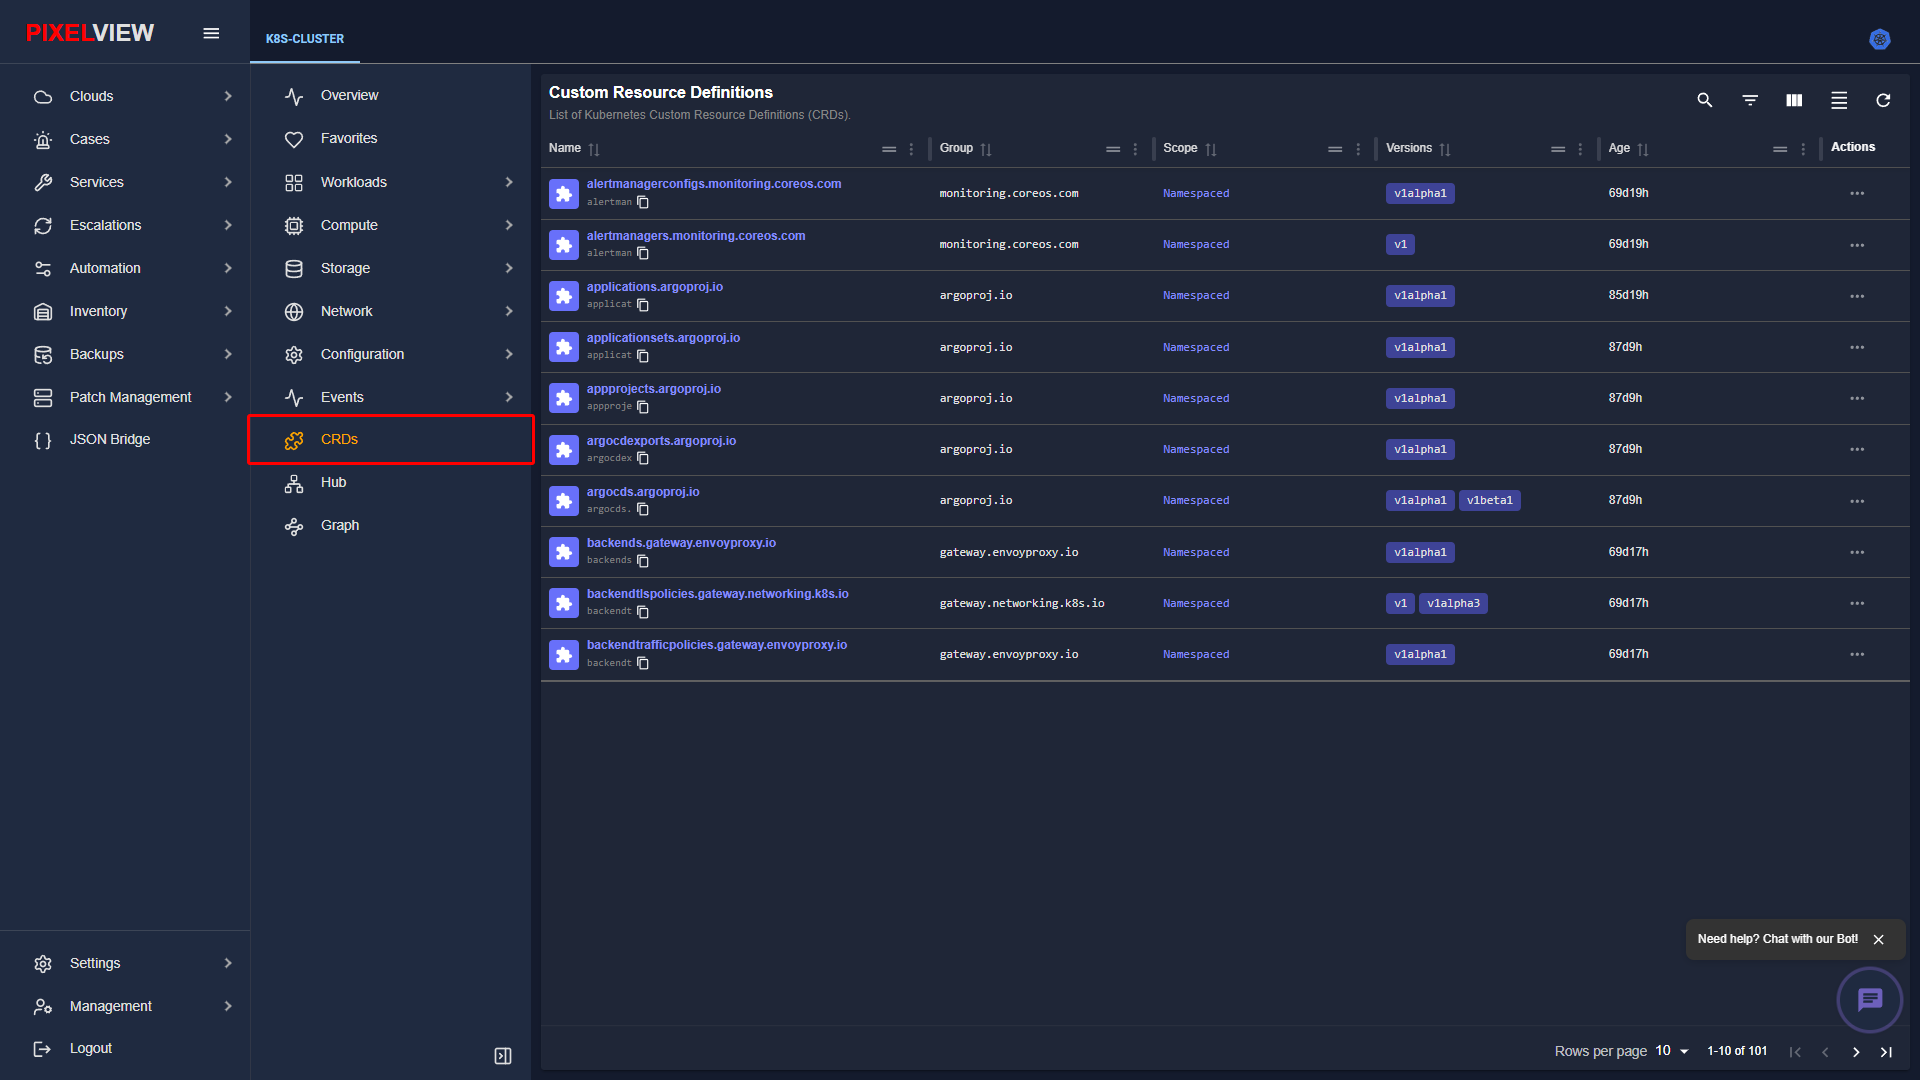
| Column | Description |
|---|---|
| Resource Name | Custom resource identifier and plural endpoint (e.g., certificates.cert-manager.io, virtualmachines.kubevirt.io). |
| Group | API group domain. |
| Version | Active API version (e.g., v1, v1alpha1). |
| Scope | Domain boundaries: Namespaced or Cluster. |
| Actions | View JSON/YAML schema definitions or inspect custom resource instances. |
CRD Deep-Dive & Schema Specification
Clicking any custom resource definition row in the table opens the dedicated CRD Details view (/kubernetes/:clusterName/crds/:crdName):
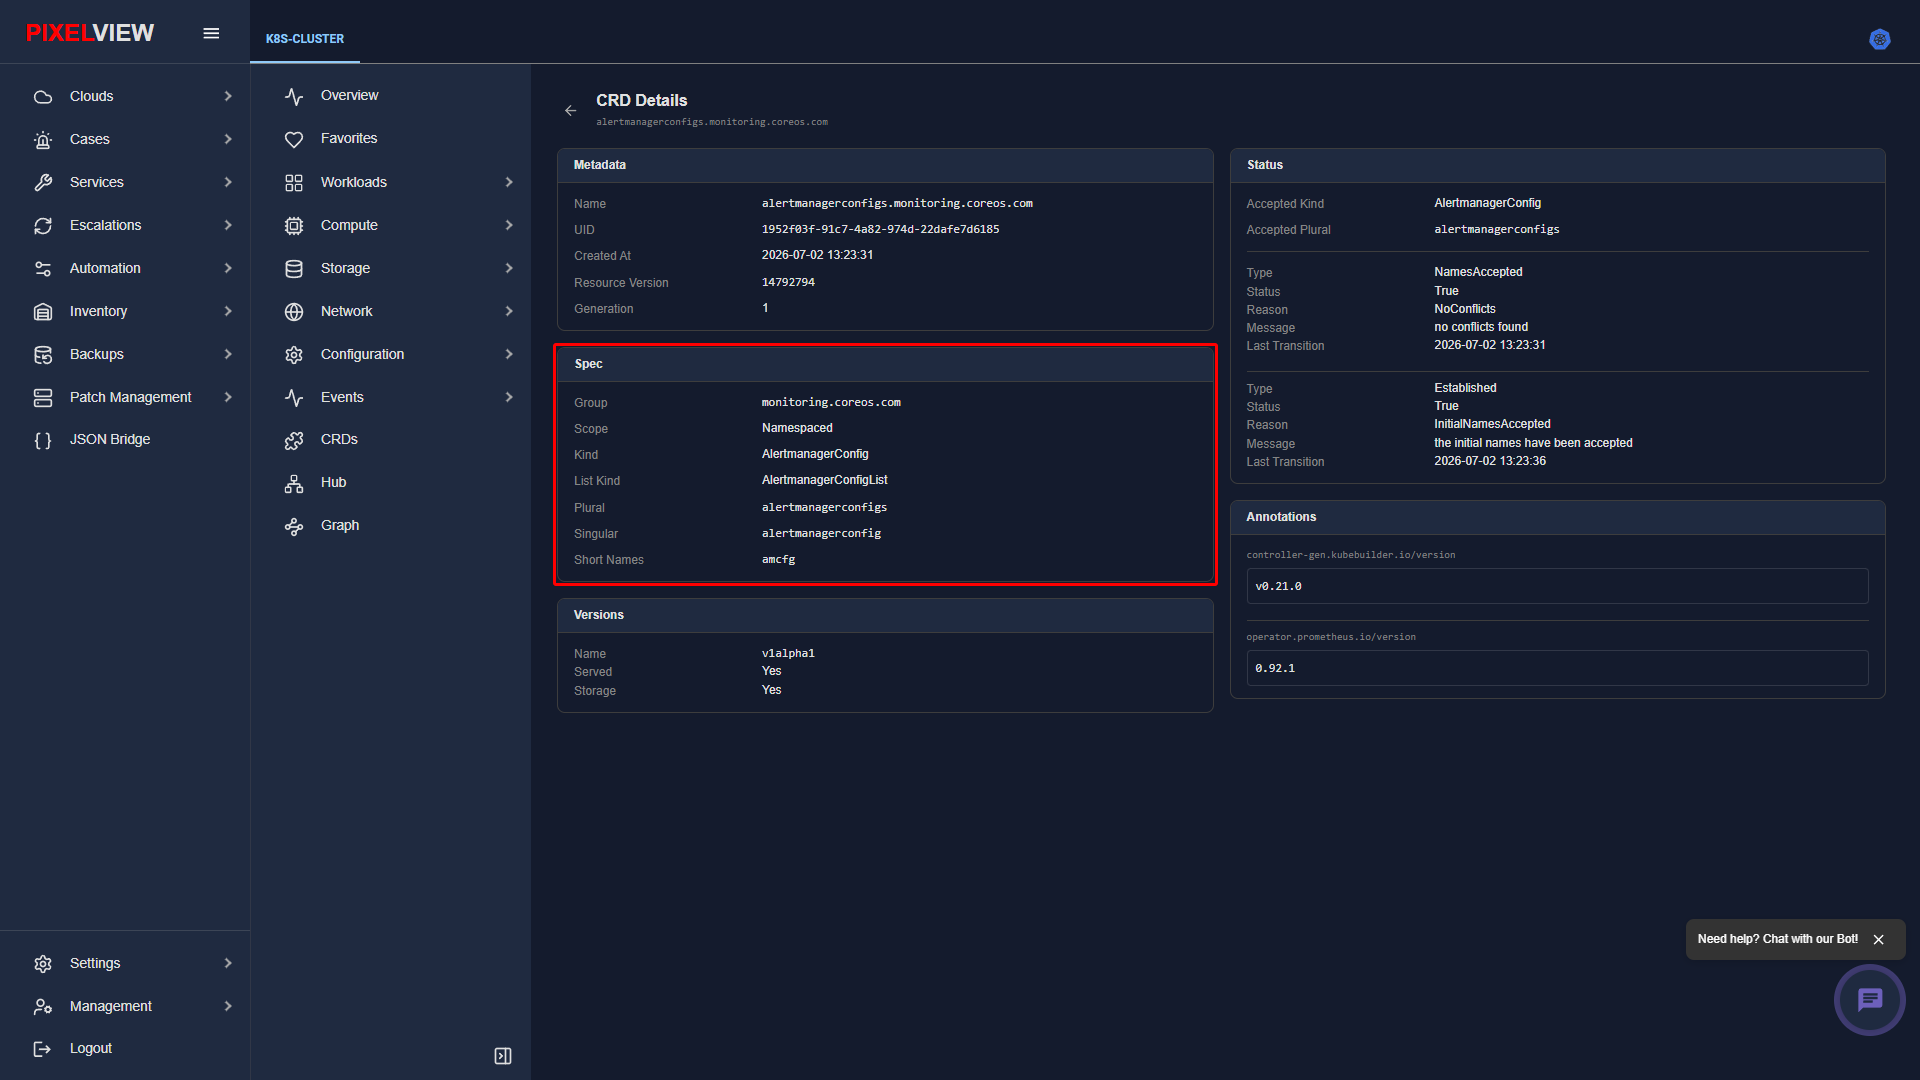
CRD Specification Cards
- Metadata: Resource Name (
alertmanagerconfigs.monitoring.coreos.com), UID, Creation timestamp, Resource Version, and Generation count. - Spec: API Group (
monitoring.coreos.com), Scope (Namespaced), Kind (AlertmanagerConfig), List Kind (AlertmanagerConfigList), Plural endpoint (alertmanagerconfigs), Singular name (alertmanagerconfig), and Short Names (amcfg). - Versions: Supported API versions (
v1alpha1), active served status (Yes), and persistent storage backend flag (Yes). - Status: Accepted Kind, Accepted Plural, Names Accepted status (
Truewithout naming conflicts), and Established readiness state (True). - Annotations: Controller generation toolchain tags (e.g.,
controller-gen.kubebuilder.io/version) and operator builder versioning metadata.
Hub (Application Manager & Operator Catalog)
The Hub (/kubernetes/:clusterName/hubs) serves as the integrated enterprise application marketplace and operator catalog for the cluster, providing one-click deployments of production-grade controllers, cloud provider integrations, databases, AI/machine learning toolchains, and observability stacks.
Application Manager & Catalog Overview
Navigate to Hub in the secondary sidebar:
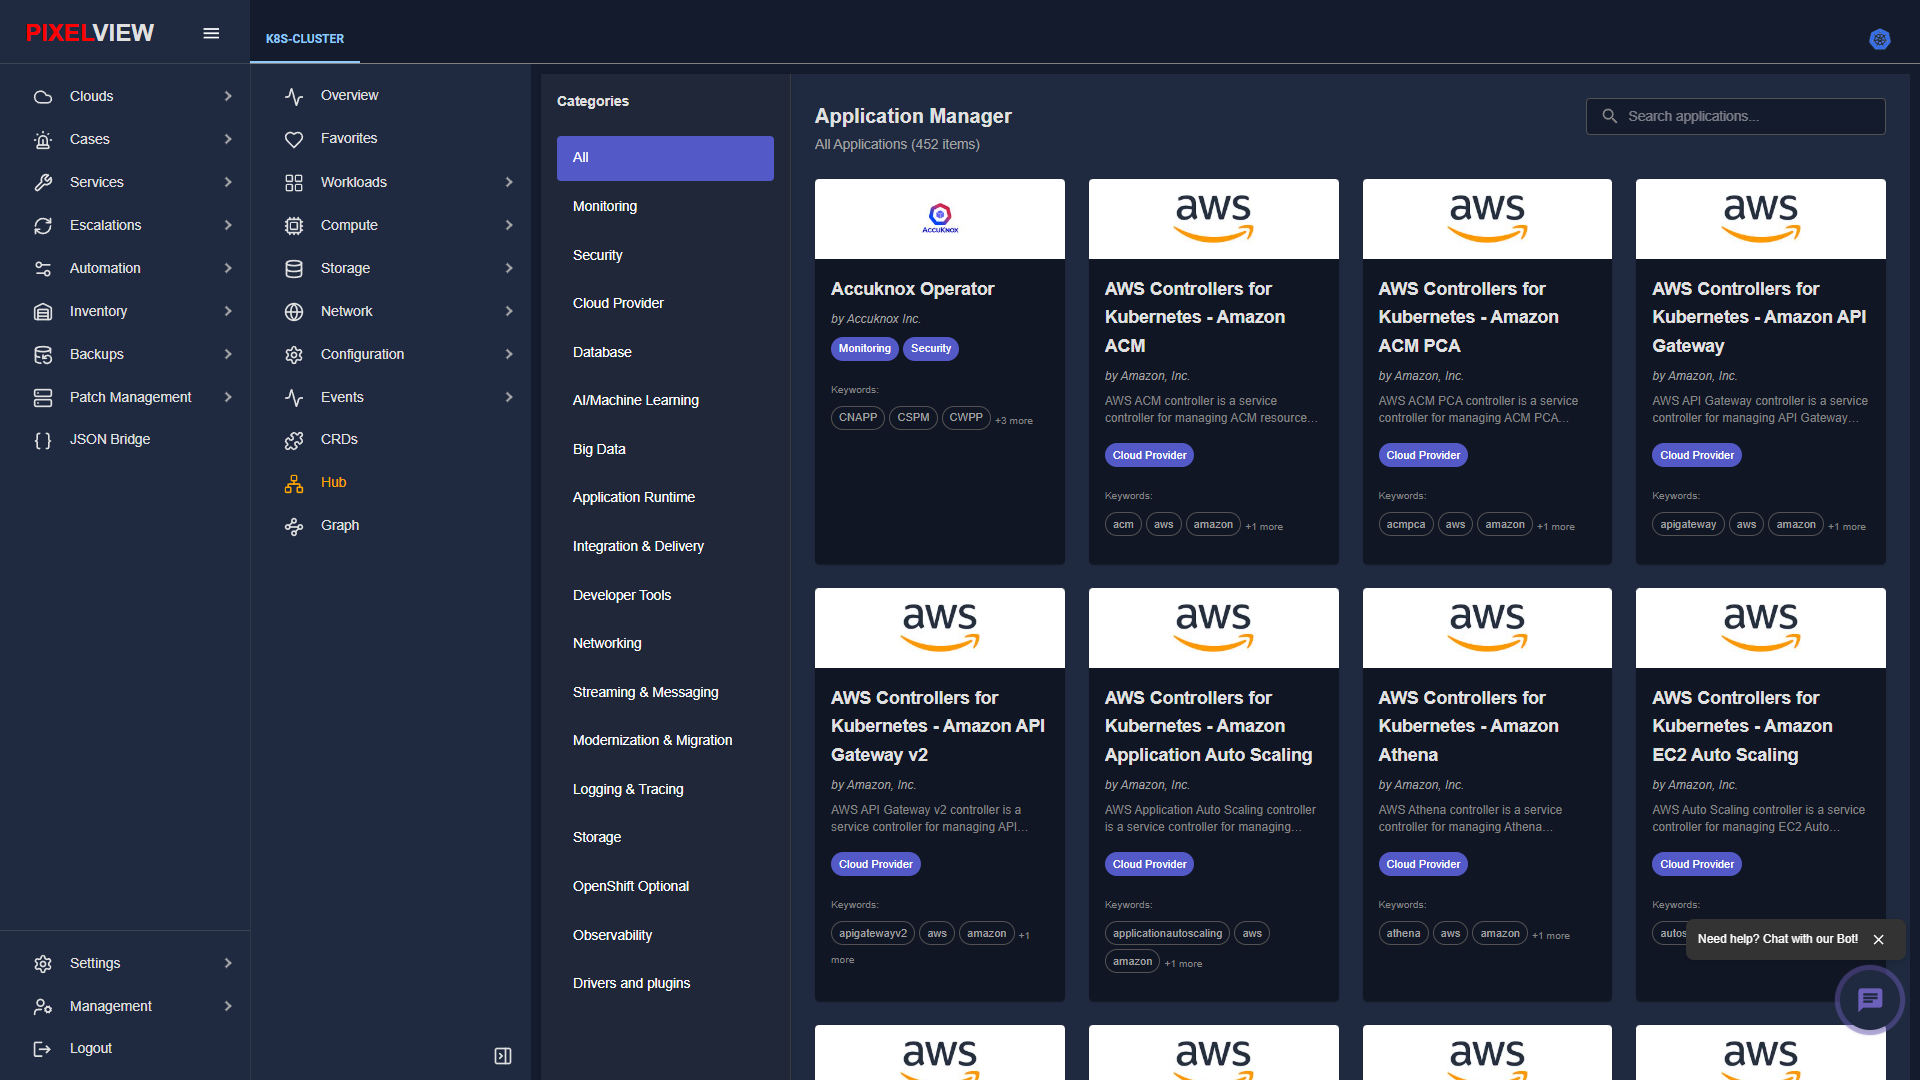
| Catalog Area | Description |
|---|---|
| Search & Filtering | Instant search bar (Search applications...) with categorized filtering across Monitoring, Security, Cloud Provider, Database, AI/Machine Learning, Developer Tools, and Networking. |
| Curated Operators | Pre-packaged Operator Lifecycle Manager (OLM) packages from OperatorHub and certified enterprise vendors (such as AWS Controllers for Kubernetes, Accuknox, ArgoCD, Cert-Manager). |
| One-Click Installation | Selecting any application card opens the automated installer drawer to configure target namespaces, installation modes, and subscription approval strategies. |
| Ecosystem Categories | Side-rail category browser facilitating rapid discovery of cluster runtime extensions and hardware drivers. |
Interactive Visual Graph Topology
The Graph view (/kubernetes/:clusterName/graph) provides an interactive real-time visual canvas depicting service relationships, pod connectivity, and Prometheus metric queries.
Graph Topology Canvas Overview
Navigate to Graph in the secondary sidebar:
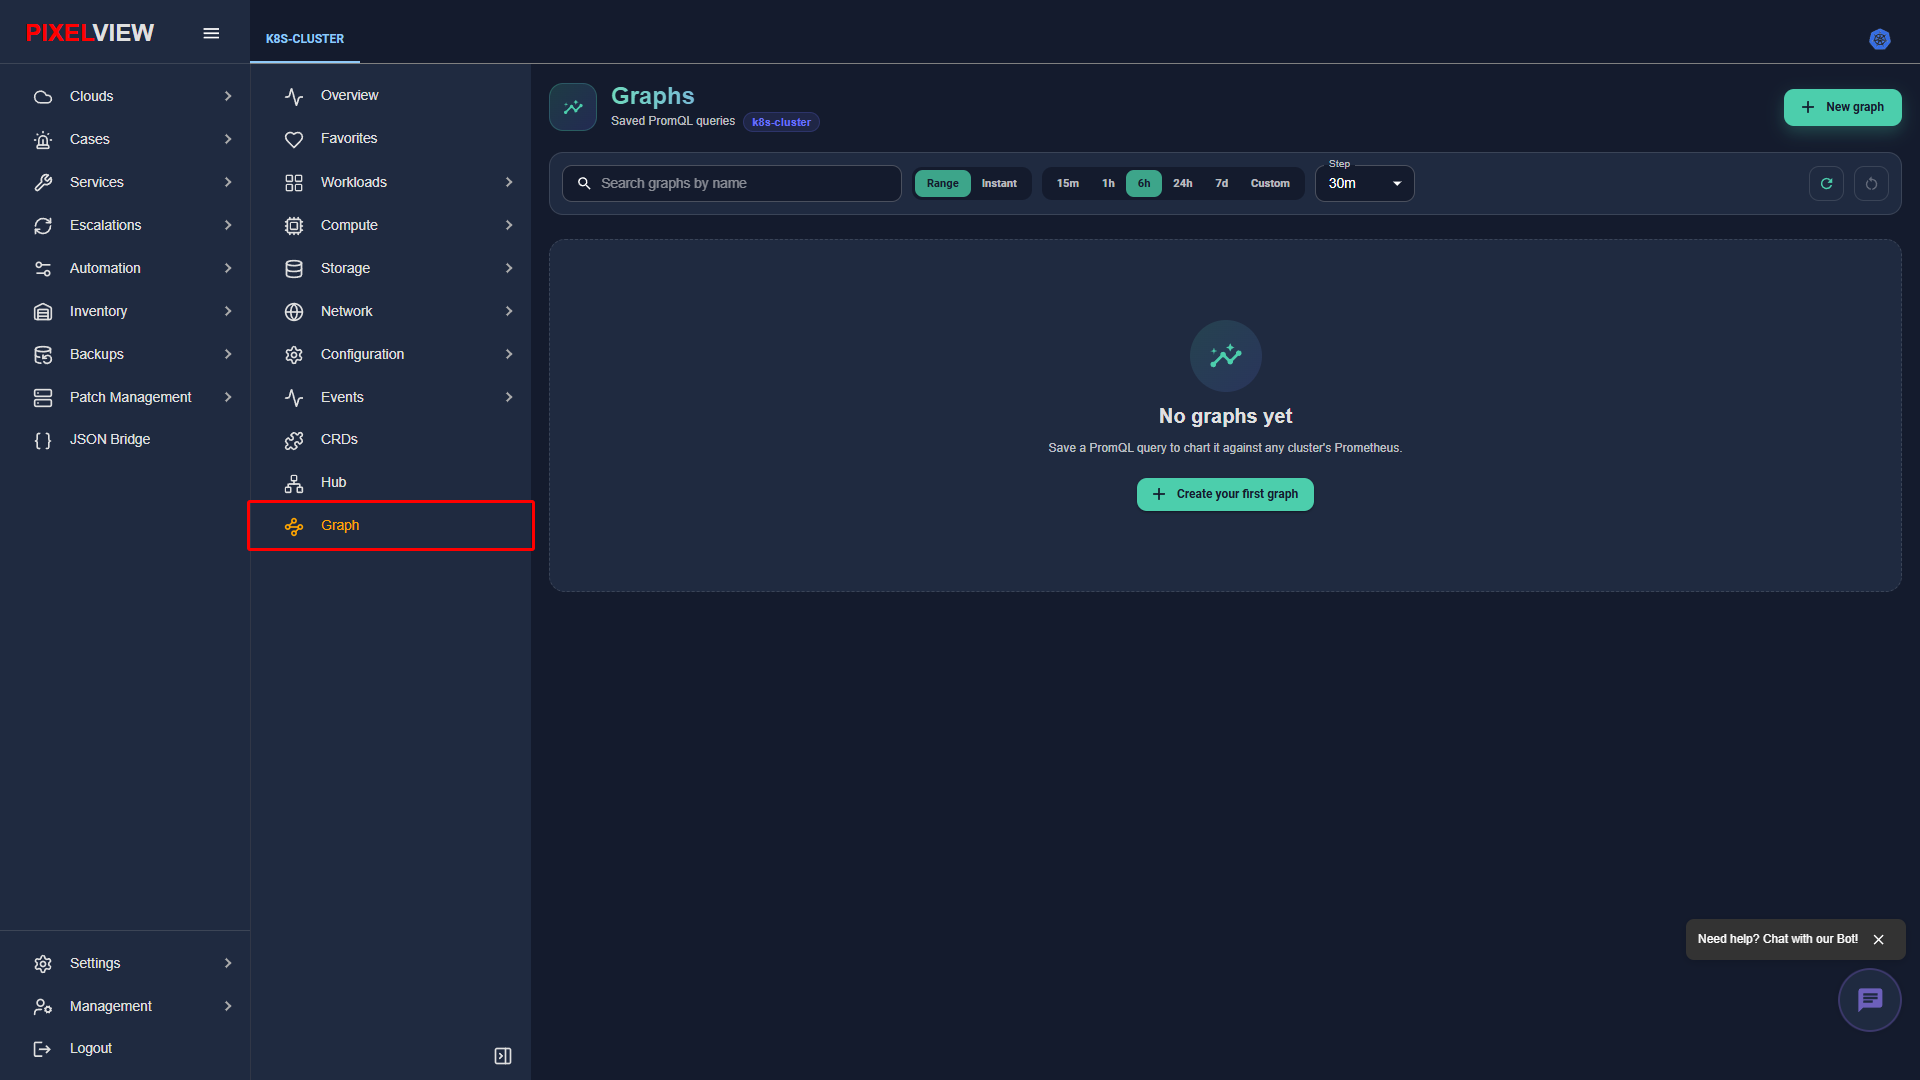
| Graph Control | Description |
|---|---|
| PromQL Query Input | Execute live Prometheus PromQL metric queries against cluster workloads. |
| Time Range Selector | Switch inspection windows between 15m, 1h, 6h, 24h, 7d, or custom ranges. |
| Step Resolution | Granular data resolution selector (1m, 5m, 30m). |
| Mode Toggle | Toggle between instantaneous point-in-time metrics (Instant) or historical trends (Range). |
| New Graph | Save custom performance graphs directly to cluster dashboards for persistent monitoring. |
Operational Best Practices & Troubleshooting
Workload Health Checklist
- Resource Requests & Limits: Always define explicit CPU and Memory
requestsandlimitsin container pod specifications to prevent uncontrolled memory exhaustion (OOMKilled) and ensure predictable node scheduling. - Probes Configuration: Configure both
livenessProbe(to automatically restart hung containers) andreadinessProbe(to prevent unready pods from receiving client traffic via Services). - Multi-Replica High Availability: Avoid single-replica Deployments for production services; configure at least 2 or 3 replicas with Pod Disruption Budgets (PDB) to safeguard availability during node drains.
- Pod Anti-Affinity: Use
podAntiAffinityrules to guarantee redundant deployment pods are scheduled across separate physical nodes.
Troubleshooting Common Workload States
| State / Condition | Root Cause | Recommended Resolution |
|---|---|---|
CrashLoopBackOff |
Application process crashes immediately after starting due to missing configuration, bad command arguments, or missing secrets. | Inspect container output via Actions → View Logs. Verify environment variables in ConfigMaps and Secrets. |
ErrImagePull / ImagePullBackOff |
Container image repository URL is invalid, image tag does not exist, or private registry credentials (imagePullSecrets) are missing. |
Check image URL spelling and tag. Ensure an imagePullSecrets Secret of type kubernetes.io/dockerconfigjson is attached to the pod or service account. |
Pending Pod State |
Cluster worker nodes lack sufficient allocatable CPU or Memory to satisfy pod requests, or node taints prevent scheduling. | Review cluster capacity in the Cluster Overview. Inspect node allocatable limits or add additional worker nodes. |
FailedMount Warning |
Pod references a PersistentVolumeClaim, ConfigMap, or Secret that does not exist or has not yet bound. | Check Events Stream for exact missing volume reference. Verify target ConfigMap or Secret exists in the same namespace. |
OOMKilled (Exit Code 137) |
Container memory consumption exceeded the hard limits.memory defined in the pod specification. |
Review memory trend graphs. Increase container memory limit or profile application for memory leaks. |
Node NotReady |
Node kubelet stopped responding, Docker/containerd runtime crashed, or host network disconnected. | Inspect node status under Compute → Nodes. Check kubelet systemd service logs and verify network connectivity between node and control plane. |
Diagnostic Workflow for CrashLoopBackOff
When an application container repeatedly crashes after startup, follow this diagnostic runbook:
* Check Exit Codes:
* Exit Code 0: The container finished its primary process successfully but had no foreground task keeping it alive (common in batch scripts or misconfigured web servers).
* Exit Code 1: General application error, such as an unhandled runtime exception or syntax fault.
* Exit Code 137: The container was terminated by SIGKILL (almost always an out-of-memory OOMKilled event).
* Exit Code 143: The container was gracefully terminated by SIGTERM (e.g., during pod eviction or deployment rollout).
* Inspect Previous Container Logs:
* In the PixelView console, navigate to Workloads → Pods → select target Pod → click Actions → View Logs.
* Check the Previous Instance checkbox to inspect output generated immediately before the last crash.
* Review Environment Configuration:
* Cross-reference referenced ConfigMaps and Secrets to ensure all required environment keys exist and are populated.
Diagnostic Workflow for OOMKilled Containers
When a container exceeds its allocated memory ceiling:
* Examine Memory Consumption Trends:
* Navigate to Workloads → Pods → select Pod → open the Metrics tab.
* Correlate memory spikes with specific application requests or traffic surges.
* Tune Memory Requests and Limits:
* Edit the workload specification: increase spec.containers[*].resources.limits.memory by 25% to 50% to accommodate peak working sets.
* Ensure requests.memory matches the expected steady-state baseline to guarantee the pod is scheduled on nodes with sufficient headroom.
* Profile Memory Leaks:
* If memory utilization increases monotonically over time without plateauing, initiate memory heap dump profiling in the application runtime.
Diagnostic Workflow for Storage Volume Mounting Failures
When a pod remains stuck in ContainerCreating with FailedMount or FailedAttachVolume:
* Inspect PersistentVolumeClaim (PVC) Status:
* Navigate to Storage → Persistent Volume Claims.
* Verify that the PVC status is Bound. If Pending, inspect whether the target StorageClass provisioner is active or if volume quotas are exceeded.
* Resolve Multi-Attach Conflicts (ReadWriteOnce):
* If a PVC is formatted with ReadWriteOnce access mode, it can only attach to a single worker node simultaneously.
* If the pod was rescheduled to a new node before the previous node released the volume attachment, wait for the volume detach timeout or drain the stale node.
Diagnostic Workflow for Gateway API and Ingress Routing
When incoming traffic fails to reach backend pods:
* Verify Service Endpoints:
* In Networking → Services, verify that the target Service has active healthy Endpoints. If Endpoints are 0, verify that the Service selector labels exactly match the Pod labels.
* Inspect Route Status:
* In Networking → Gateway → HTTPRoutes, inspect the Accepted and Programmed conditions.
* Ensure the route references a valid Gateway listener port and valid hostname match rules.
* Verify TLS Certificate Validity:
* Inspect the referenced Secret in Configuration → Secrets to verify that the TLS certificate has not expired and covers the requested SNI hostname.