Resolved Cases
The Resolved Cases section (/resolved-cases) under Cases serves as PixelView's persistent incident archive and operational retrospective console.
Once an incident in Open Cases or My Cases is resolved—either manually by an on-call engineer or automatically via a self-healing Automation Rule—it transitions into this repository. Teams use Resolved Cases for root cause analysis (RCA), compliance and SLA auditing, recurring pattern detection, and reopening prematurely closed alerts.
Navigating to Resolved Cases
To review resolved incidents and historical post-mortems:
- In the left navigation sidebar under Cases, click Resolved Cases:
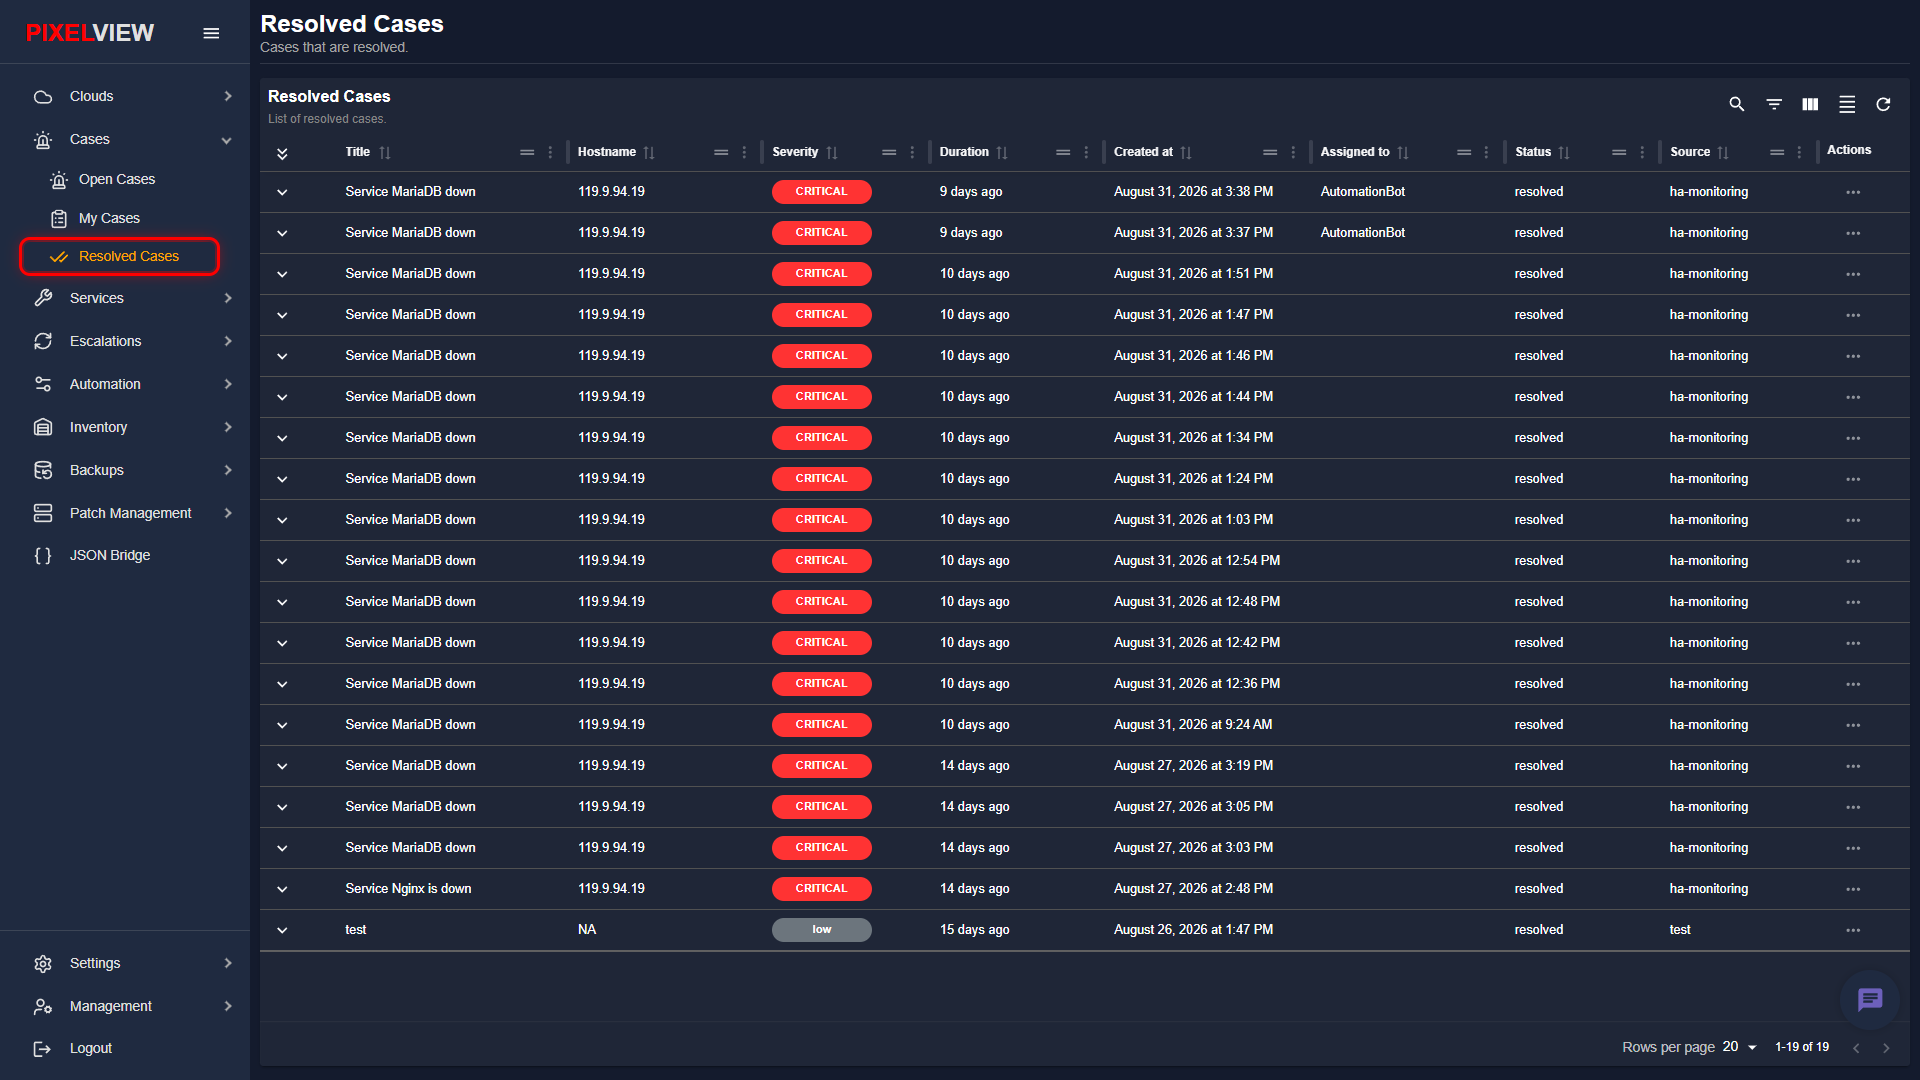
Resolved Cases Table Overview
The table displays all closed incidents with 60-second automatic background polling:
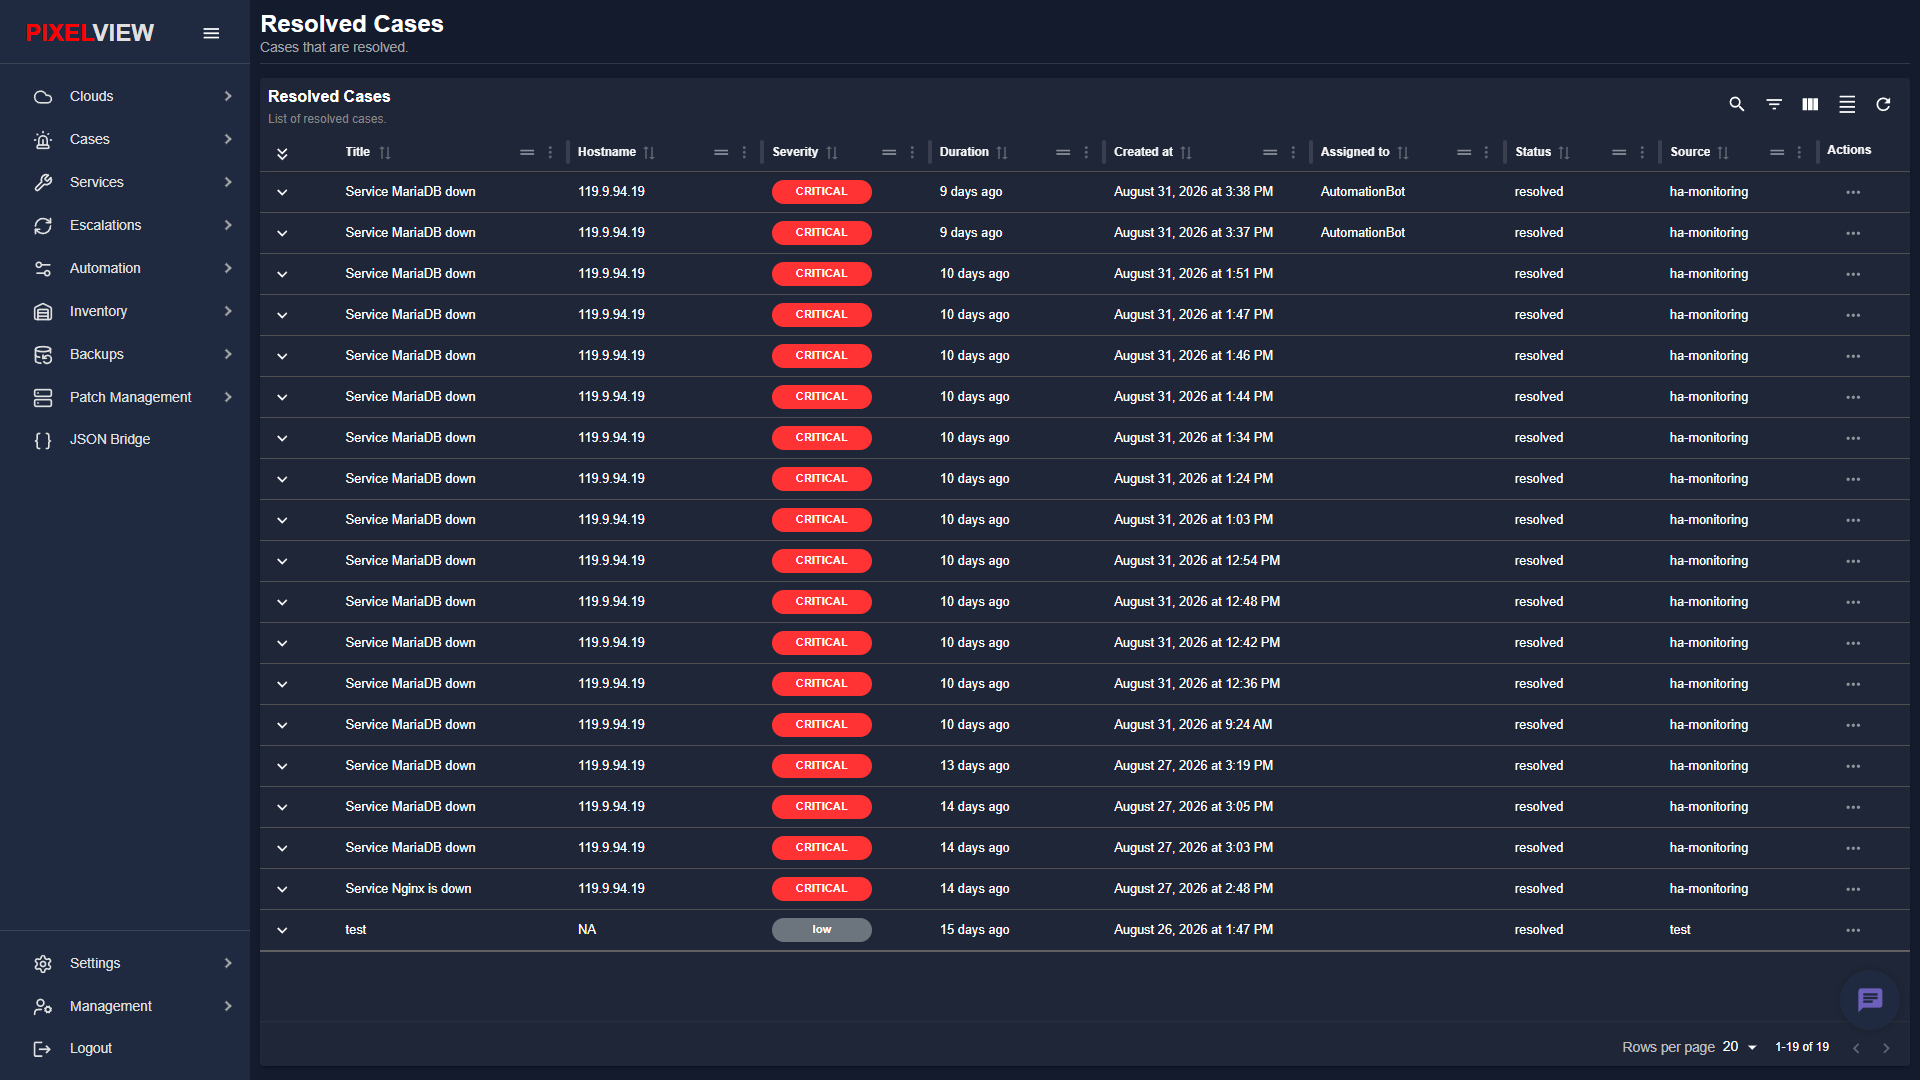
| Column | Description |
|---|---|
Expand (v) |
Chevron toggle that expands the row to inspect comments and resolution notes inline. |
| Title | The incident summary or headline (e.g., Service MariaDB down). Clicking the title opens the complete historical case console. |
| Hostname | Affected infrastructure node IP or FQDN (e.g., 119.9.94.19). |
| Severity | Peak incident severity recorded during the outage (CRITICAL in red, HIGH in orange, MEDIUM in yellow, LOW in blue). |
| Duration | Elapsed time since the incident was initially triggered (e.g., 9 days ago). |
| Created at | Creation timestamp recording when the monitoring alert was captured. |
| Assigned to | The final operator or automated bot that remediated the incident (e.g., Admin). |
| Status | Operational status confirming the case is resolved. |
| Source | Originating monitoring provider or integration (e.g., ha-monitoring). |
| Actions | Row context menu (...) providing quick actions. |
- Selecting a case row highlights the incident:
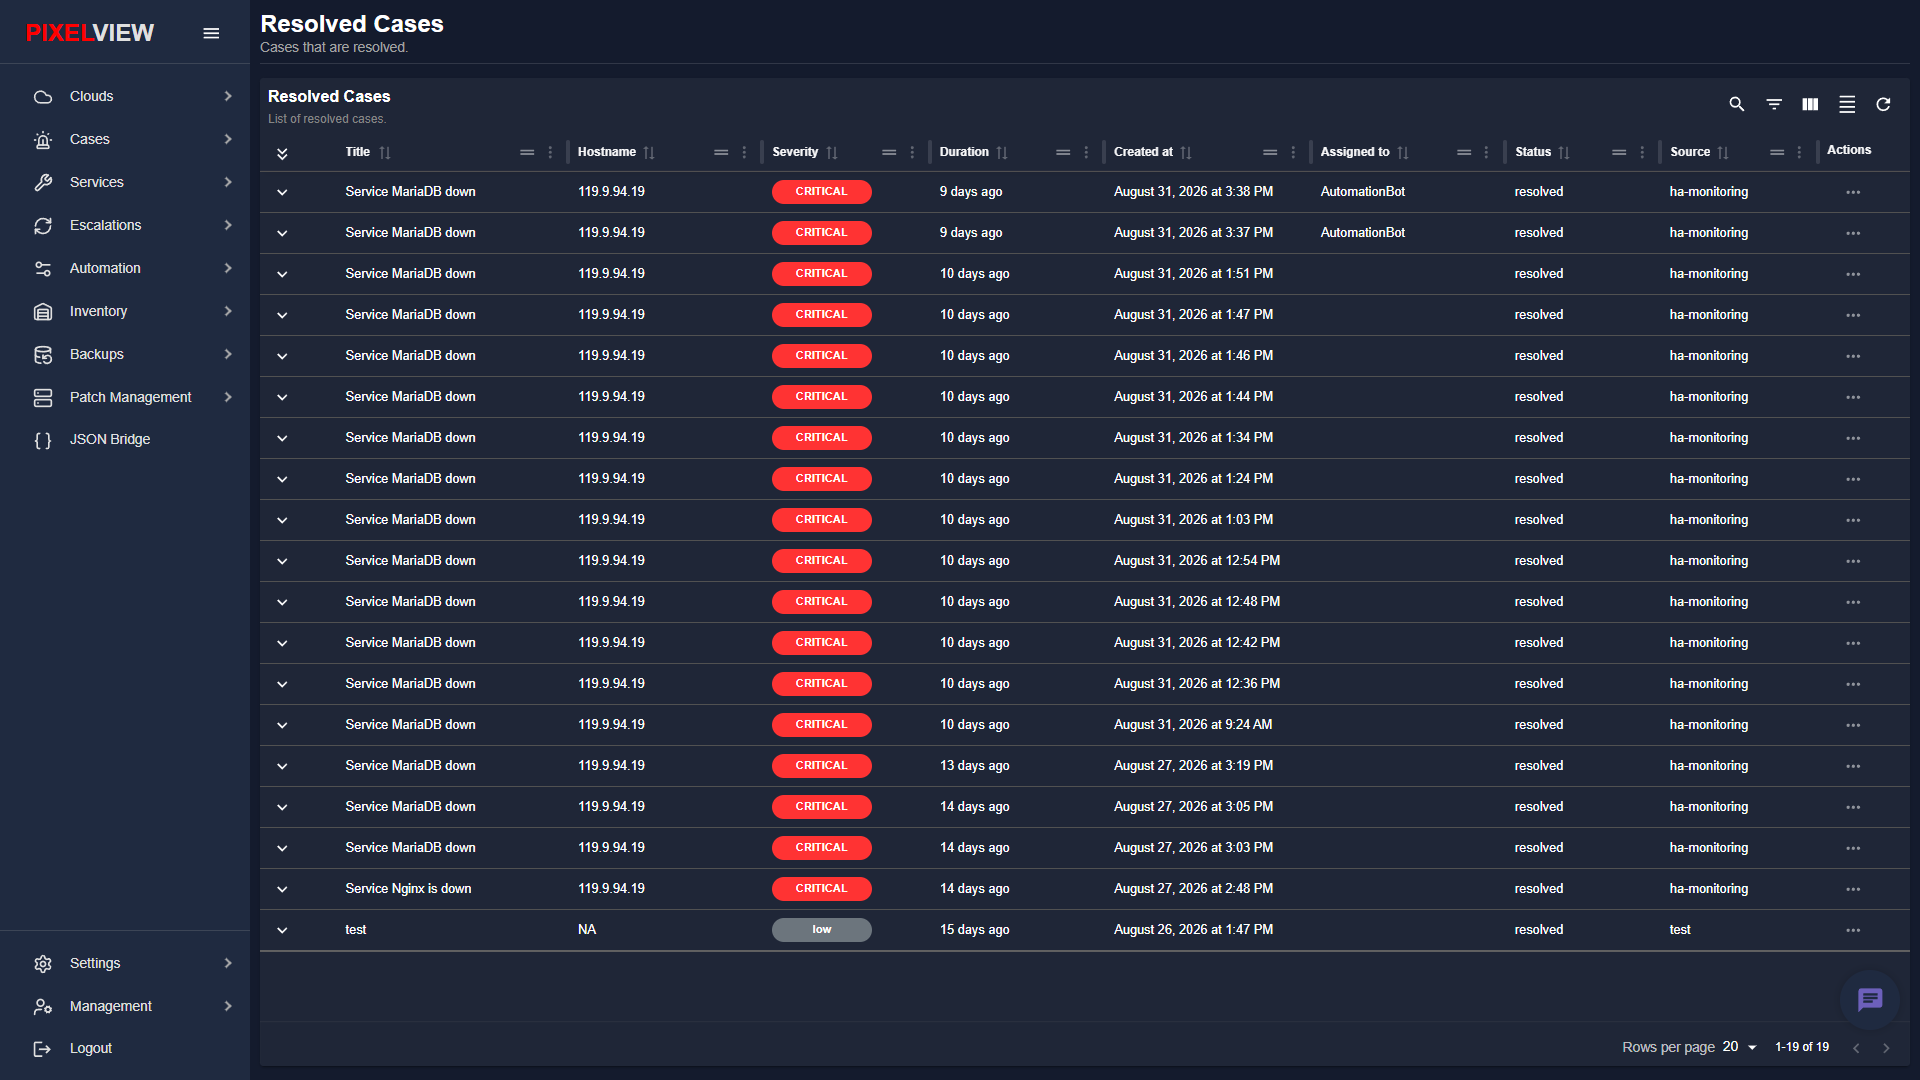
Table Toolbar Controls
- Search / Global Filter: Perform queries across resolved incident titles, hostnames, and sources.
- Column Filters: Filter historical incidents by severity tier or creation date.
- Show/Hide Columns: Customize table column visibility to focus on desired metrics.
- Density Toggle: Switch between compact and spacious row height.
- Refresh: Query the backend API for the latest resolved cases.
Re-Opening a Case
If an issue reoccurs after initial mitigation, or if an alert was closed prematurely before verification, engineers can reopen the incident immediately.
PixelView provides two straightforward workflows to reopen a resolved case:
Reopening via Row Context Menu
- Click the Actions menu (
...) on any resolved case row:
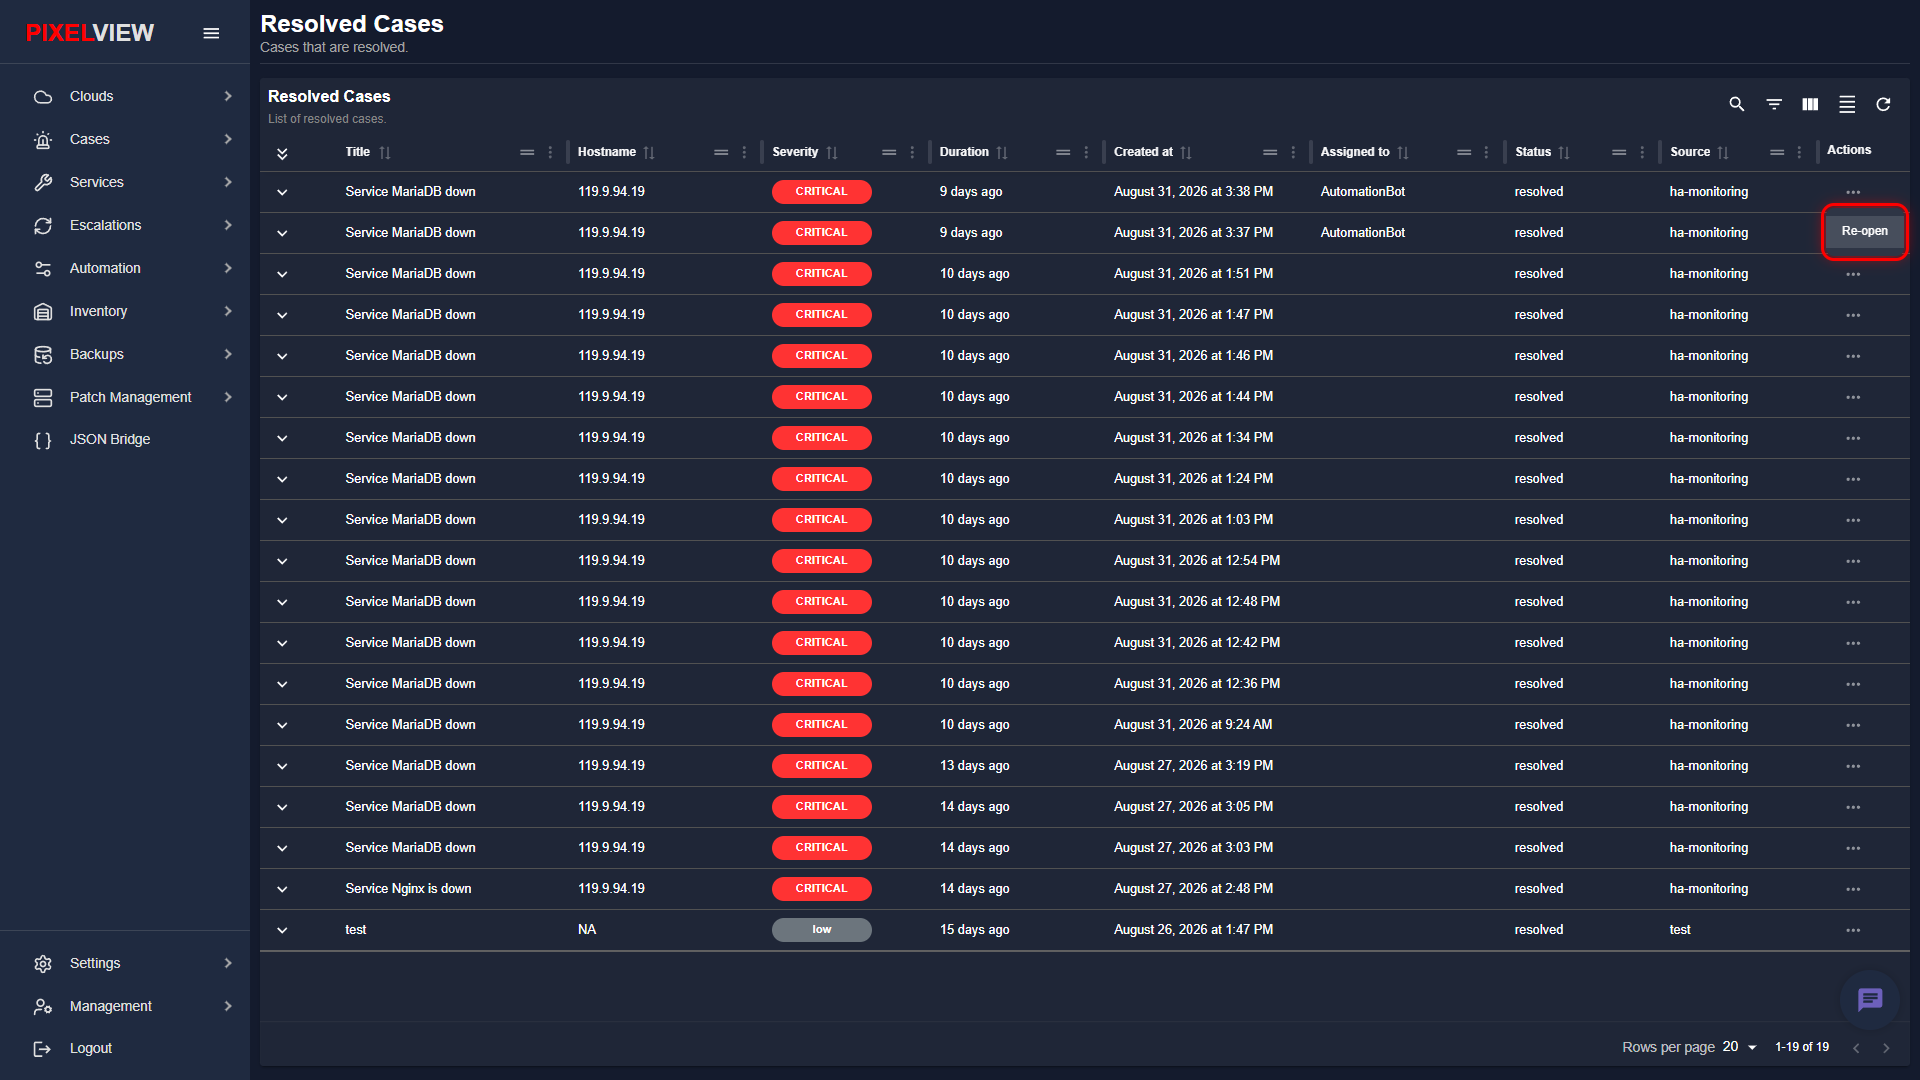
- Click Re-open.
Reopening via Case Dashboard Header
- Click into any resolved case to open its detailed investigation dashboard.
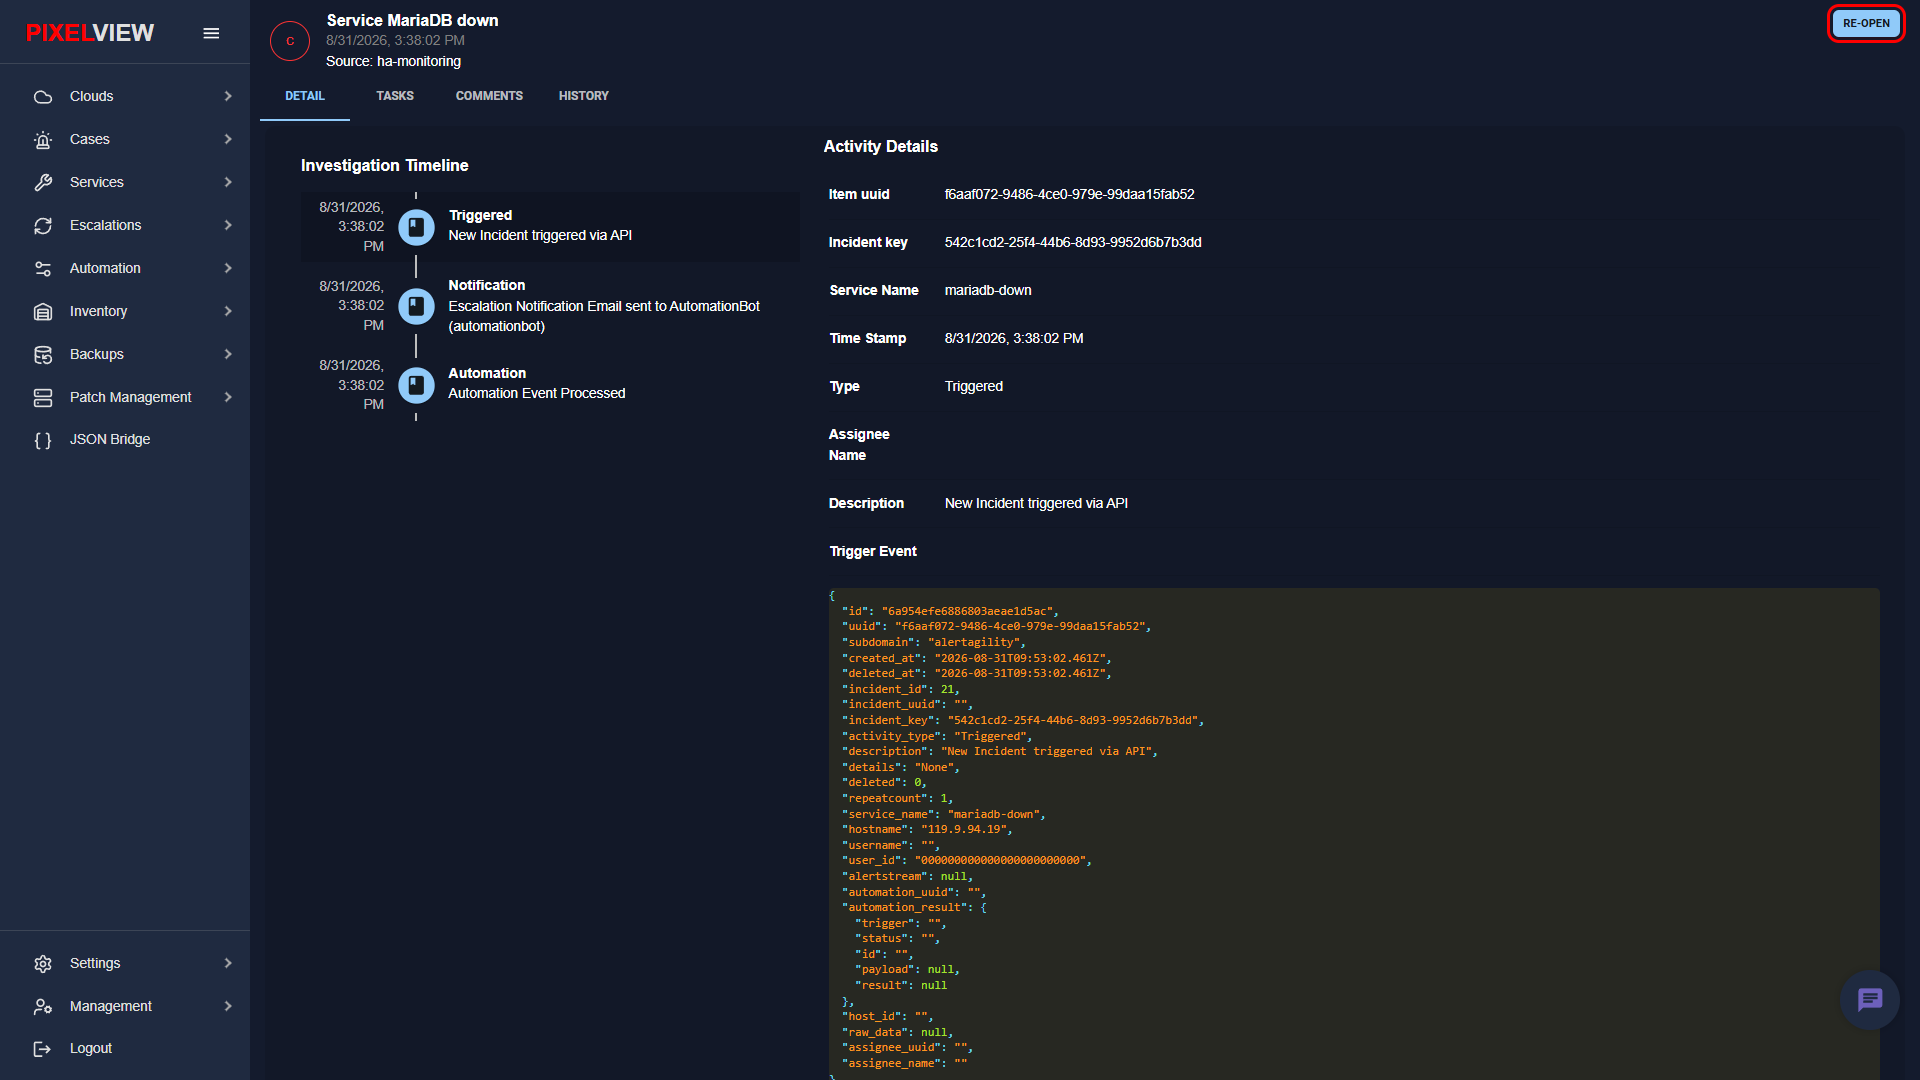
- Click the blue RE-OPEN button in the upper-right corner of the header:
Note
Reopening a case transitions its operational status back to triggered or open, immediately restoring it to the active triage queue in Open Cases and notifying assigned responders.
Historical Retrospective & Audit Console (/case/:id)
Clicking any resolved case title opens its full post-mortem console. Responders can review the complete timeline of actions taken during the outage across four dedicated tabs:
Detail Tab: Telemetry & Timeline Audit
The DETAIL tab preserves the immutable chronological timeline of the incident:
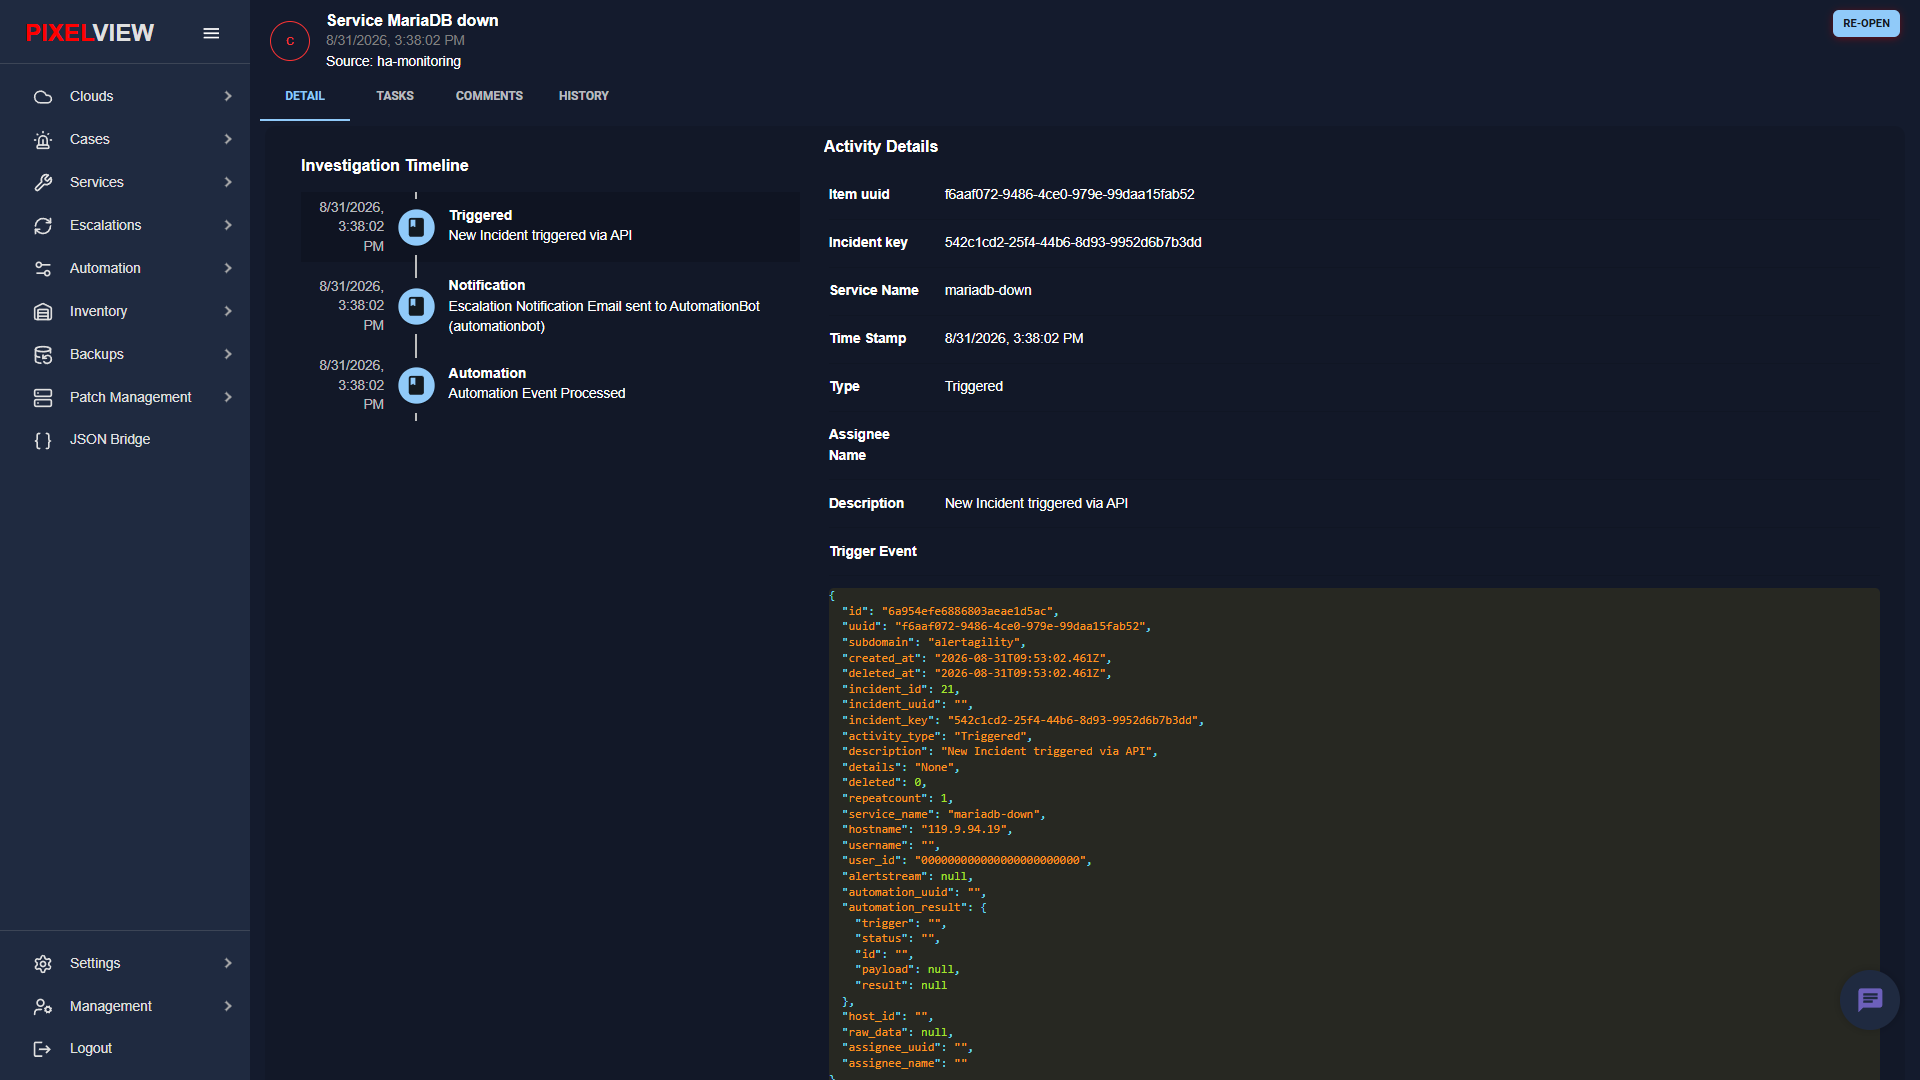
- Investigation Timeline: Review each step of the resolution lifecycle—from initial alert ingest (
Triggered), email/chat dispatches (Notification), automated playbook execution (Automation), to sub-task completions. - Activity Details: Reference key incident identifiers (Item UUID, Incident Key, Service Name, and timestamps).
- Trigger Event: Inspect the exact JSON telemetry received from the monitoring provider at the moment the outage occurred.
Tasks Tab: Action Item Audit
The TASKS tab displays all sub-tasks and checklists that were assigned and completed during remediation:
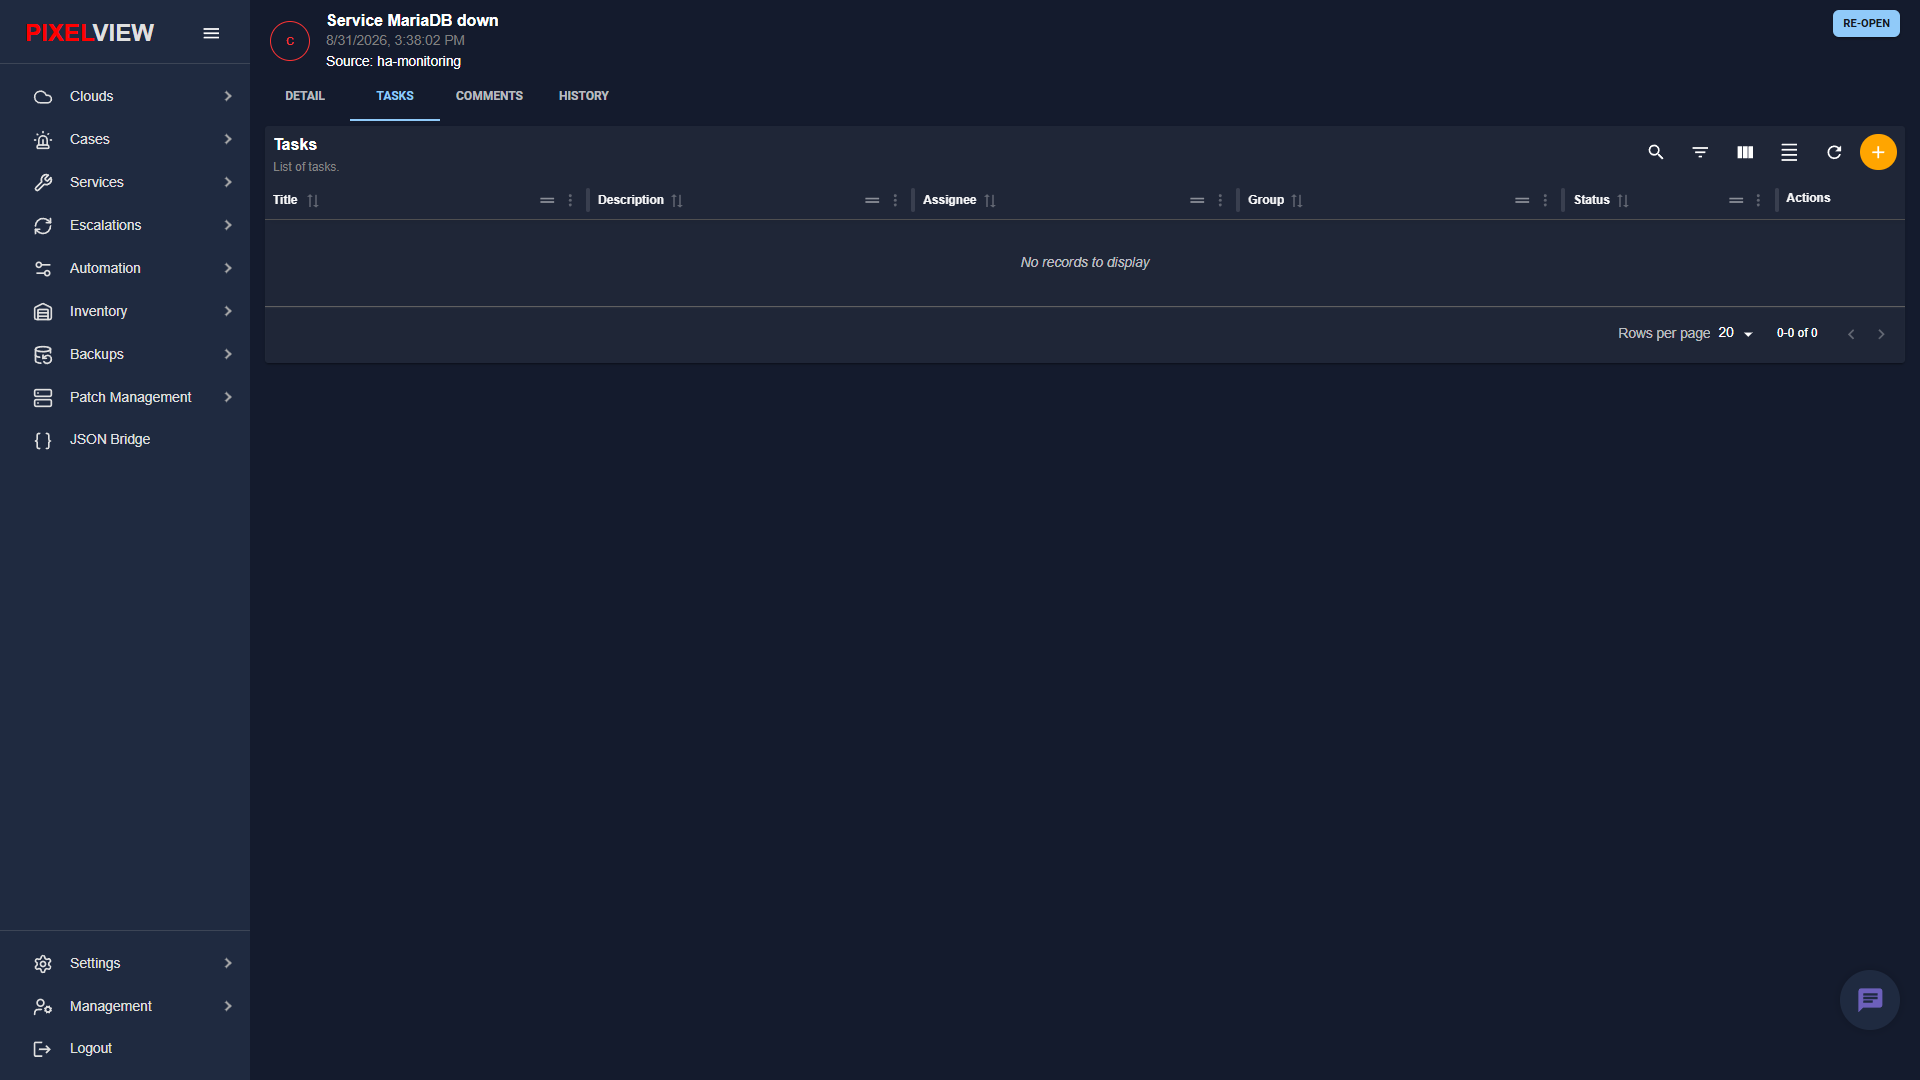
- Provides operational accountability by showing which engineer or group handled specific recovery steps.
- Retains completed checklist records for SLA compliance verification.
Comments Tab: Resolution Notes & Post-Mortem
The COMMENTS tab preserves the collaborative chat thread between operators, DBAs, and management:
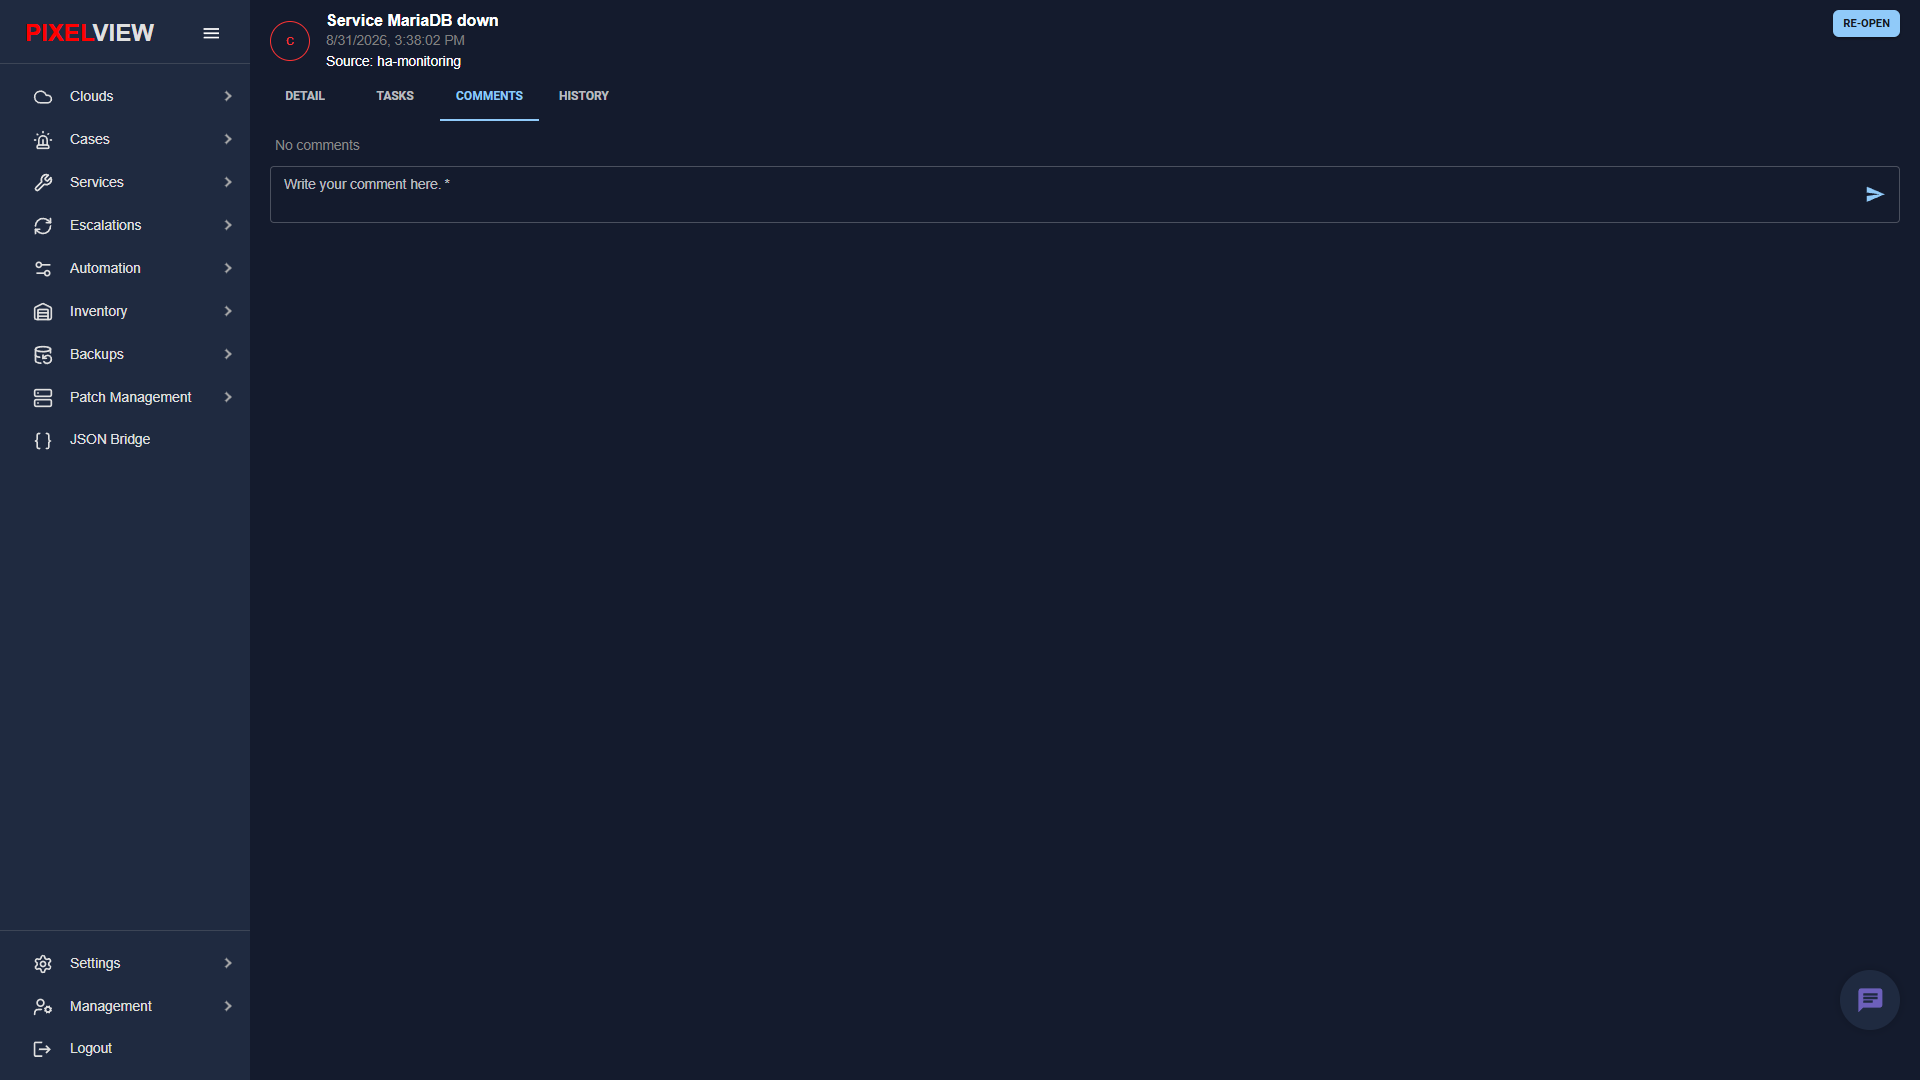
- Review root cause hypotheses, terminal logs, and final handover summaries.
- Operators can continue posting follow-up post-mortem notes and recommendations even after the case is closed.
History Tab: Host Pattern Correlation
The HISTORY tab displays all historical alerts that have occurred on the same infrastructure node:
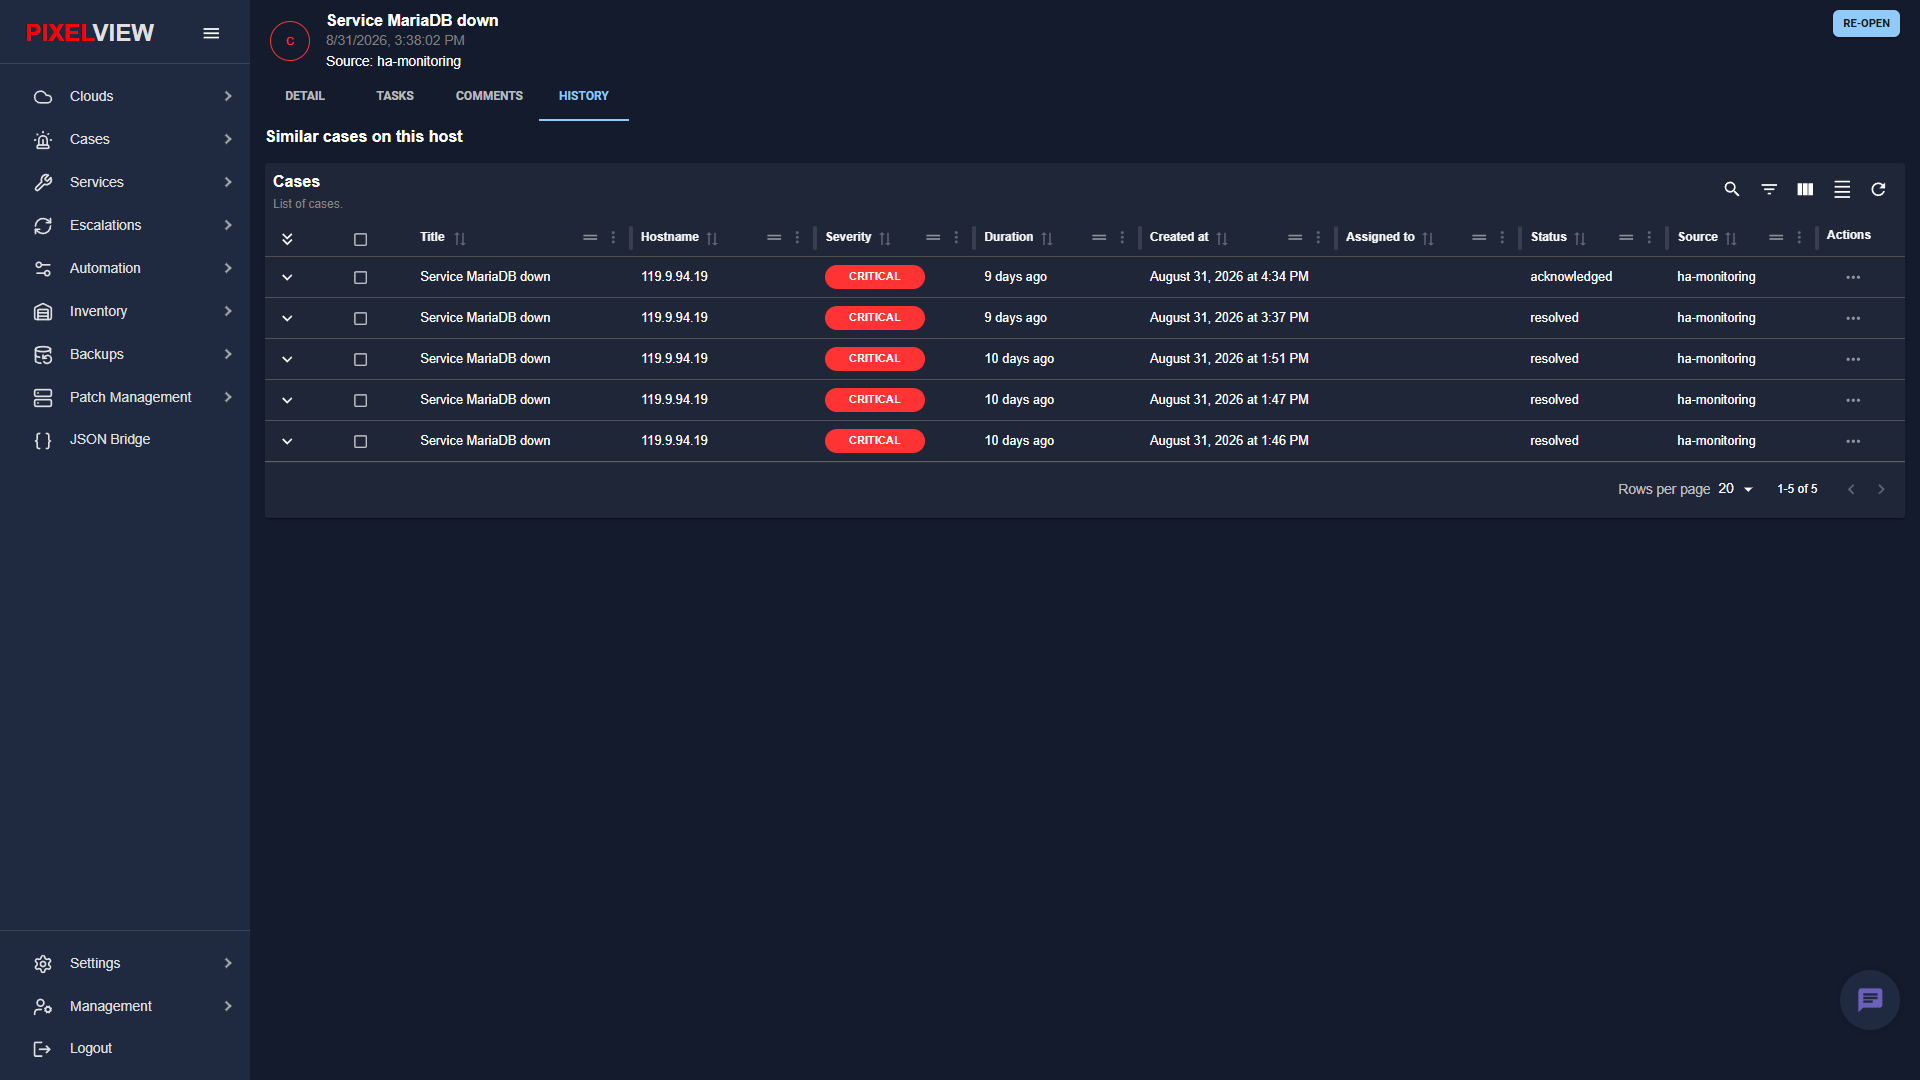
- Similar cases on this host: Shows past alerts for the current node (
119.9.94.19), allowing reliability engineers to track recurring degradation, service flap frequencies, and verify whether a permanent fix has stabilized the host over time.
Post-Incident Reviews (PIR) & Compliance Auditing
The archive preserved within Resolved Cases forms the foundation for continuous service improvement and regulatory compliance:
- SLA & MTTR Auditing: Track duration metrics from initial detection timestamp to final resolution, measuring team adherence to defined SLA commitments across critical, high, and moderate priority incidents.
- Chronic Flapping Detection: Use the HISTORY tab to identify repeat failures on identical hosts, surfacing chronic hardware degradation, memory leaks, or recurring configuration regressions.
- Immutable Audit Retention: All case metadata—including raw JSON webhook triggers, timestamped task assignments, collaborative operator comments, and automated bot dispatch logs—are immutably preserved for SOC 2, ISO 27001, and regulatory compliance reviews.