My Cases
The My Cases section (/my-cases) under Cases provides a personalized incident workbench for engineers and operators in PixelView.
Unlike the global queue in Open Cases, this view automatically filters active alerts down to only those incidents explicitly assigned to the authenticated user or their delegated teams. Responders use this dedicated workspace to focus on their active workload, track personal response times, and drive assigned issues to resolution.
Navigating to My Cases
To access your assigned incidents:
- In the left navigation sidebar under Cases, click My Cases:
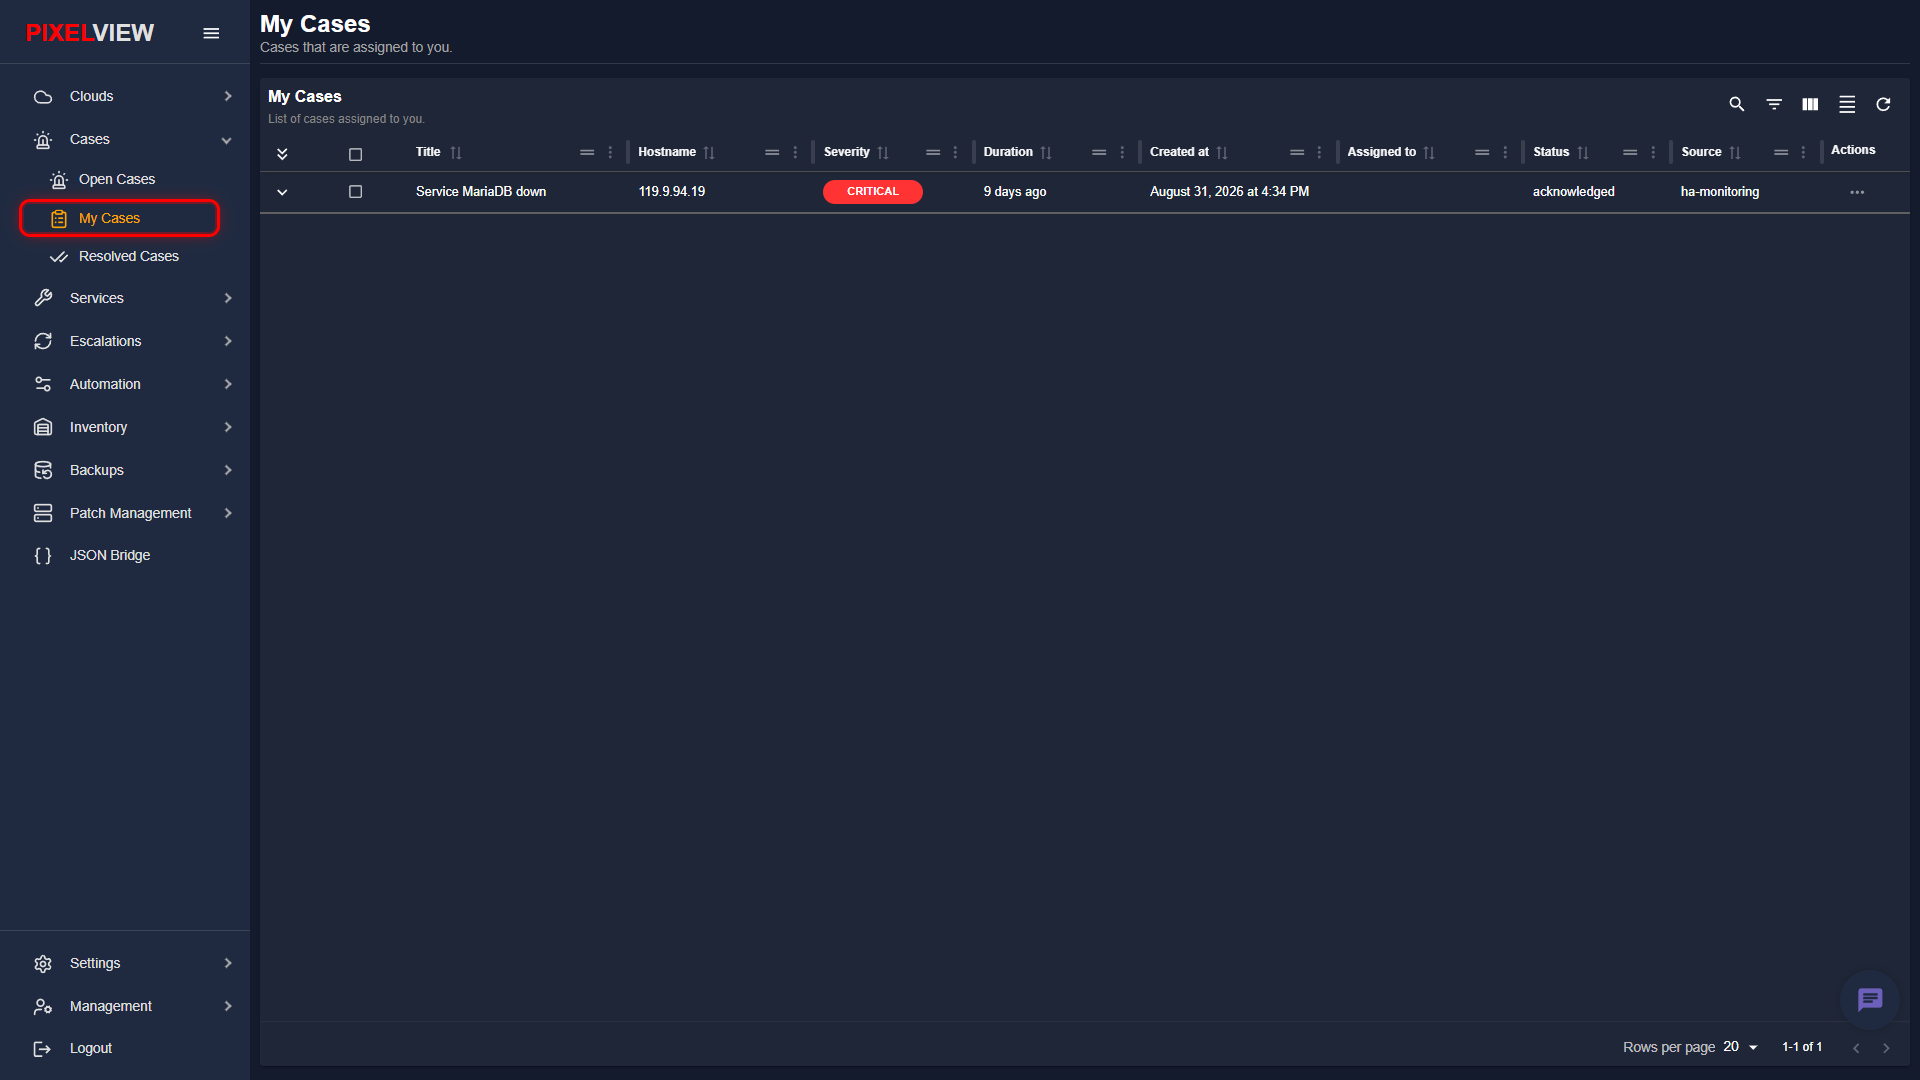
My Cases Table Overview
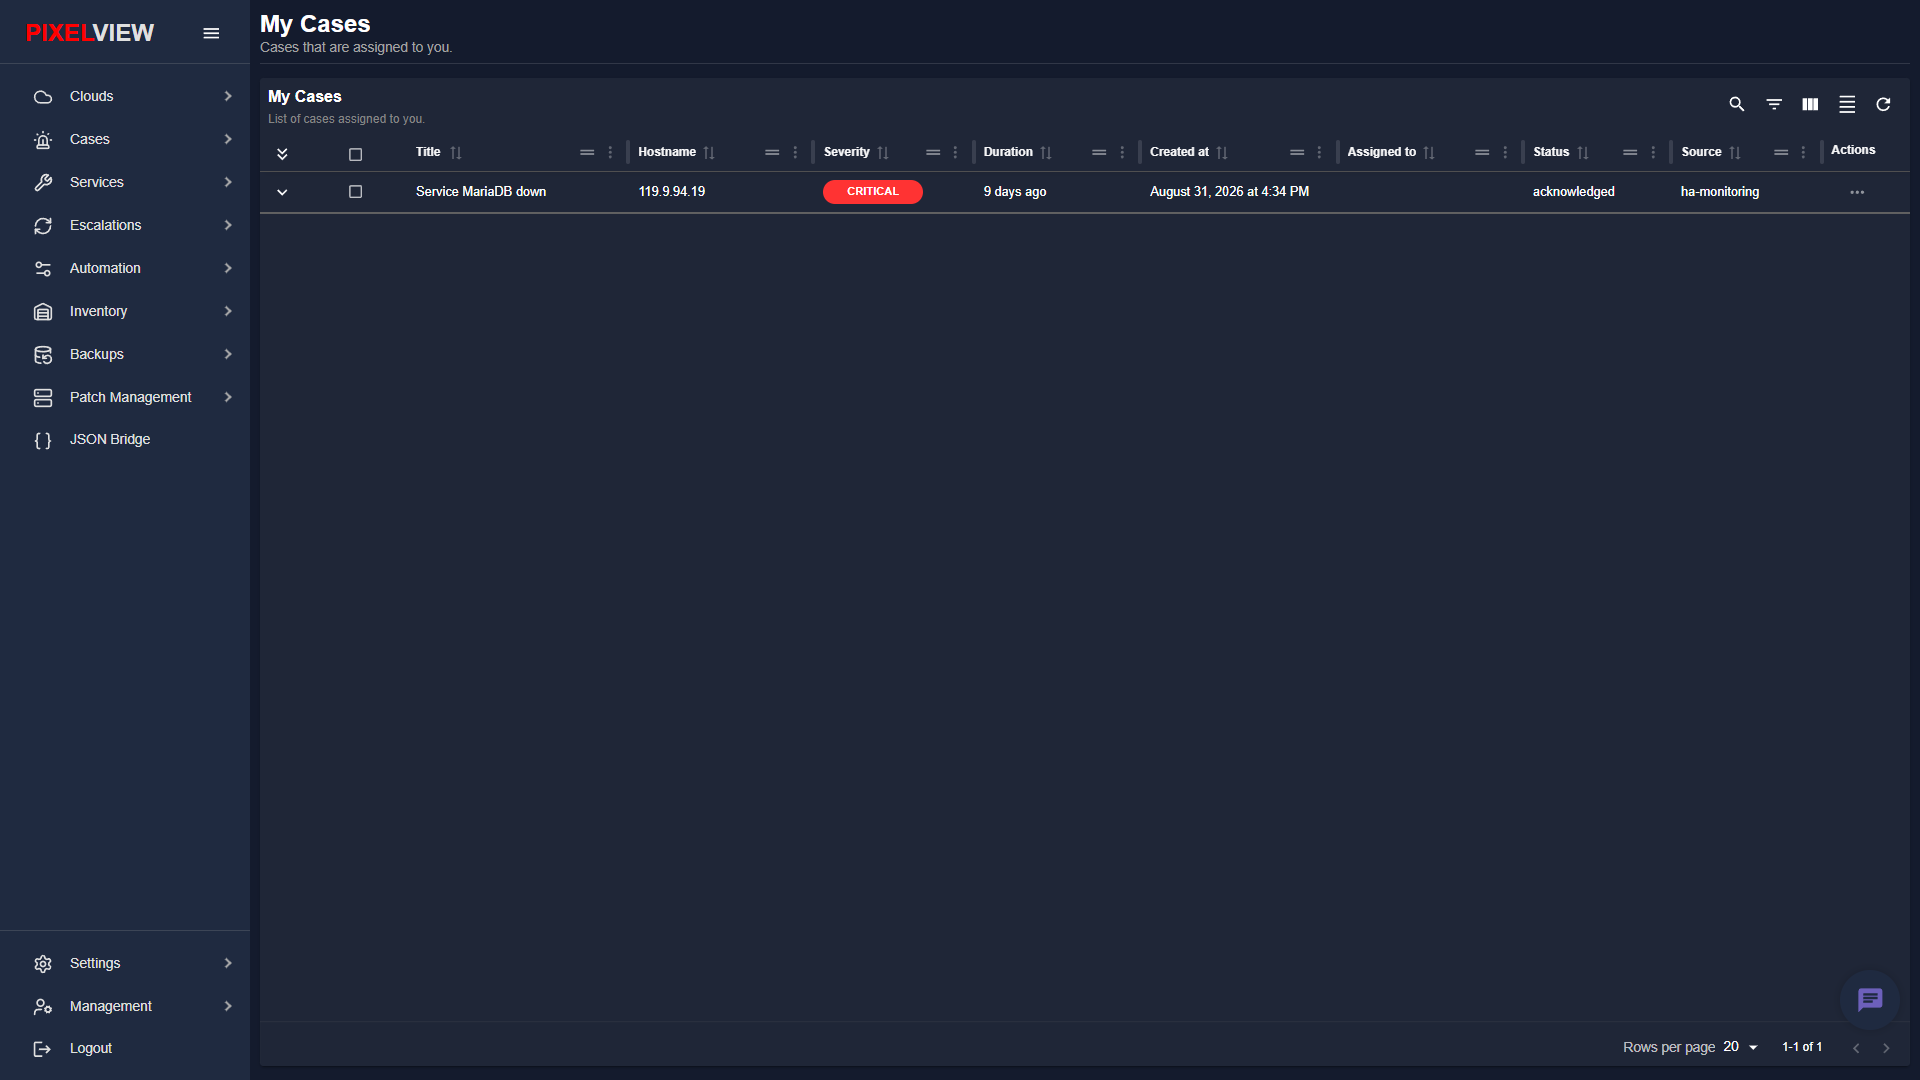
The table displays your assigned cases with 60-second automatic background polling:
| Column | Description |
|---|---|
Expand (v) |
Chevron toggle that expands the row for instant inline comment composition without navigating away from your queue. |
Selection ([ ]) |
Checkbox for selecting individual or multiple assigned cases for batch triage. |
| Title | The incident summary or alert name (e.g., Service MariaDB down). Clicking the title opens the full case investigation console. |
| Hostname | Target node IP or hostname under your responsibility (e.g., 119.9.94.19). |
| Severity | Operational priority level represented as a colored pill badge (CRITICAL in red, HIGH in orange, MEDIUM in yellow, LOW in blue). |
| Duration | Elapsed time since the incident was initially triggered (e.g., 9 days ago). |
| Created at | Creation timestamp recording when the monitoring alert was captured. |
| Assigned to | Confirms assignment to your user account or primary team. |
| Status | Current incident lifecycle state (e.g., acknowledged, triggered). |
| Source | Originating monitoring provider (e.g., ha-monitoring, Prometheus, Zabbix). |
| Actions | Row context menu (...) for rapid lifecycle state transitions. |
Table Toolbar Controls
- Search / Global Filter: Search across your assigned alert titles, hostnames, and monitoring sources.
- Column Filters: Filter your workload by severity tier or creation date.
- Show/Hide Columns: Customize table column visibility to maximize screen efficiency.
- Density Toggle: Toggle between compact and relaxed row height.
- Refresh: Instantly fetch the newest assignments from the backend API.
Managing Assigned Cases
Responders can update incident states directly from the table row:
- Click the Actions menu (
...) on any assigned case row:
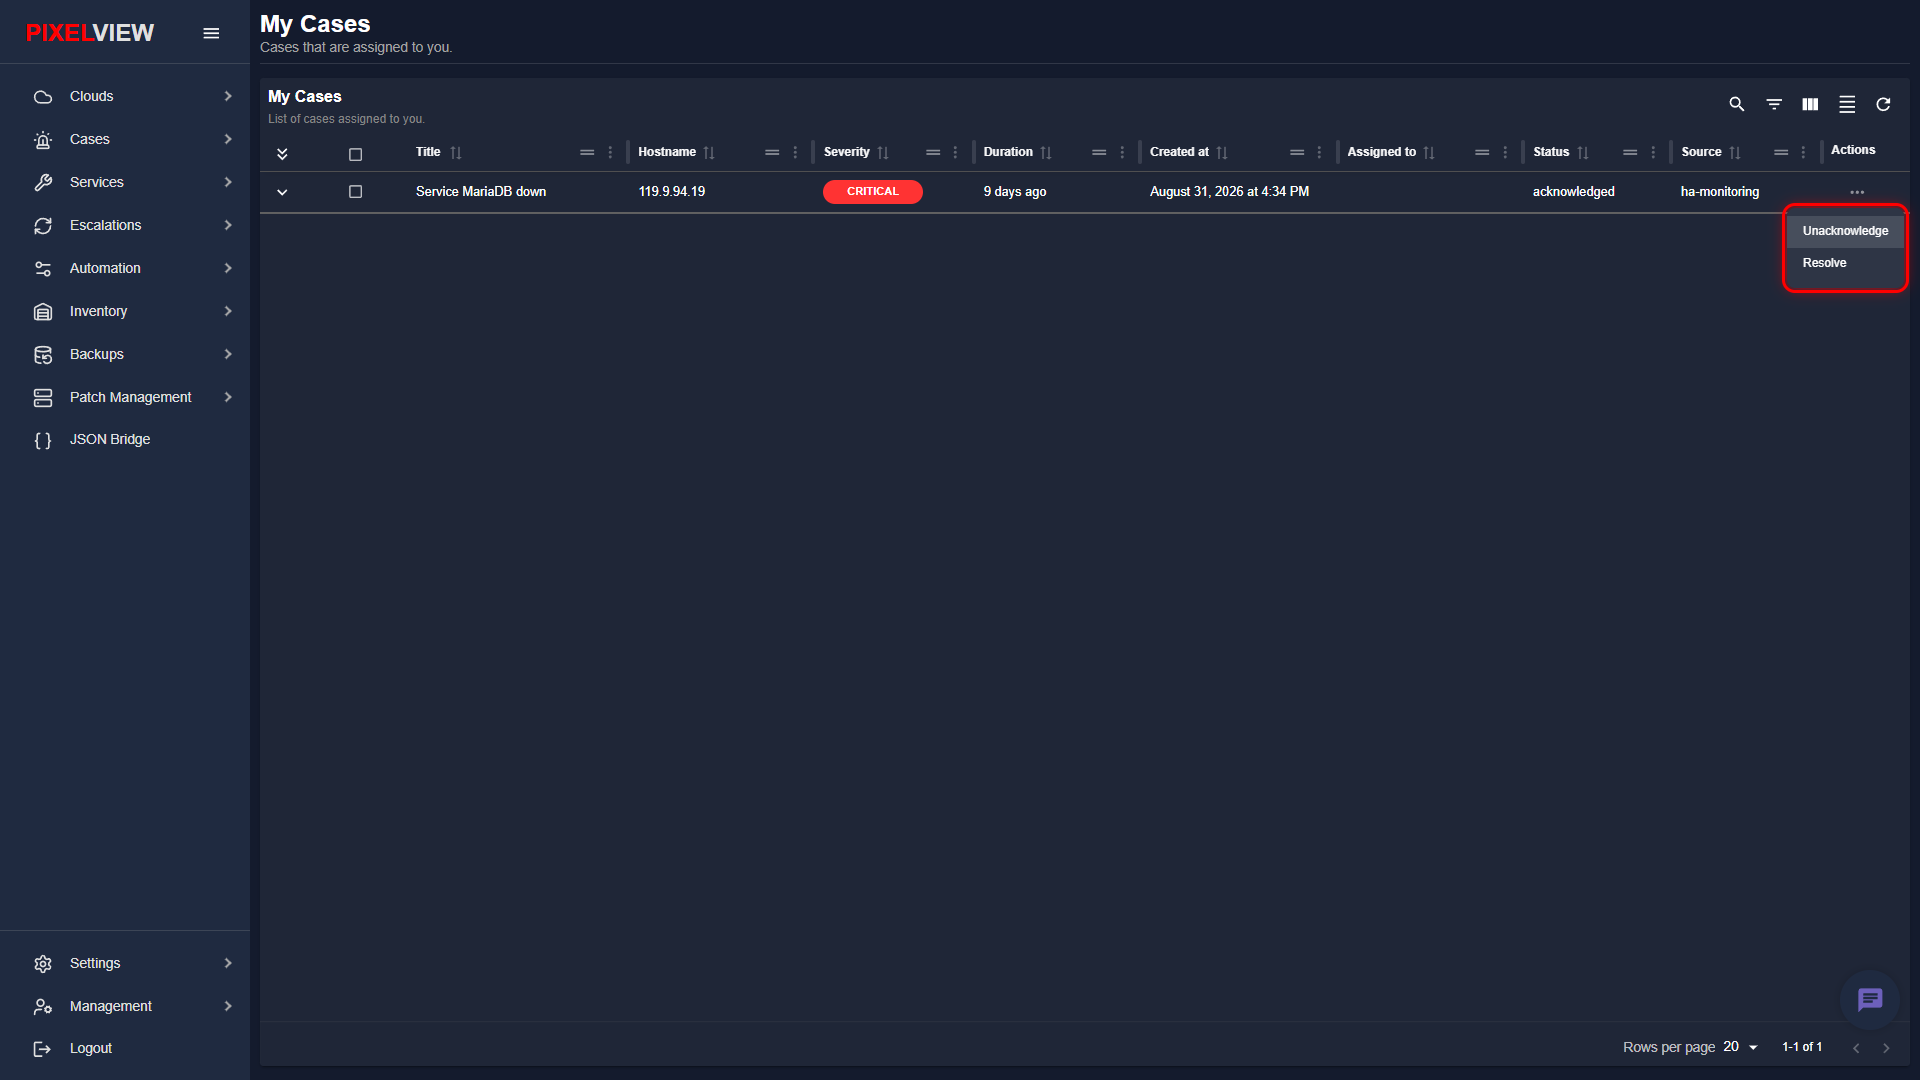
State Transition Actions
- Unacknowledge: Reverts an
acknowledgedcase back totriggered. Use this if you need to hand off the incident back to the general triage queue or if further automated escalation is required. - Acknowledge: If an unacknowledged incident is assigned to you, select Acknowledge to signal to the team that you have commenced active investigation.
- Resolve: Conclude the incident once remediation is verified. Resolving the case automatically moves it into Resolved Cases.
Ownership Handoff & Shift Transition Protocols
During on-call shift changes or escalation transfers, engineers use My Cases to ensure seamless operational continuity:
- Documenting Investigation State: Before transferring an incident, expand the row using the chevron (
v) and post an inline quick comment summarizing diagnostic findings, tested hypotheses, and current system symptoms. - Executing Clean Handoffs: Selecting Unacknowledge from the context menu removes your active claim, transitioning the case back to
triggeredso the incoming on-call engineer or team lead can claim it from Open Cases. - Automated Escalation Protection: While a case is actively
acknowledgedin your queue, automated escalation timers are paused. Handoffs ensure that unmonitored cases do not remain stuck in unaddressed states.
Deep-Dive Investigation & Task Tracking
Clicking any case title in My Cases opens the comprehensive investigation dashboard:
- Investigation Timeline: Review chronological events—from initial webhook triggers and notification emails to automated playbook executions.
- Sub-Task Delegation: Break down complex incident remediation into granular action items under the TASKS tab.
- Team Chat: Communicate updates and upload logs in the COMMENTS tab.
- Historical Host Analysis: Check the HISTORY tab to see if the assigned host has experienced similar failures in the past.
Tip
For a full walkthrough of the four-tab investigation dashboard and sub-task workflows, see the Open Cases Guide.