OpenStack Cloud Management
The OpenStack module (/openstack) under Clouds provides centralized enterprise cloud orchestration, infrastructure lifecycle management, and full-stack observability for OpenStack environments within PixelView.
PixelView seamlessly integrates with core OpenStack services to deliver a unified operational interface: * Telemetry & Quotas (Gnocchi / Ceilometer): Real-time resource utilization, core/RAM/storage capacity tracking, and regional quota telemetry. * Nova (Compute): Virtual machine provisioning, live state management, sizing flavors, SSH key pairs, and anti-affinity placement policies. * Glance (Image Service): OS image catalogs, public and private template lifecycle, and distribution management. * Cinder & Swift (Storage Services): Persistent block volume lifecycle, NVMe/Standard storage tiers, point-in-time volume snapshots, durable volume backups, and distributed Swift object storage containers. * Neutron (Software-Defined Networking): Multi-tenant virtual networks, subnets, routers, distributed firewall security groups, public floating elastic IPs, virtual network ports, and QoS bandwidth policies. * Octavia (Load Balancing): Enterprise layer 4/7 load balancers, listener pools, and active health monitoring. * Keystone (Identity & Governance): Multi-tenant project boundaries, user authentication, role-based access control (RBAC), and automation application credentials.
Accessing OpenStack & Multi-Region Management
Navigating to OpenStack
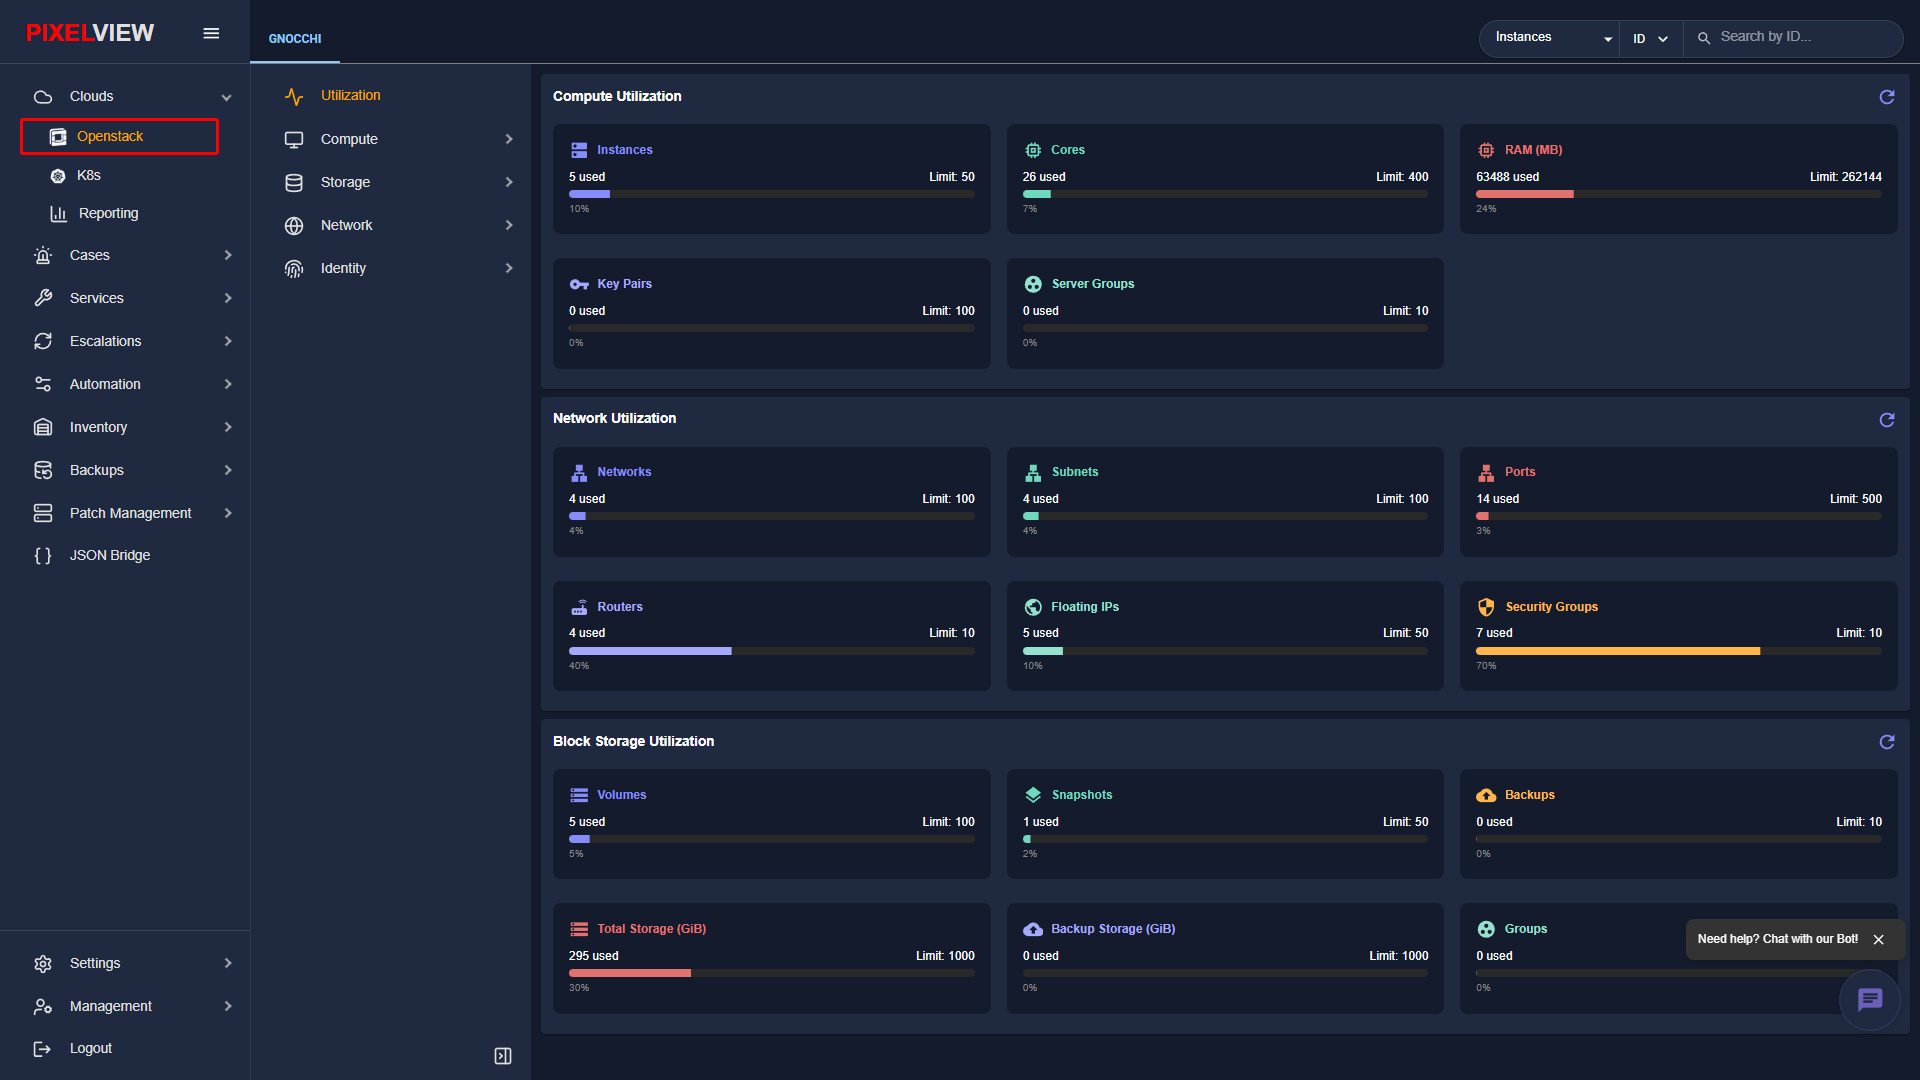
To access the OpenStack module: * In the primary left navigation sidebar, expand Clouds. * Click OpenStack:
Multi-Region Architecture & Switcher
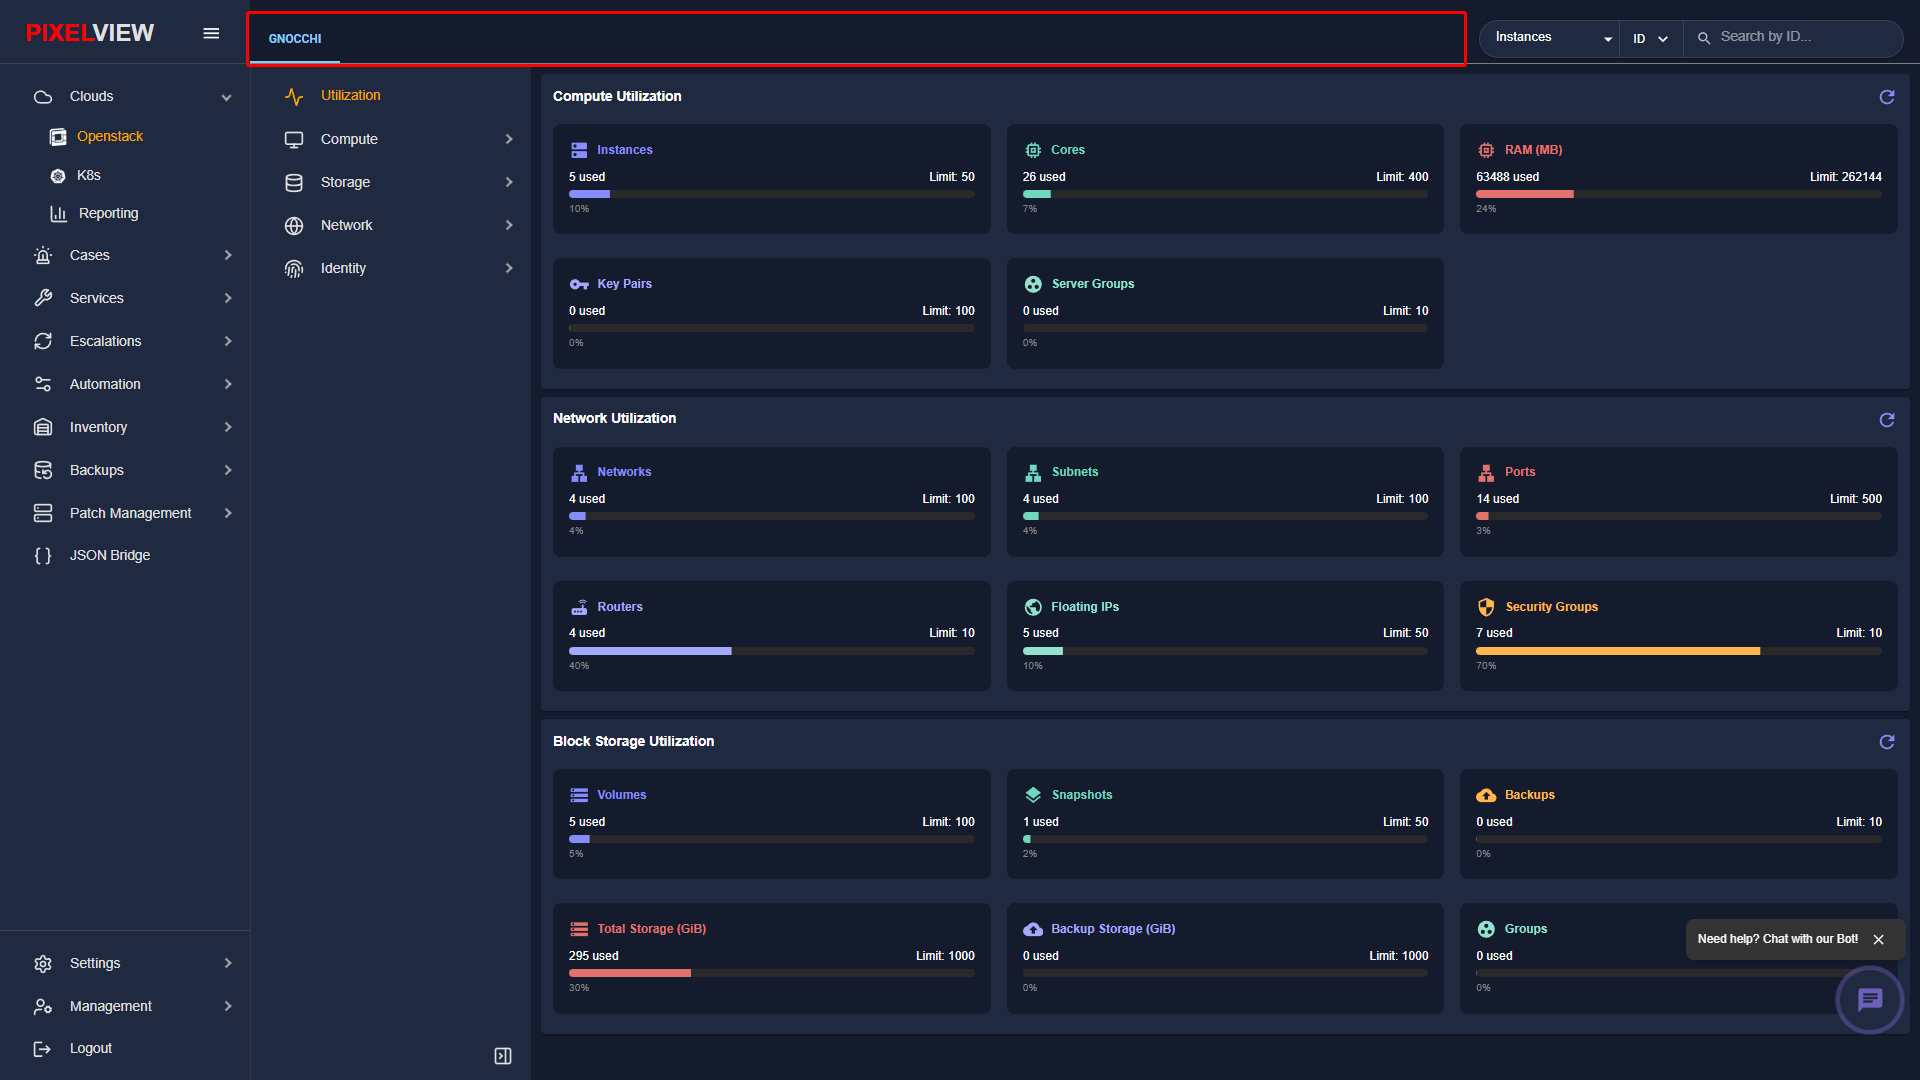
PixelView natively supports multi-region OpenStack deployments from a single unified pane. When entering OpenStack, PixelView automatically detects and displays all available regions:
| Region Control | Description |
|---|---|
| Region Navigation Tabs | Located in the top header bar (e.g., GNOCCHI, regionOne). Clicking any tab instantly switches the active operational region without re-authenticating. |
| Scope Search Area | Dropdown filter allowing operators to search specifically within Instances, Volumes, Networks, or All Resources. |
| Search Field Selector | Targeted query criteria selector (ID, Name, IP Address, or Status). |
| Global Search Input | Real-time full-text search with instant cross-region filtering. |
| Secondary Region Sidebar | Dedicated service navigation tree on the left containing Utilization, Compute, Storage, Network, and Identity. |
Note
All subsequent actions, resource tables, and provisioning wizards are scoped to the currently selected region displayed in the top header bar.
Regional Utilization & Quota Telemetry
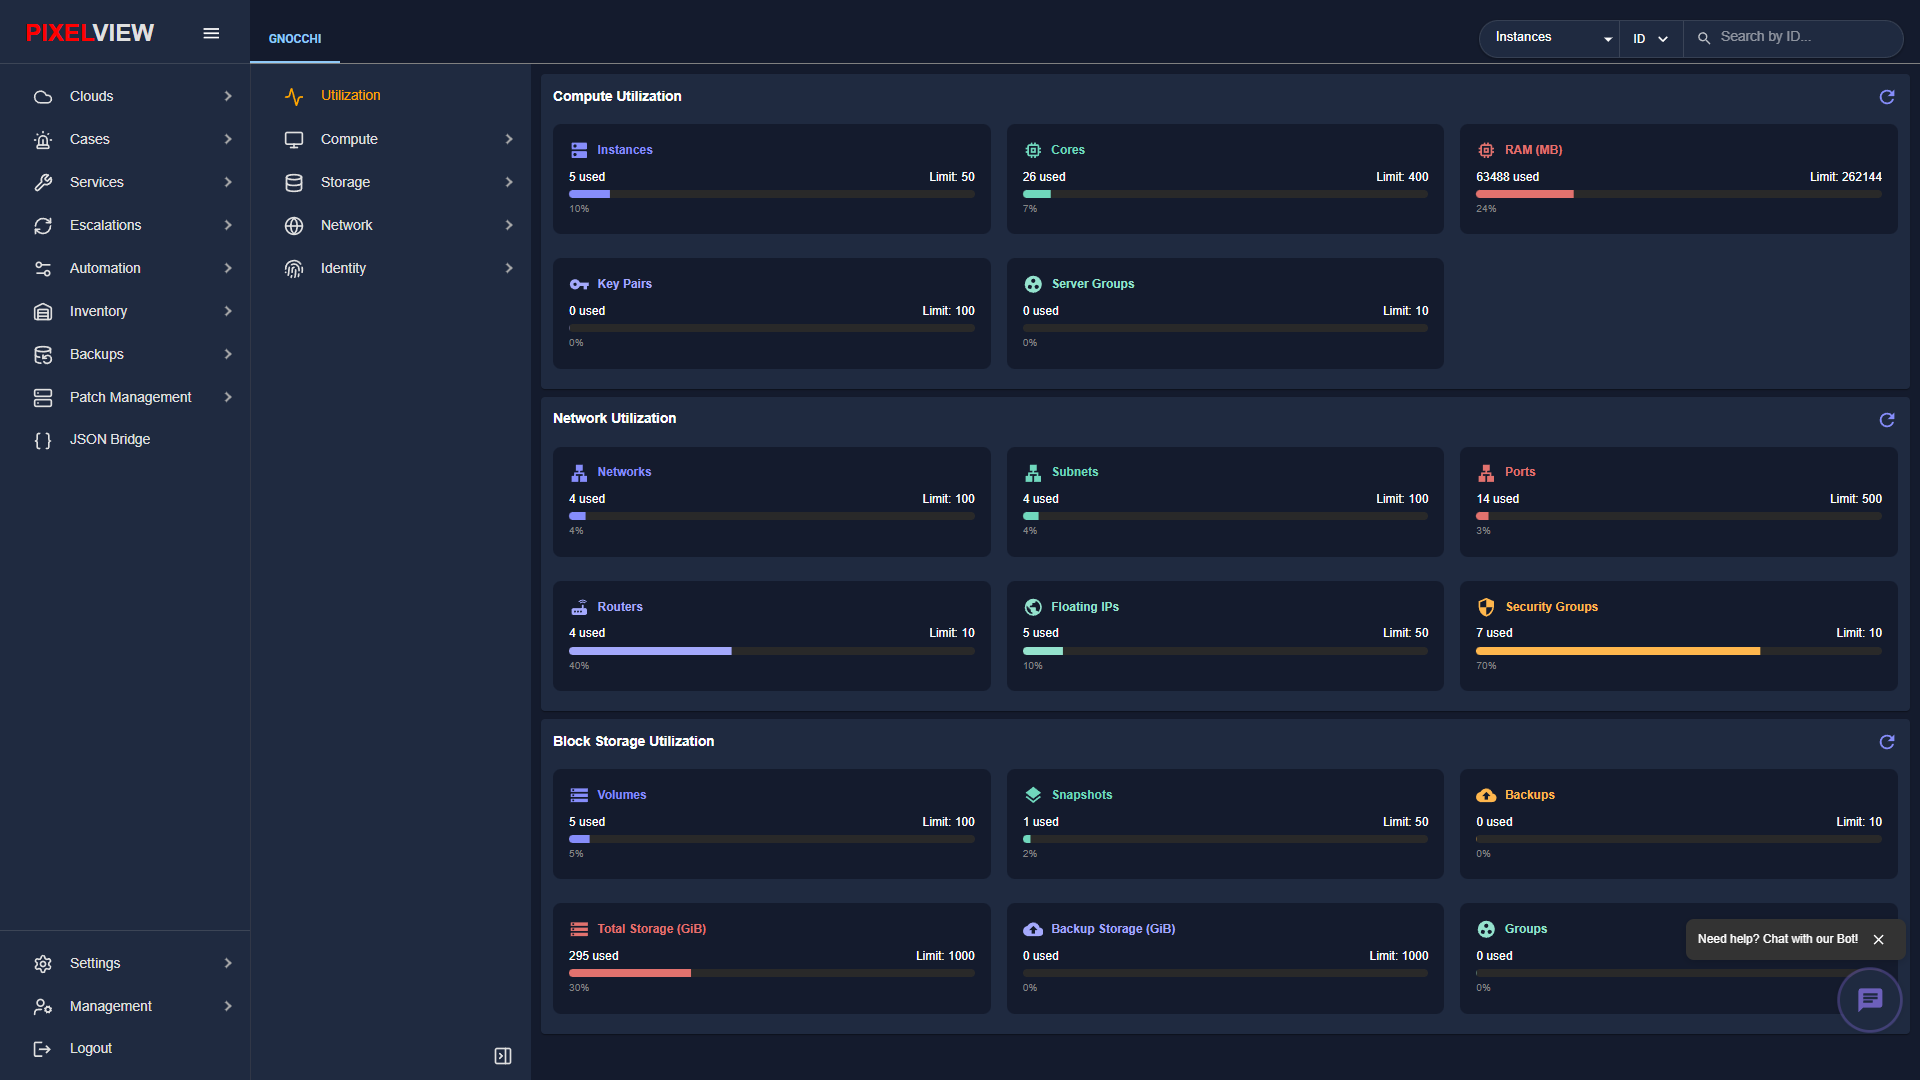
The Utilization dashboard (/openstack/:regionName) is the initial landing view for each OpenStack region, presenting an aggregated summary of infrastructure consumption against regional quota thresholds.
Utilization Dashboard Overview
Navigate to Utilization in the secondary sidebar:
Quota Categories & Resource Metrics
| Category | Metric | Description |
|---|---|---|
| Compute Utilization | Instances | Total active virtual machines provisioned against the tenant quota limit (e.g., 5 used / Limit: 50). |
| Cores | Total vCPU cores allocated across active instances (e.g., 26 used / Limit: 400). |
|
| RAM (MB) | Aggregated system memory assigned to running virtual machines (e.g., 63488 MB used / Limit: 262144 MB). |
|
| Key Pairs | Number of registered SSH public key pairs (e.g., 0 used / Limit: 100). |
|
| Server Groups | Active anti-affinity and affinity placement group allocations (e.g., 0 used / Limit: 10). |
|
| Network Utilization | Networks | Number of virtual Layer 2 networks provisioned (e.g., 4 used / Limit: 100). |
| Subnets | Configured IPv4/IPv6 IP subnets (e.g., 4 used / Limit: 100). |
|
| Ports | Bound virtual network interfaces across VMs, routers, and load balancers (e.g., 14 used / Limit: 500). |
|
| Routers | Virtual Layer 3 routing gateways active in the region (e.g., 4 used / Limit: 10). |
|
| Floating IPs | Allocated public elastic IP addresses (e.g., 5 used / Limit: 50). |
|
| Security Groups | Distributed firewall rulesets defined (e.g., 7 used / Limit: 10). |
|
| Block Storage Utilization | Volumes | Persistent Cinder storage volumes created (e.g., 5 used / Limit: 100). |
| Snapshots | Point-in-time volume snapshot copies retained (e.g., 1 used / Limit: 50). |
|
| Backups | Durable volume backup archives stored in object storage (e.g., 0 used / Limit: 10). |
|
| Total Storage (GiB) | Cumulative disk space allocated across all block volumes (e.g., 295 GiB used / Limit: 1000 GiB). |
Hypervisor Overcommit Ratios & Capacity Sizing
When operating private enterprise clouds, hypervisor resources are managed according to deliberate allocation ratios configured in nova.conf. PixelView tracks the physical allocation footprint against these overcommit policies:
- CPU Allocation Ratio (
cpu_allocation_ratio):- Development / Staging Clusters (
16.0): 16 virtual vCPUs per physical host core. Suitable for bursty development environments, CI/CD runners, and microservices with low average CPU utilization. - General Enterprise Workloads (
4.0-8.0): 4 to 8 virtual vCPUs per physical core. Provides high density while avoiding CPU "noisy neighbor" latency spikes. - High-Performance & Database Clusters (
1.0-2.0): Dedicated or near-dedicated physical cores. Prevents context switching overhead for latency-sensitive transactional databases (e.g., PostgreSQL, MySQL, Redis).
- Development / Staging Clusters (
- RAM Allocation Ratio (
ram_allocation_ratio):- Production Standard (
1.0): PixelView recommends a strict 1:1 physical memory allocation ratio for production hypervisors. Unlike CPU cores, memory cannot be transparently compressed on Linux KVM hosts without triggering kernel swap thrashing or the Out-of-Memory (oom-killer) daemon terminating active hypervisor processes.
- Production Standard (
- Disk Allocation Ratio (
disk_allocation_ratio):- Ceph RBD & Thin-Provisioned SAN (
1.5-2.0): Enables safe overprovisioning when volume backends utilize thin provisioning, copy-on-write, and deduplication. - Local Ephemeral Disks (
1.0): Dedicated disk space allocation to prevent hypervisor local/var/lib/nova/instancesstorage from running out of disk during snapshot operations.
- Ceph RBD & Thin-Provisioned SAN (
Compute Infrastructure (Nova & Glance)
The Compute submenu provides complete management over virtual machines, hardware profiles, image catalogs, SSH credentials, and server affinity placement.
Instances (Virtual Machines)
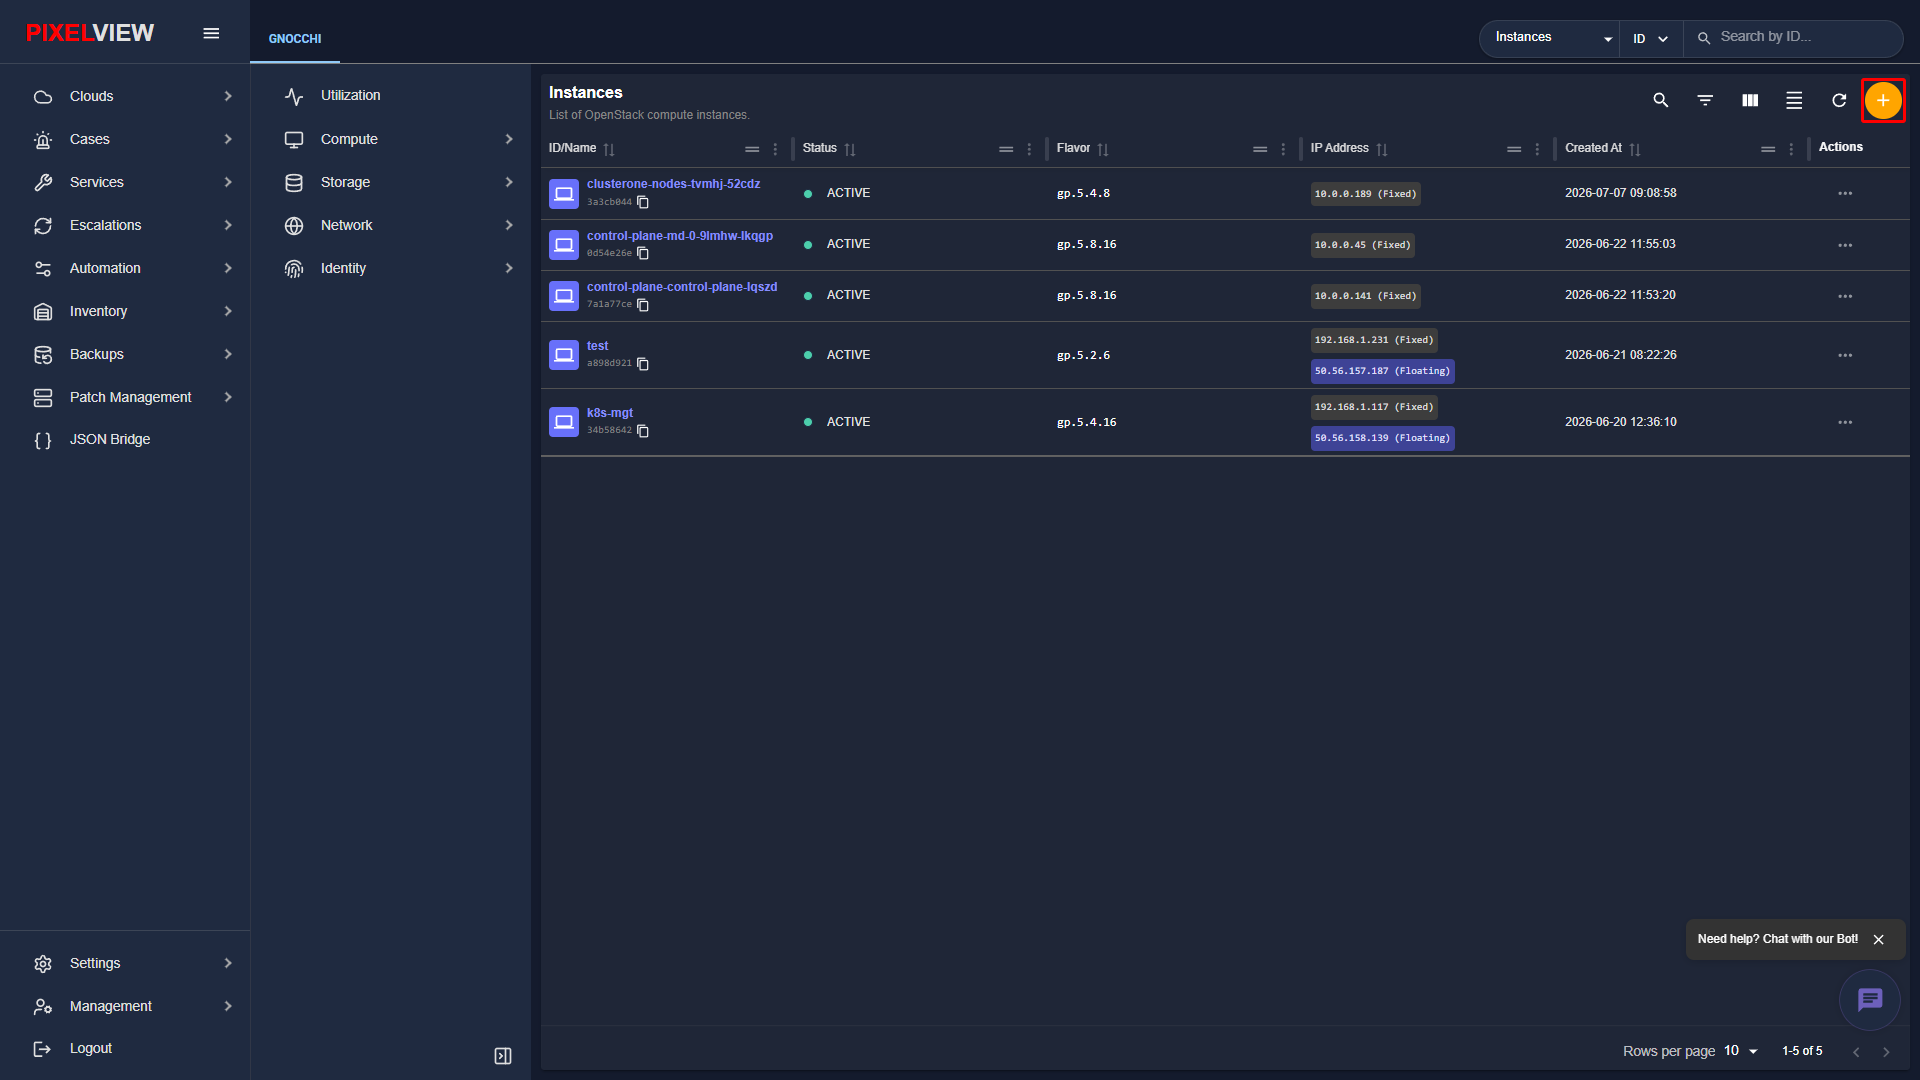
Instances Table Overview
Navigate to Compute → Instances in the secondary sidebar:
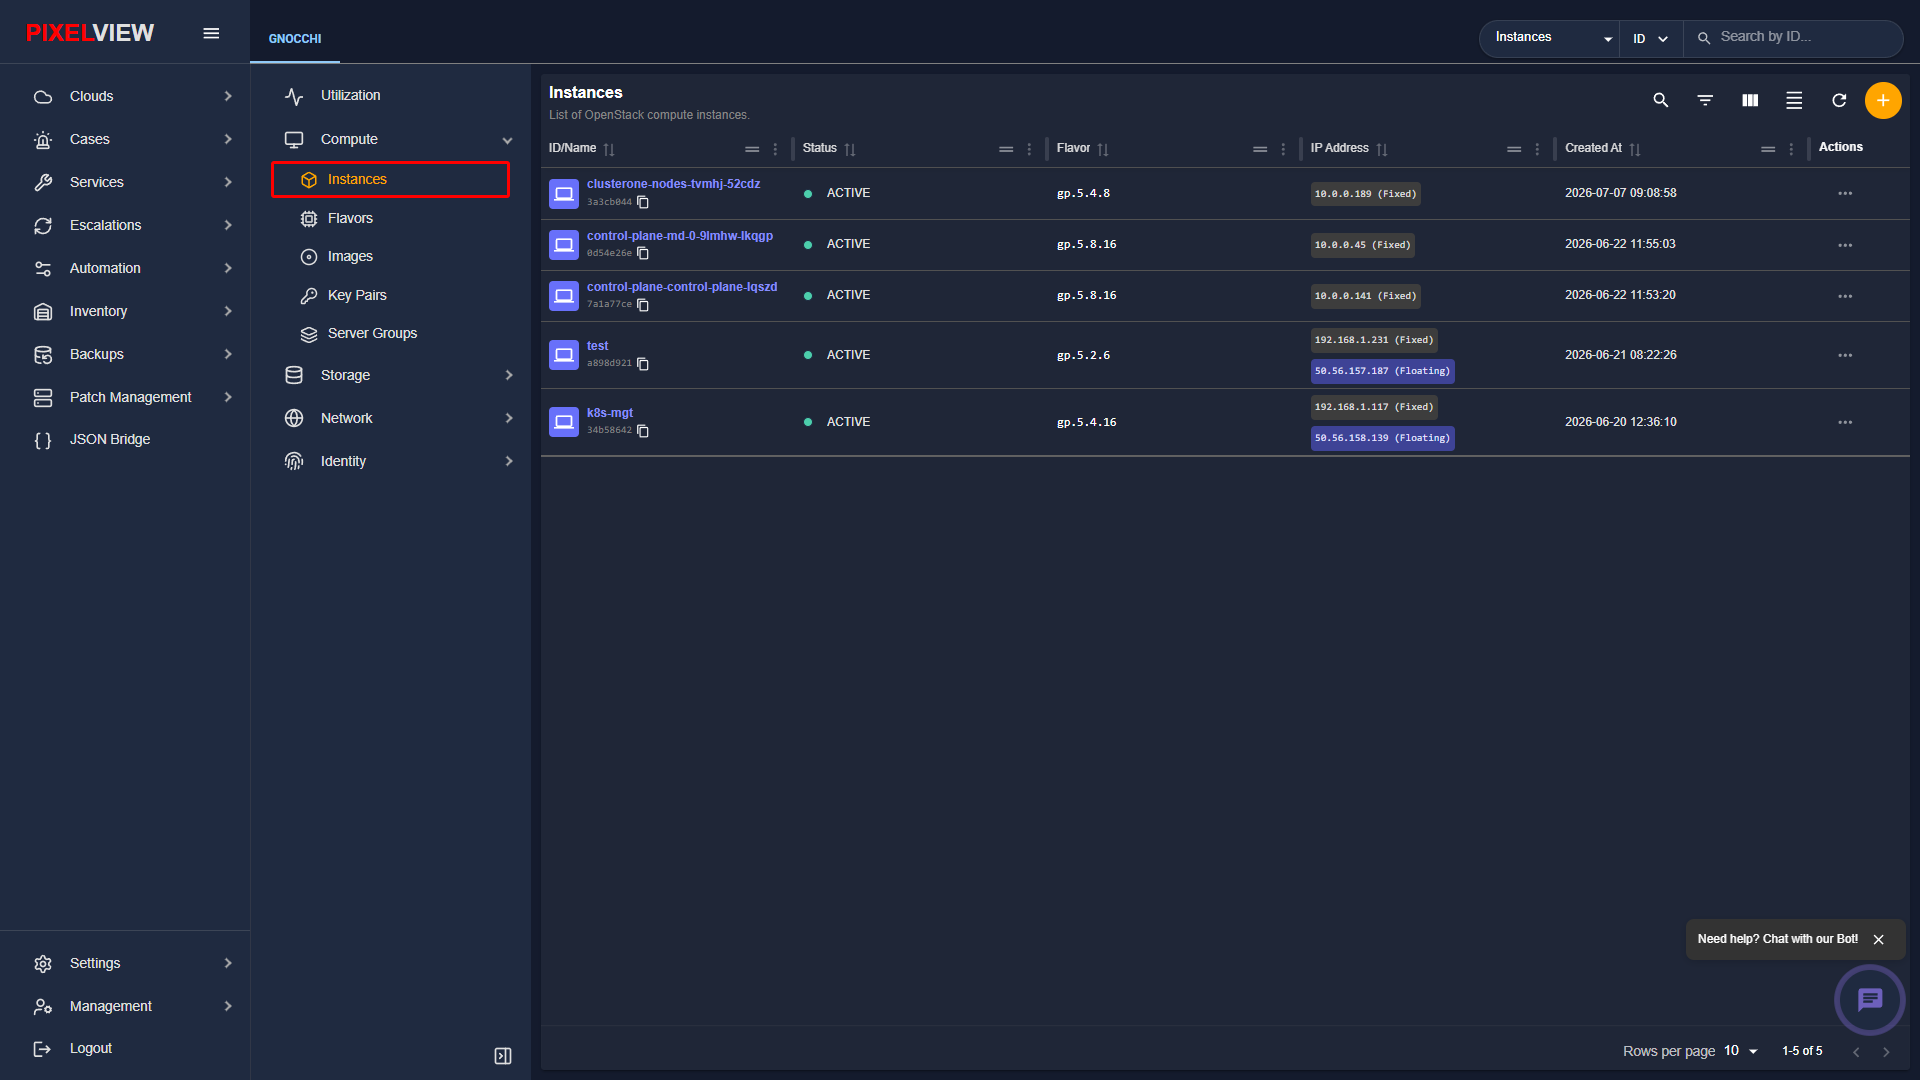
The Instances table provides comprehensive details for every virtual machine deployed in the active region:
| Column | Description |
|---|---|
| ID / Name | Virtual machine display name, system UUID, and quick-copy button. Clicking the instance name navigates to the detailed drill-down view. |
| Status | Real-time lifecycle state badge: ACTIVE (running), SHUTOFF (powered off), PAUSED, SUSPENDED, BUILDING, or ERROR. |
| Flavor | Allocated hardware profile (e.g., gp.5.4.8, gp.5.8.16, mo.6.2.16) defining vCPU, memory, and root disk allocations. |
| IP Address | Assigned IP endpoints categorized by type: Fixed (internal tenant network IP) and Floating (publicly routable elastic IP). |
| Created At | Timestamp indicating initial provisioning time (YYYY-MM-DD HH:mm:ss). |
Actions (...) |
Contextual action menu providing operations such as Start, Shutoff, Reboot, Attach Volume, and Terminate. |
Launching a New Instance
To provision a new virtual machine:
- Click the orange
+(Launch Instance) button located in the top-right toolbar above the table:
- The multi-step Launch Instance modal wizard opens:
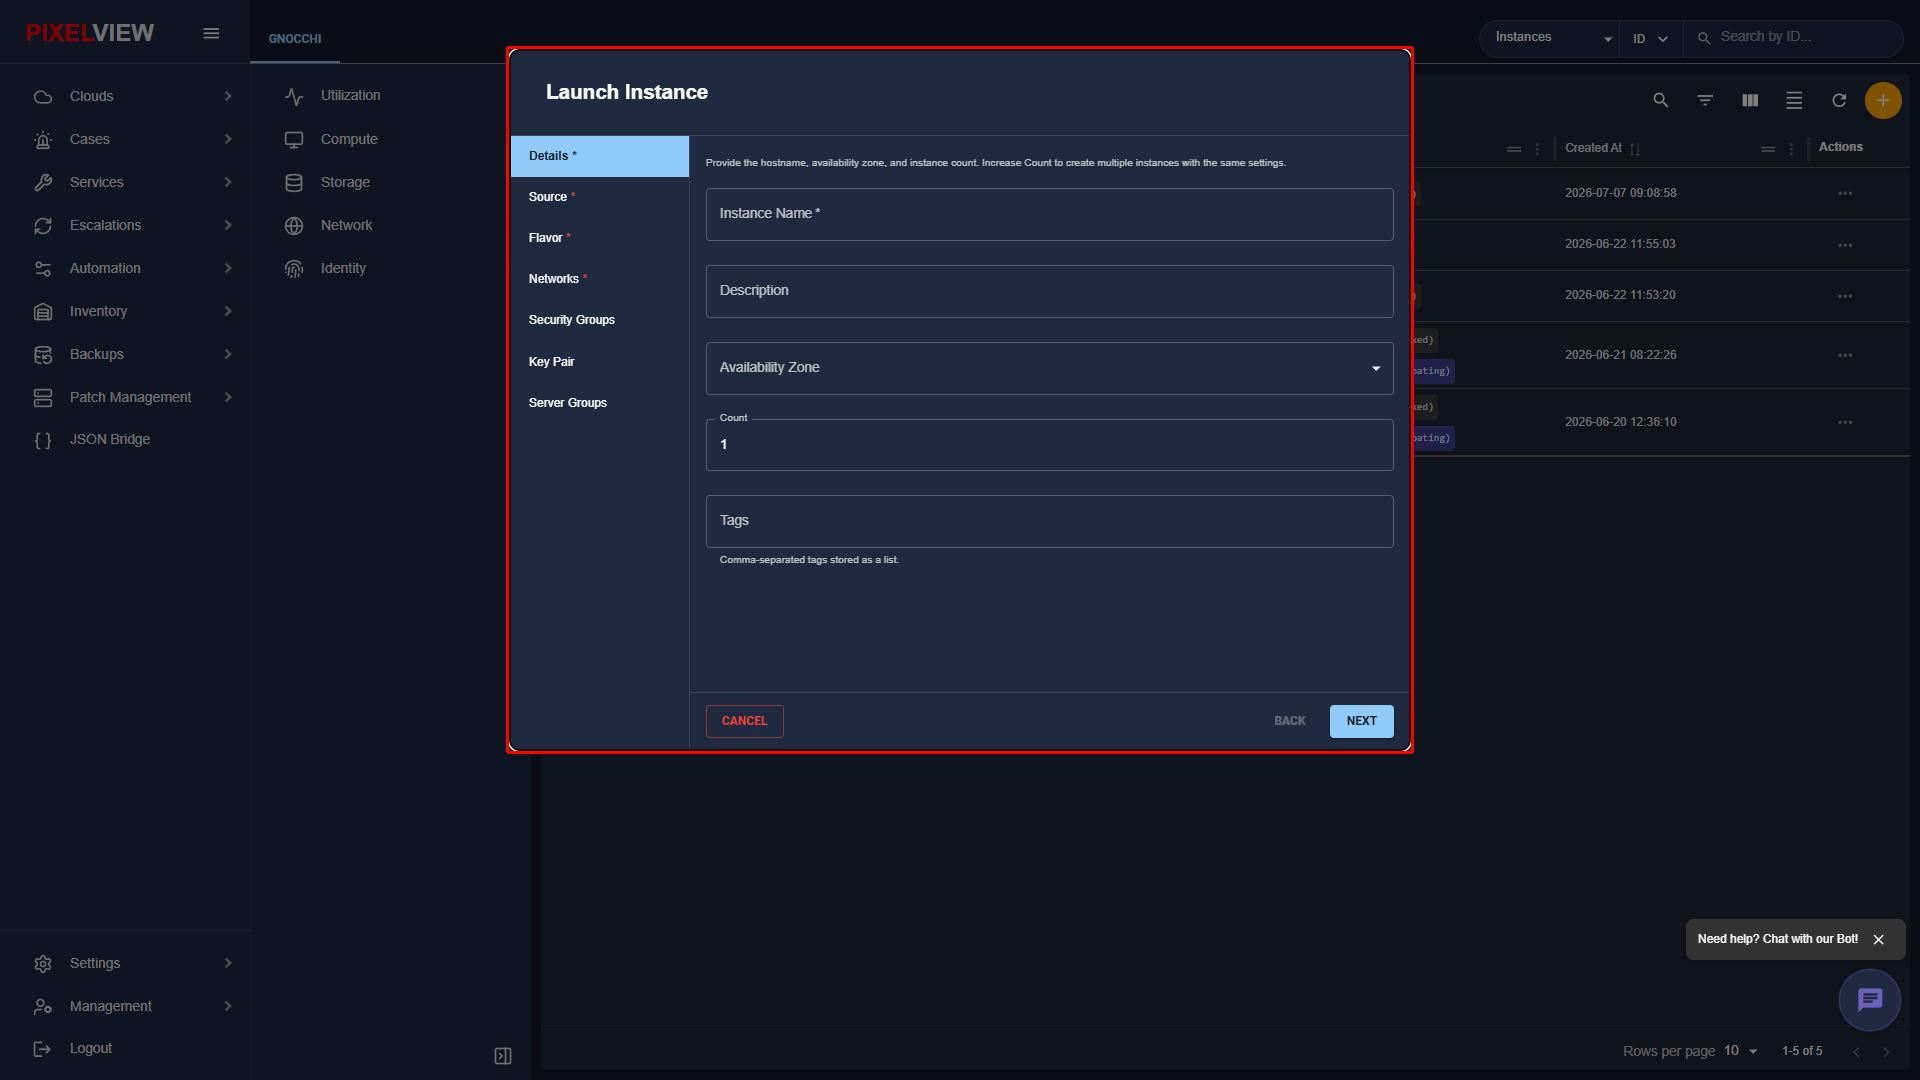
Launch Wizard Step Reference
| Step | Parameter | Type | Description |
|---|---|---|---|
| Details | Instance Name | Required Text | Hostname for the virtual machine instance. |
| Description | Optional Text | Operational notes, purpose, or ownership tags. | |
| Availability Zone | Dropdown | Target physical zone for compute placement (e.g., nova). |
|
| Count | Number | Number of identical instances to spin up concurrently (default: 1). |
|
| Tags | Comma-delimited | Searchable organizational metadata labels. | |
| Source | Boot Source | Dropdown | Select boot volume source: Image, Volume, or Volume Snapshot. |
| Delete Volume on Termination | Toggle | Automatically purge root storage upon VM deletion to avoid orphan volumes. | |
| Flavor | Compute Flavor | Selection | Select resource profile matching CPU, RAM, and storage requirements. |
| Networks | NIC Attachment | Selection | Bind virtual network interfaces (e.g., tenant private subnet). |
| Security Groups | Firewall Profile | Multi-select | Attach distributed security groups controlling ingress and egress traffic. |
| Key Pair | SSH Public Key | Dropdown | Select injected SSH key pair for passwordless administrative access. |
| Server Groups | Affinity Policy | Optional Selection | Assign to an anti-affinity group to guarantee high availability across hypervisors. |
Instance Details & Drill-Down
Clicking on any instance name or ID in the table navigates directly to the comprehensive Instance Details page (/openstack/:regionName/instances/:uuid):
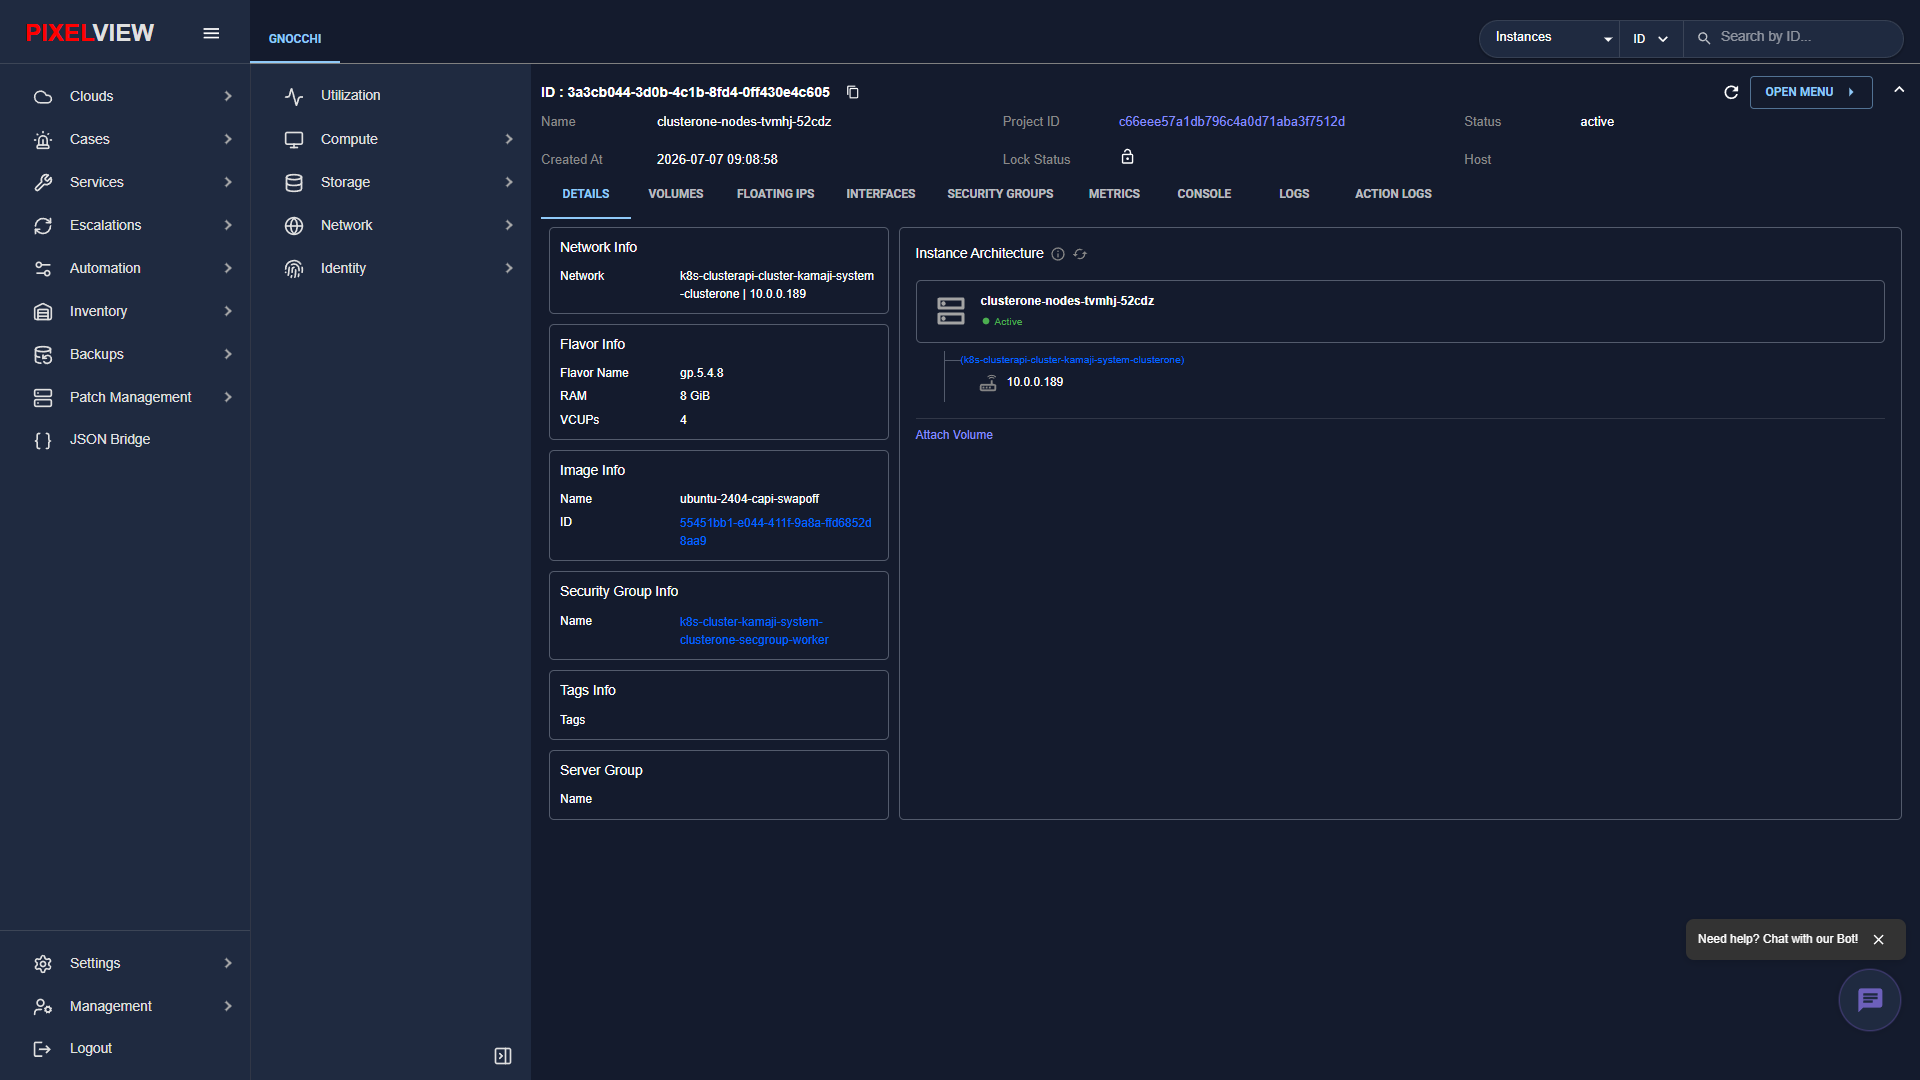
The Instance Details page provides specialized observability across multiple functional tabs:
- DETAILS: Core system metadata including UUID, display name, project ID, status (active), creation timestamp, lock status, host placement, network address bindings, flavor parameters (RAM, vCPUs), image template details, assigned security groups, tags, and an interactive Instance Architecture diagram.
- VOLUMES: Inventory of all persistent block storage volumes attached to this VM, with mount points (e.g., /dev/vda, /dev/vdb), size, and detachment controls.
- FLOATING IPS: Public IP bindings associated with the instance's virtual interfaces.
- INTERFACES: Virtual network interface cards (vNICs), MAC addresses, internal IP allocations, and subnet bindings.
- SECURITY GROUPS: Real-time firewall rulesets enforced on the instance's network ports.
- METRICS: Real-time telemetry monitoring for CPU, memory, and disk utilization.
- CONSOLE: In-browser interactive terminal console access.
- LOGS: Serial console boot logs and kernel ring buffer output.
- ACTION LOGS: Audit history of lifecycle events performed on this instance.
Instance Lifecycle & Actions Menu
In the top-right corner of the Instance Details page, the OPEN MENU button exposes the full suite of instance management operations:
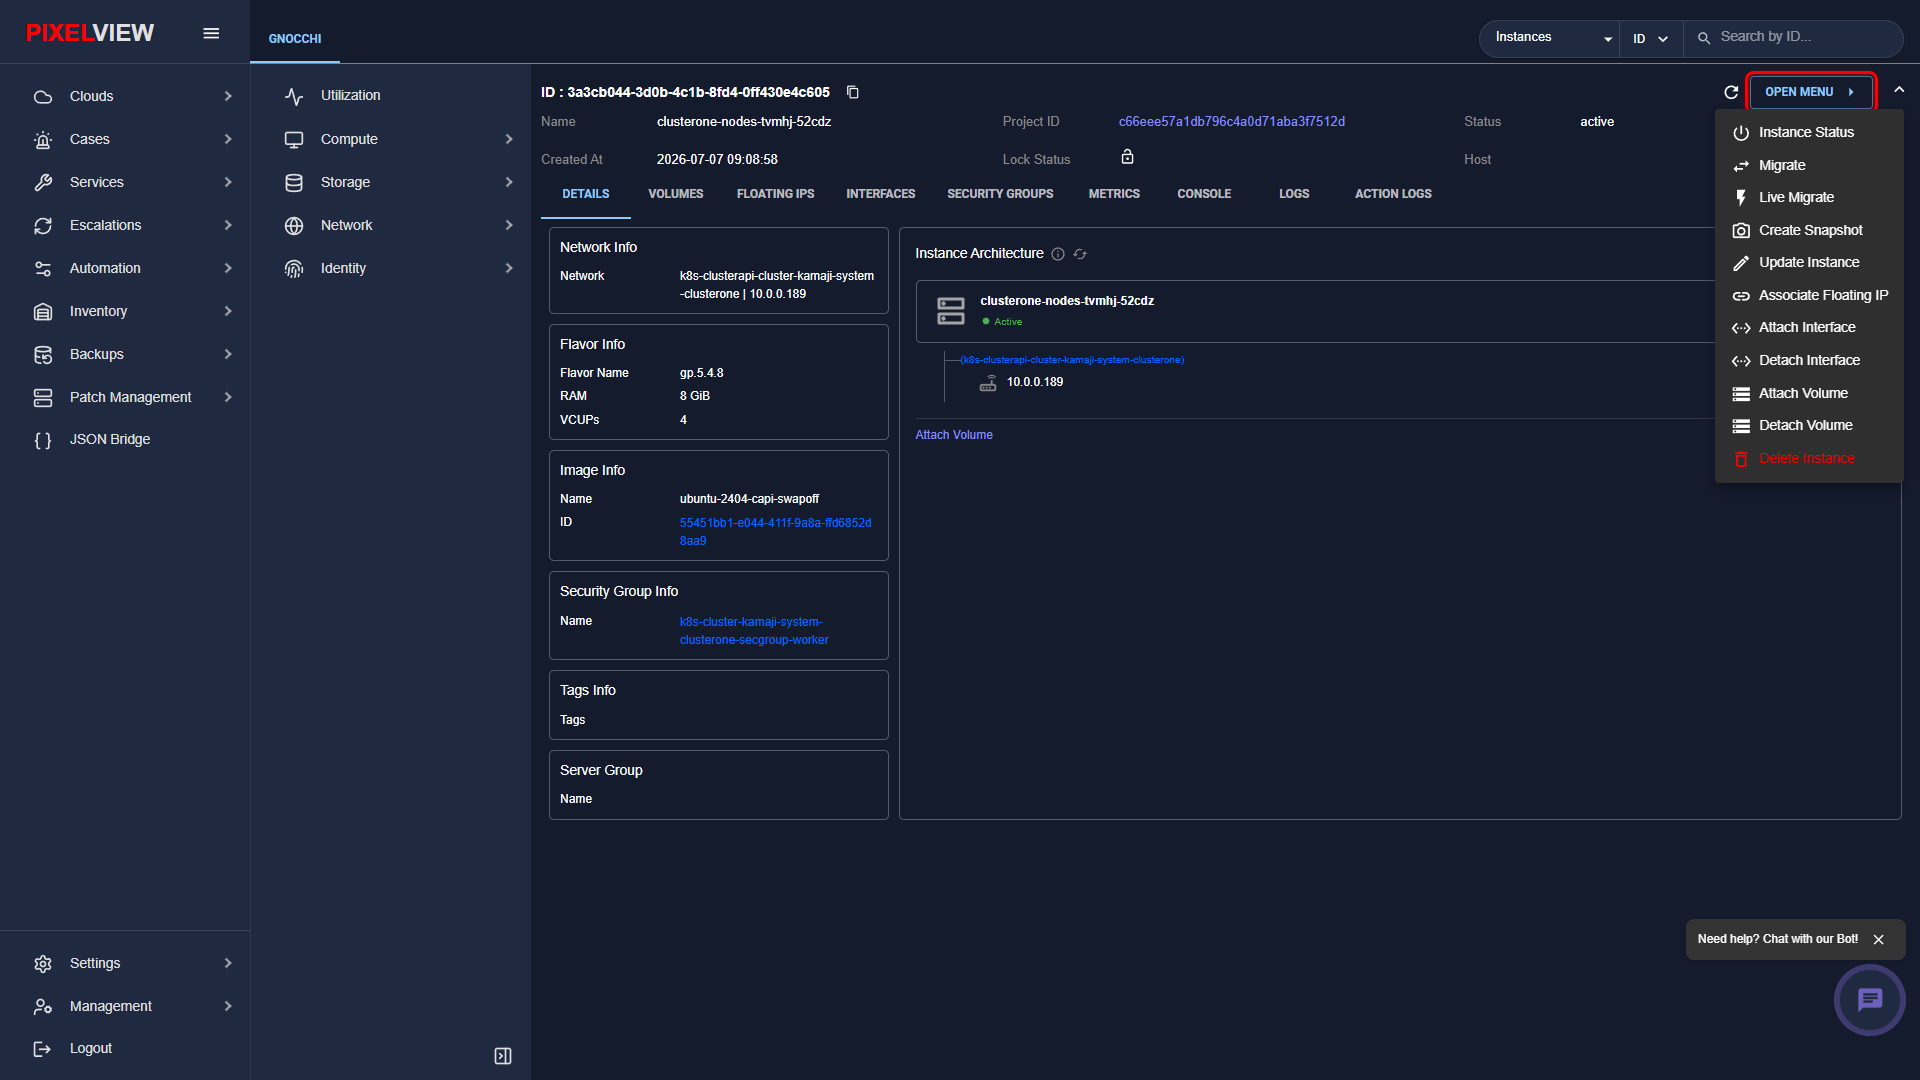
| Operation | Description |
|---|---|
| Instance Status | Power cycle controls: Start, Shutoff, Soft Reboot, Hard Reboot, Pause, Resume, Suspend, or Lock. |
| Migrate | Cold migration of the instance to another physical hypervisor in the availability zone. |
| Live Migrate | Zero-downtime live migration preserving memory state and active network connections. |
| Create Snapshot | Point-in-time snapshot of the instance root disk saved as an image template in Glance. |
| Update Instance | Modify instance metadata, display name, or attached security group profiles. |
| Associate Floating IP | Bind a publicly routable elastic IP to the virtual machine. |
| Attach Interface | Hot-plug a new virtual network interface card (vNIC) into a tenant network. |
| Detach Interface | Remove an attached network interface from the virtual machine. |
| Attach Volume | Mount an existing persistent Cinder block volume to the instance. |
| Detach Volume | Unmount an attached block storage volume. |
| Delete Instance | Terminate the virtual machine and clean up associated ephemeral resources. |
In-Browser Interactive Console (noVNC)
Click the CONSOLE tab on the Instance Details page to open a direct out-of-band graphical/text console session to the virtual machine:
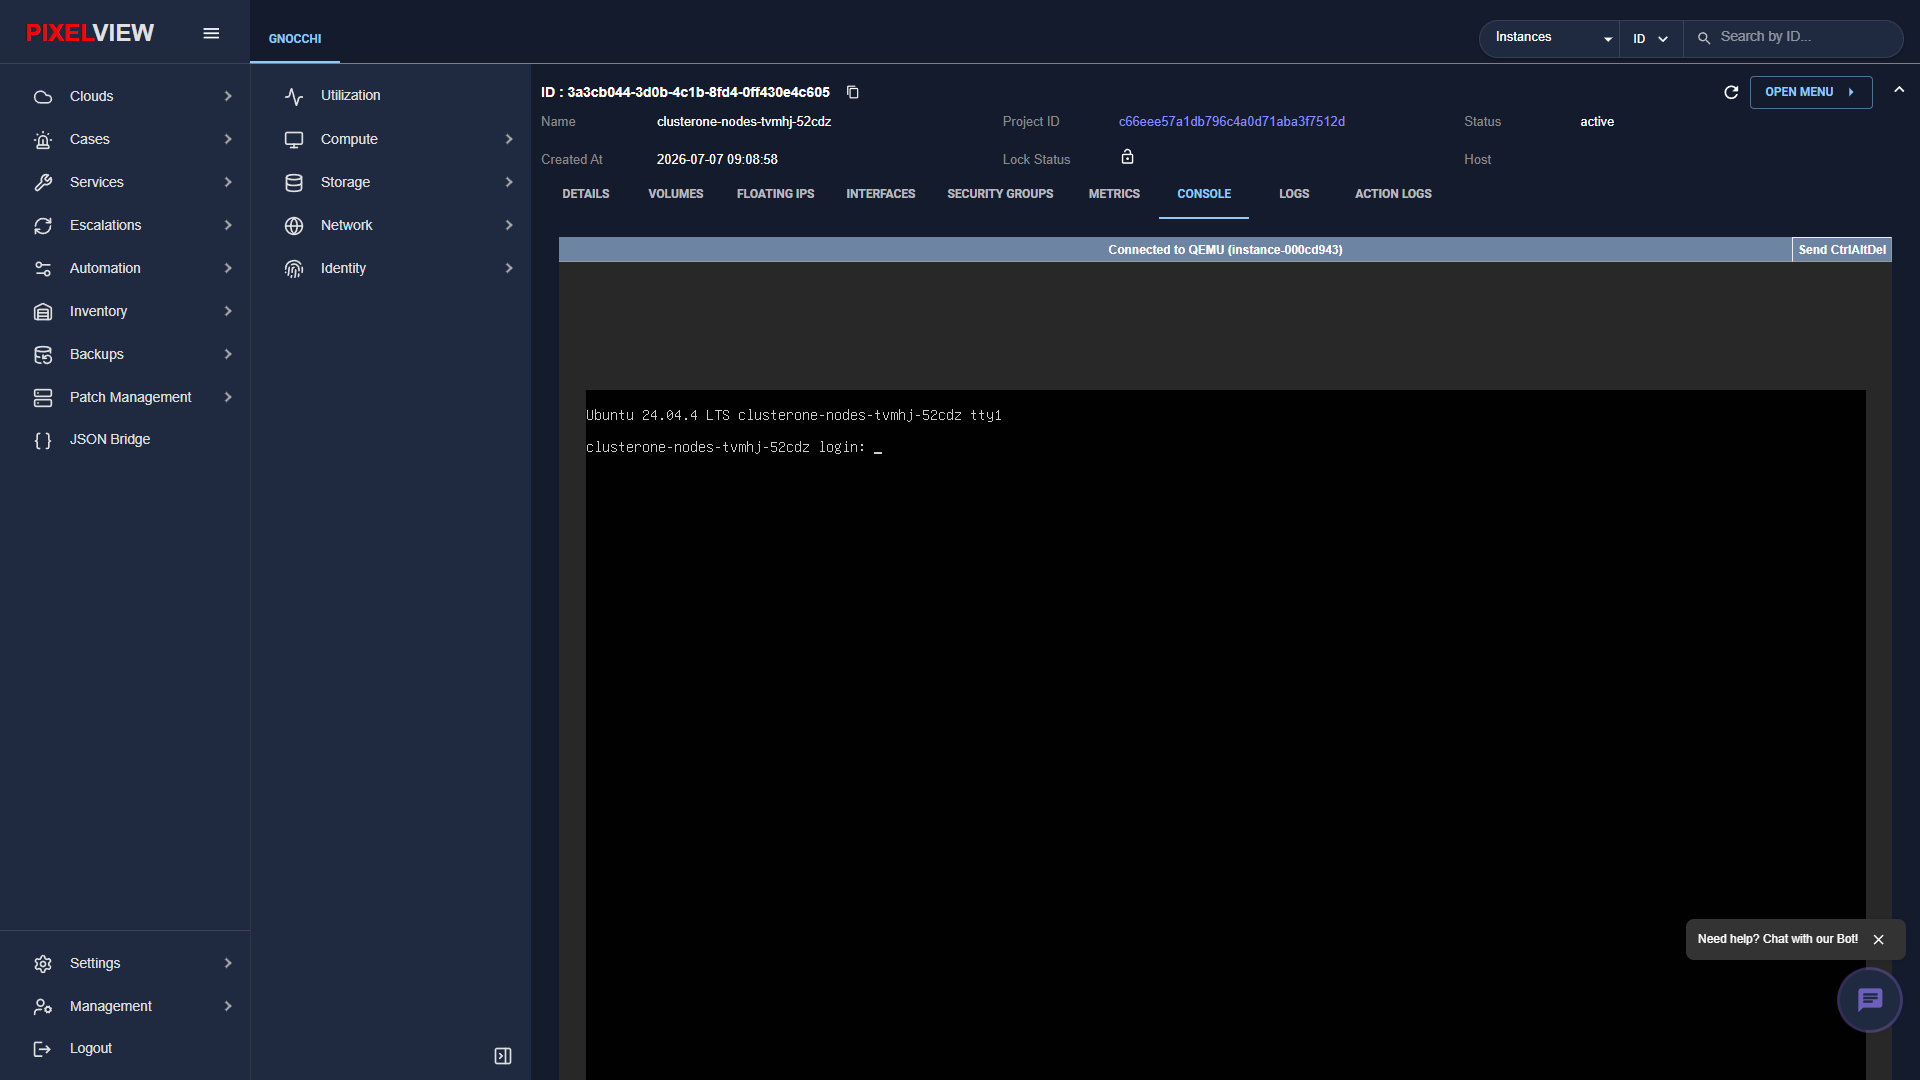
- Send CtrlAltDel: Dedicated top-right button to inject the
Ctrl+Alt+Deletekey combination directly to the guest operating system for administrative login or rebooting. - Full Keyboard Redirection: Seamless key capture enabling direct interaction with the bootloader (GRUB), maintenance mode, or system login prompt.
Telemetry & Performance Metrics
Click the METRICS tab on the Instance Details page to inspect live time-series telemetry collected via OpenStack Gnocchi:
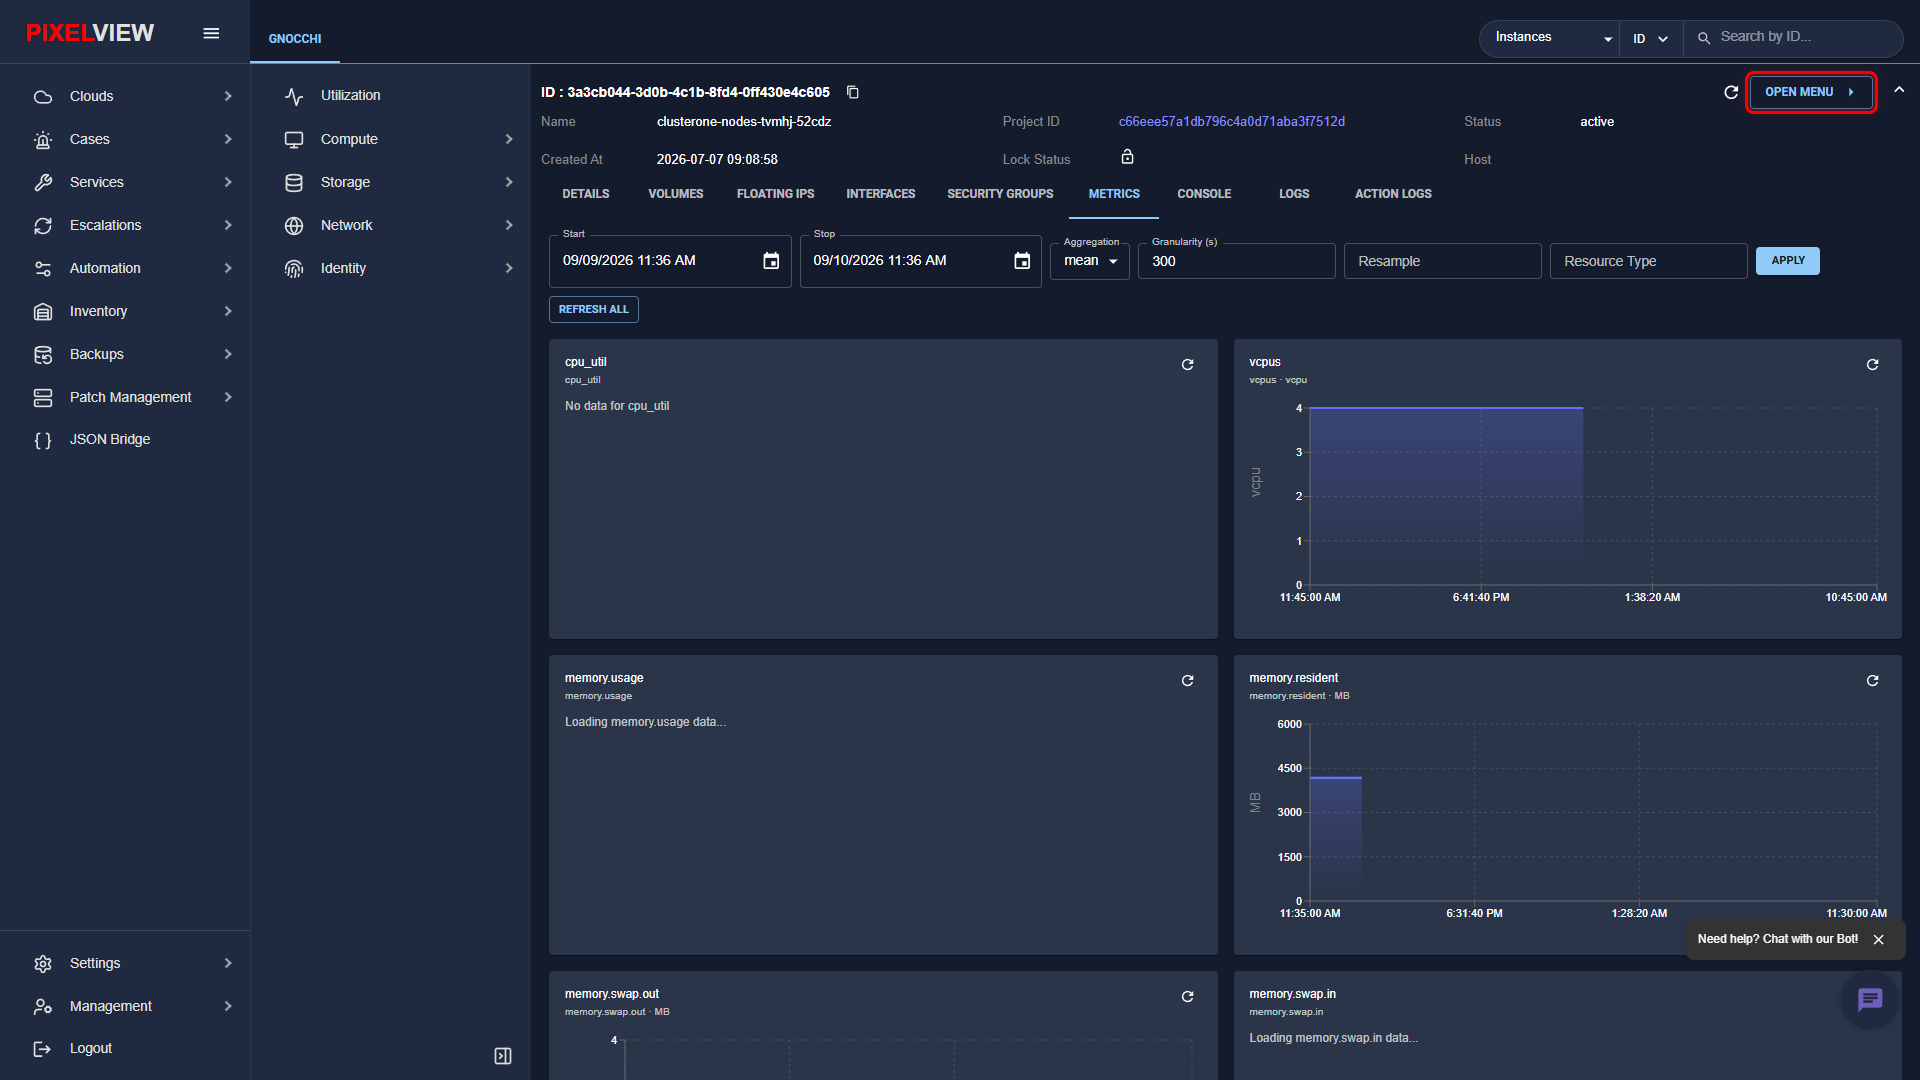
- Time Range Selector: Specify custom start and stop timestamps or preset observation windows.
- Aggregation & Granularity: Select statistical aggregation (
mean,max,min) and measurement granularity in seconds (e.g.,300s). - Telemetry Charts:
cpu_util: Percentage CPU consumption over time.vcpus: Active core allocation count.memory.usage: Total guest operating system memory footprint.memory.resident: Physical resident memory in hypervisor RAM.memory.swap.out&memory.swap.in: Virtual memory paging statistics.
System Console Boot Logs
Click the LOGS tab to inspect the instance console log output directly from the hypervisor:
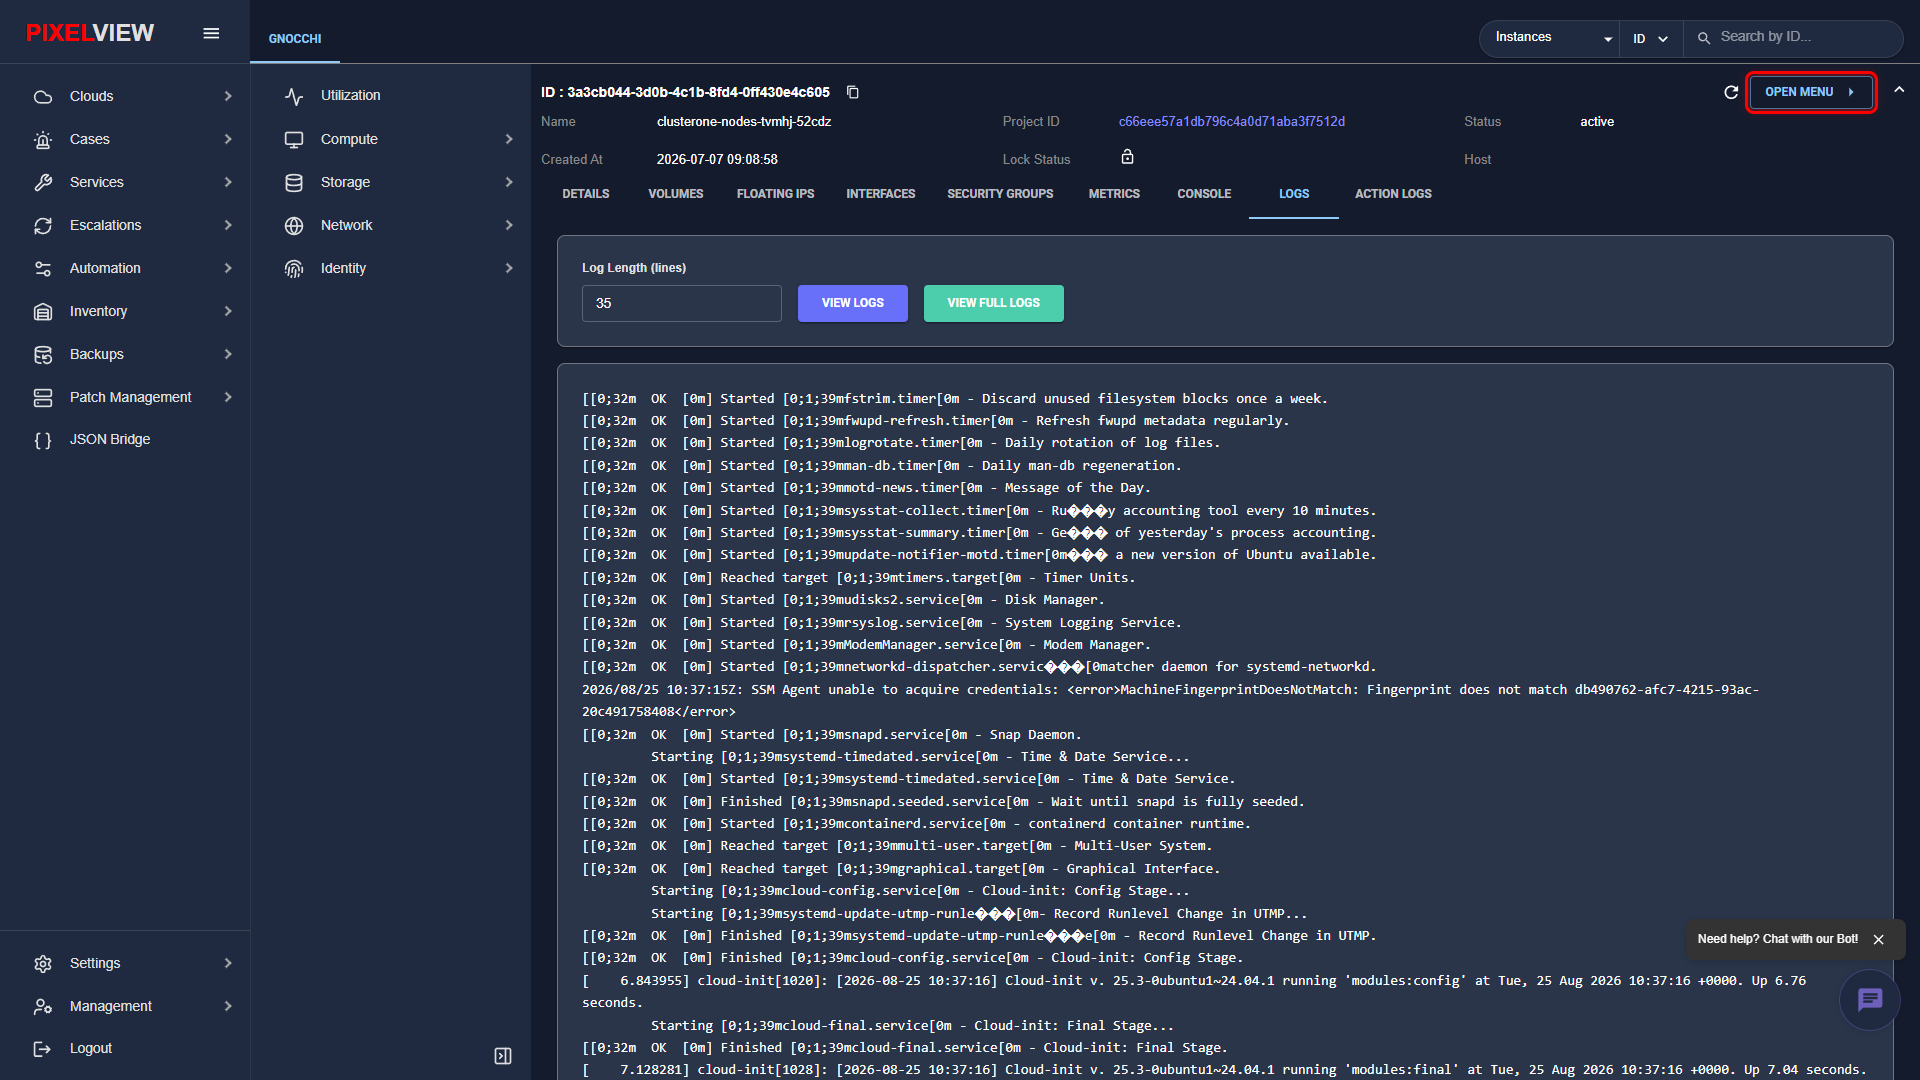
- Log Length (lines): Configurable line limit (e.g.,
35,100,500) to retrieve recent boot progress or diagnose kernel panics and cloud-init execution. - View Full Logs: Button to retrieve the entire historical serial console buffer.
Contextual Row Actions Menu
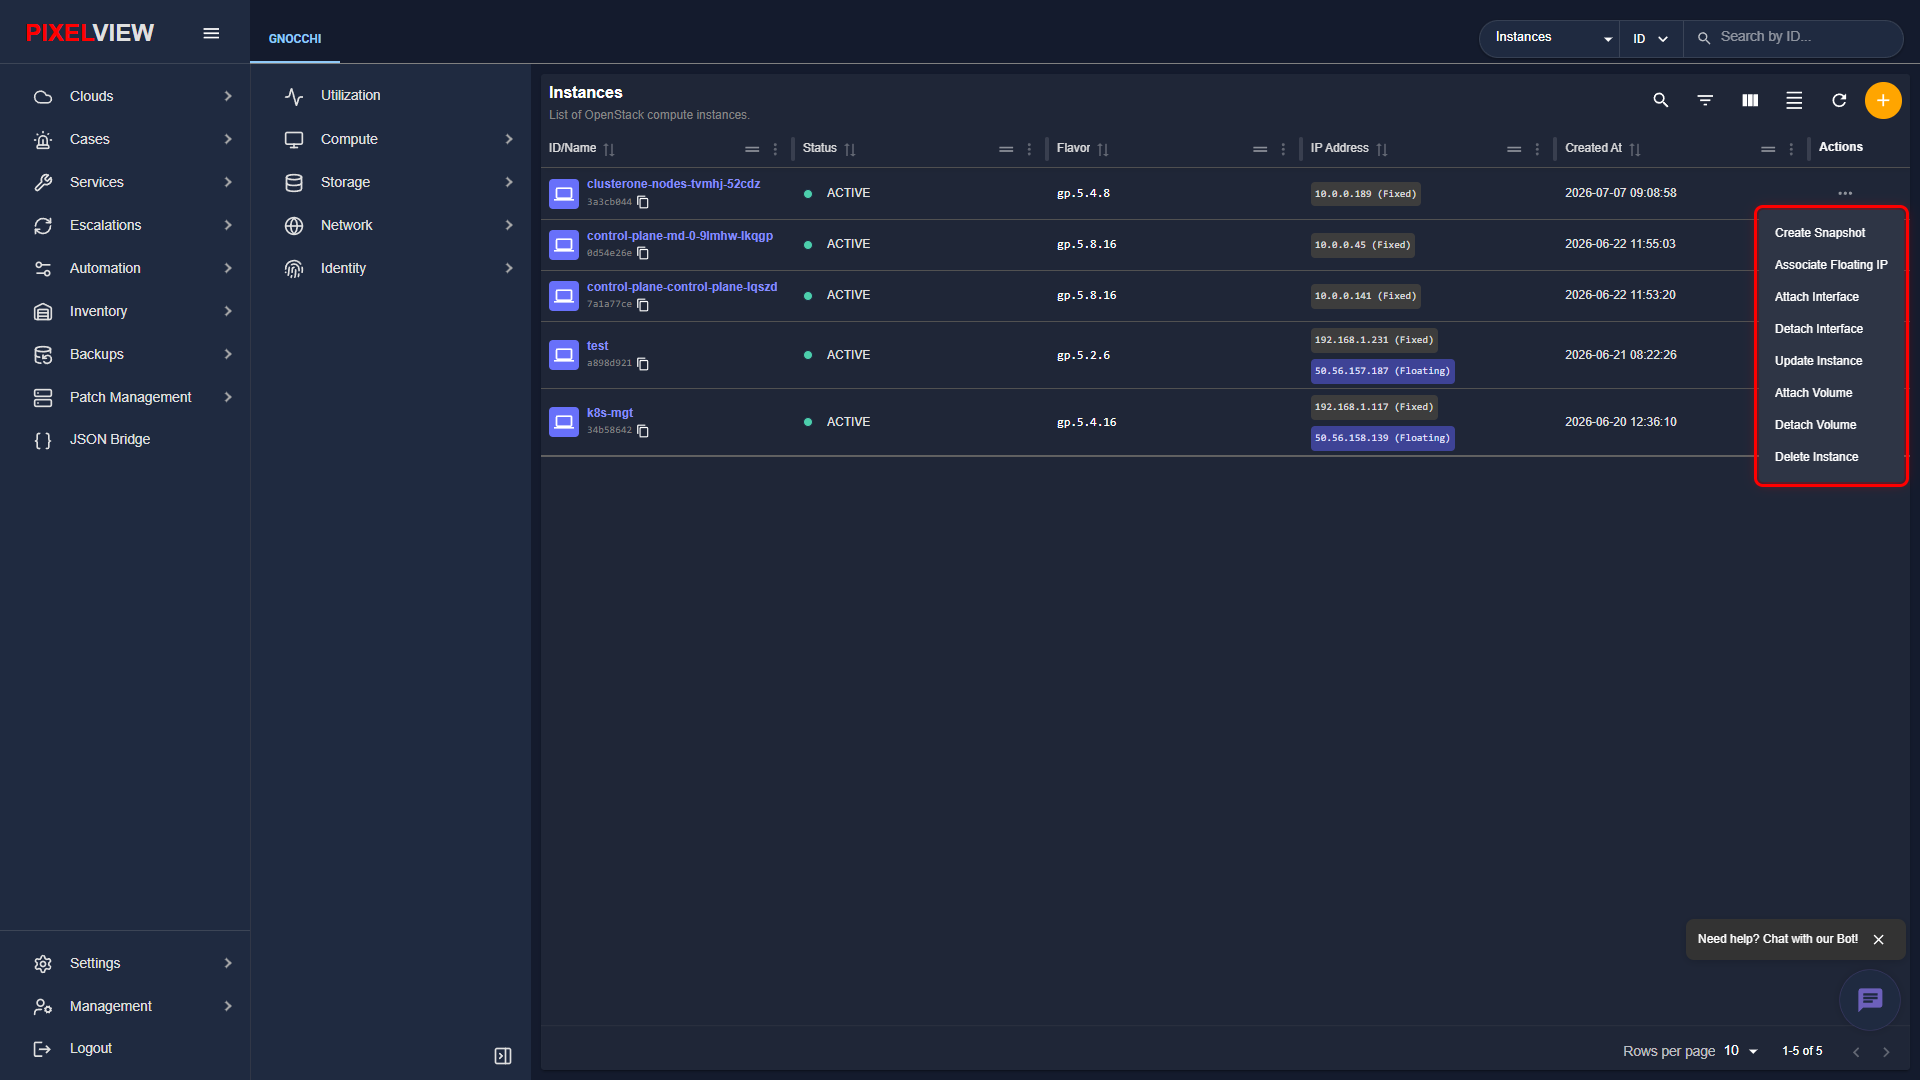
Within the main Instances table, clicking the three-dot (...) action button on any instance row opens the contextual row actions menu:
Updating an Instance
Selecting Update Instance from the contextual row actions menu opens the configuration modal to rename the instance without rebooting:
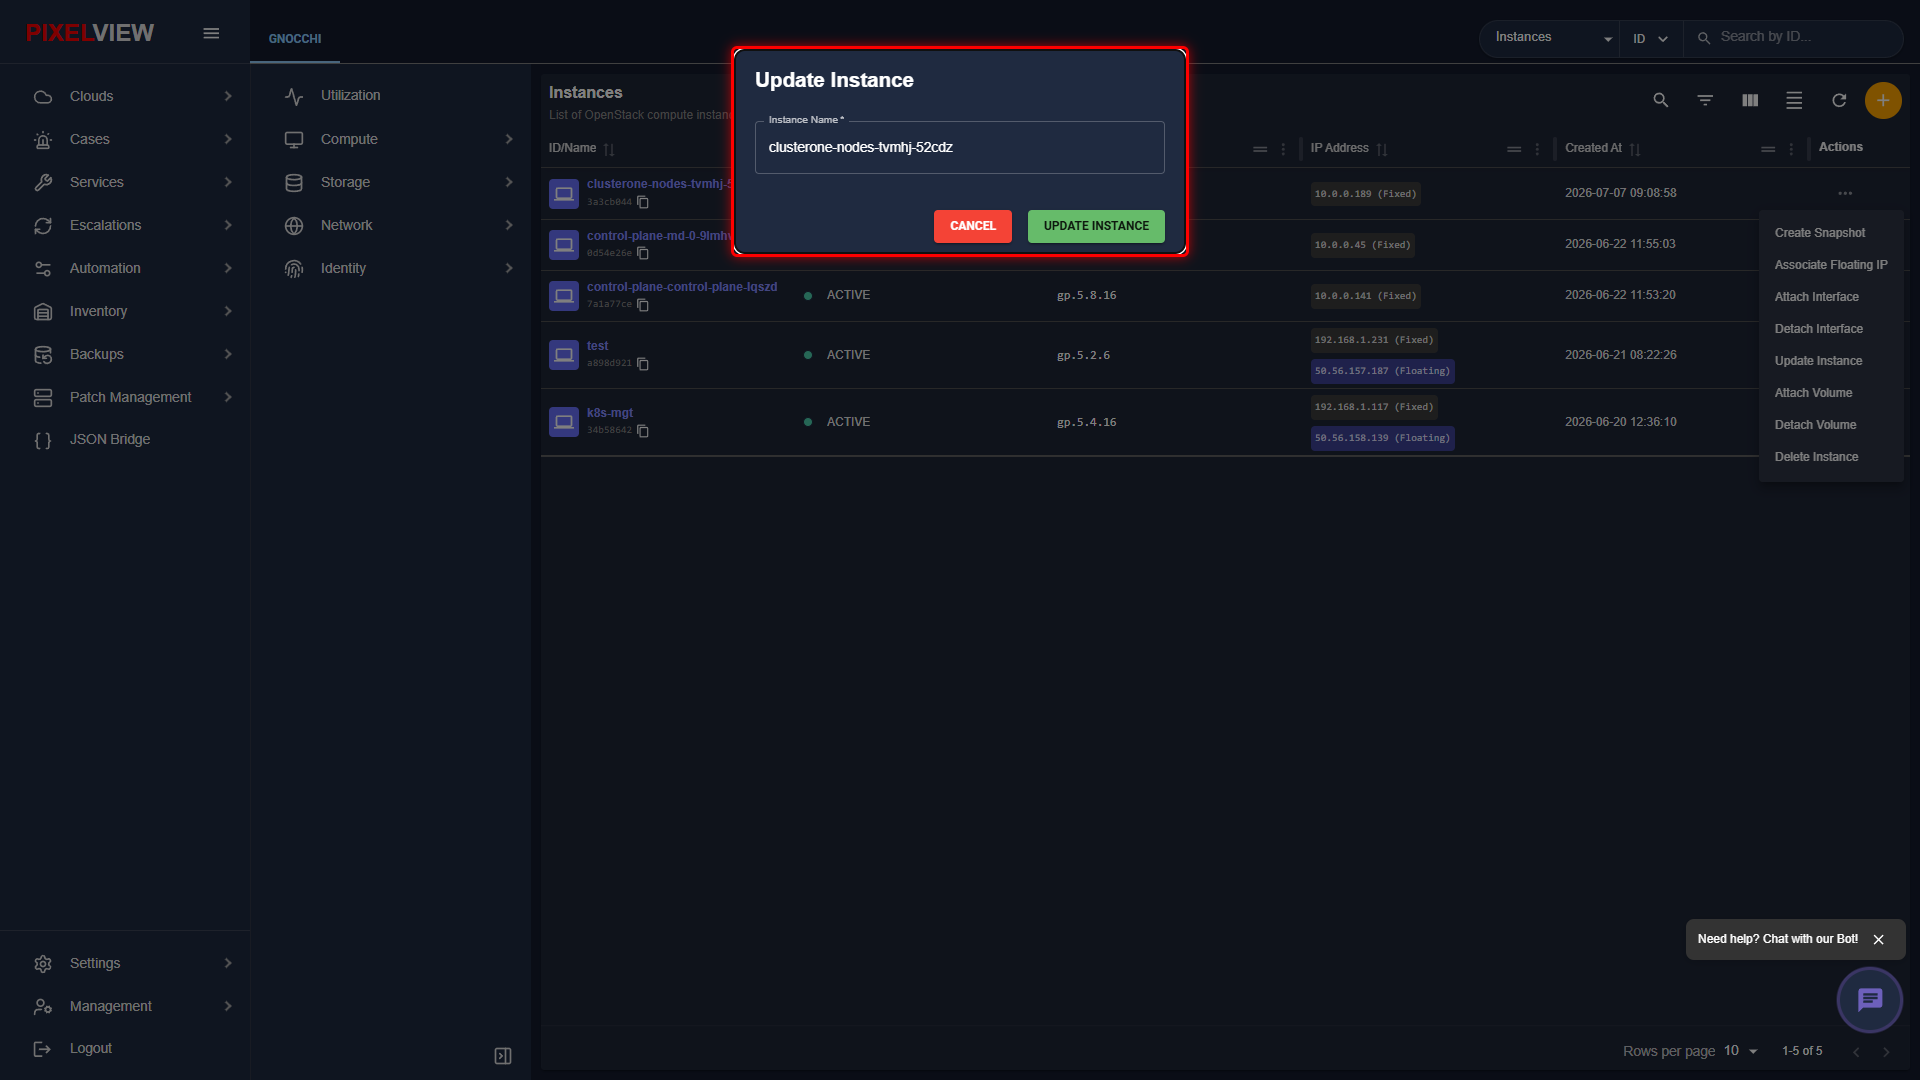
| Parameter | Type | Description |
|---|---|---|
| Instance Name | Required Text | Updated human-readable identifier for the compute virtual machine. |
Flavors (Hardware Sizing Profiles)
Flavors define virtual hardware sizing specifications, setting vCPU count, memory allocation, and ephemeral disk space.
Flavors Table Overview
Navigate to Compute → Flavors in the secondary sidebar:
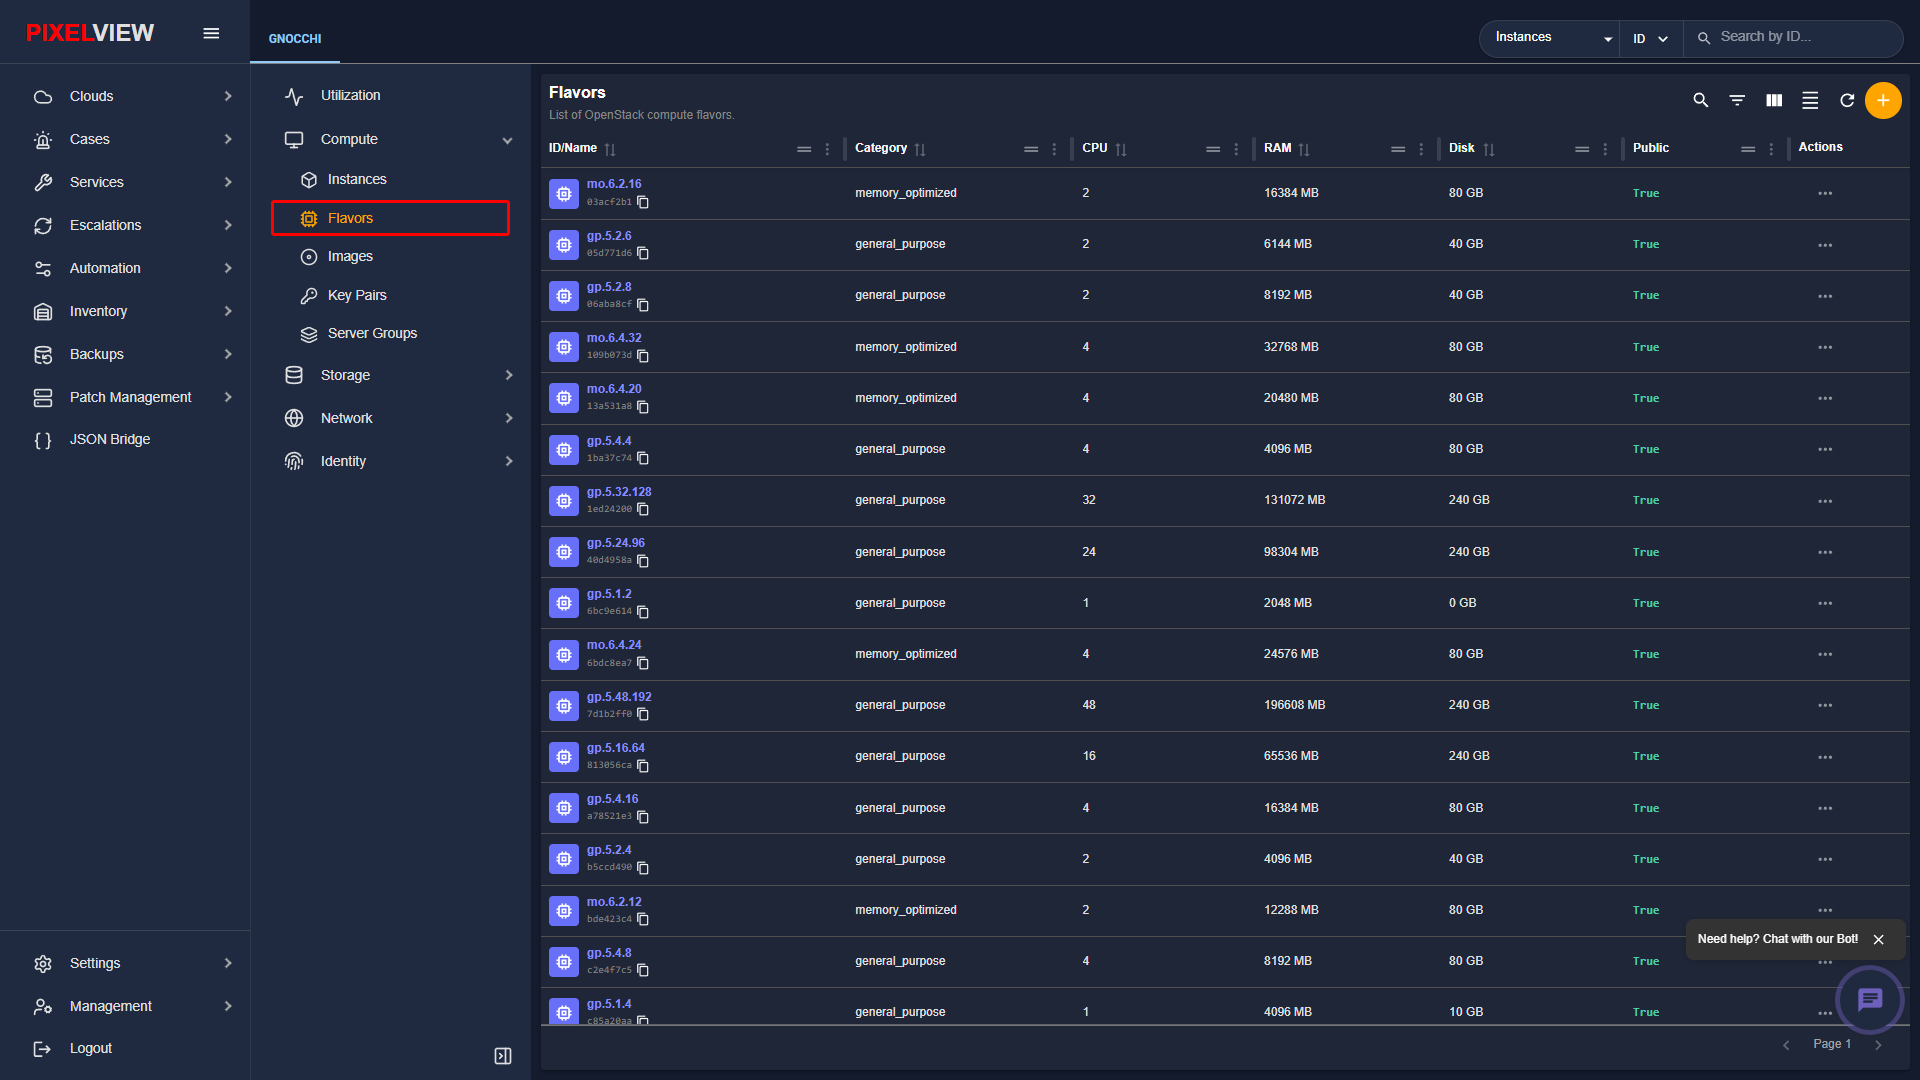
| Column | Description |
|---|---|
| ID / Name | Unique flavor profile identifier (e.g., gp.5.4.8, gp.5.8.16, mo.6.2.16). |
| VCPUs | Allocated virtual processor cores. |
| RAM | Memory allocation displayed in Megabytes (MB). |
| Root Disk | Primary operating system disk capacity in Gigabytes (GiB). |
| Ephemeral Disk | Temporary scratch disk capacity automatically wiped upon termination. |
| Swap | Swap partition size in Megabytes. |
| Public | Indicates whether the flavor is visible to all projects or restricted. |
Creating a Custom Flavor
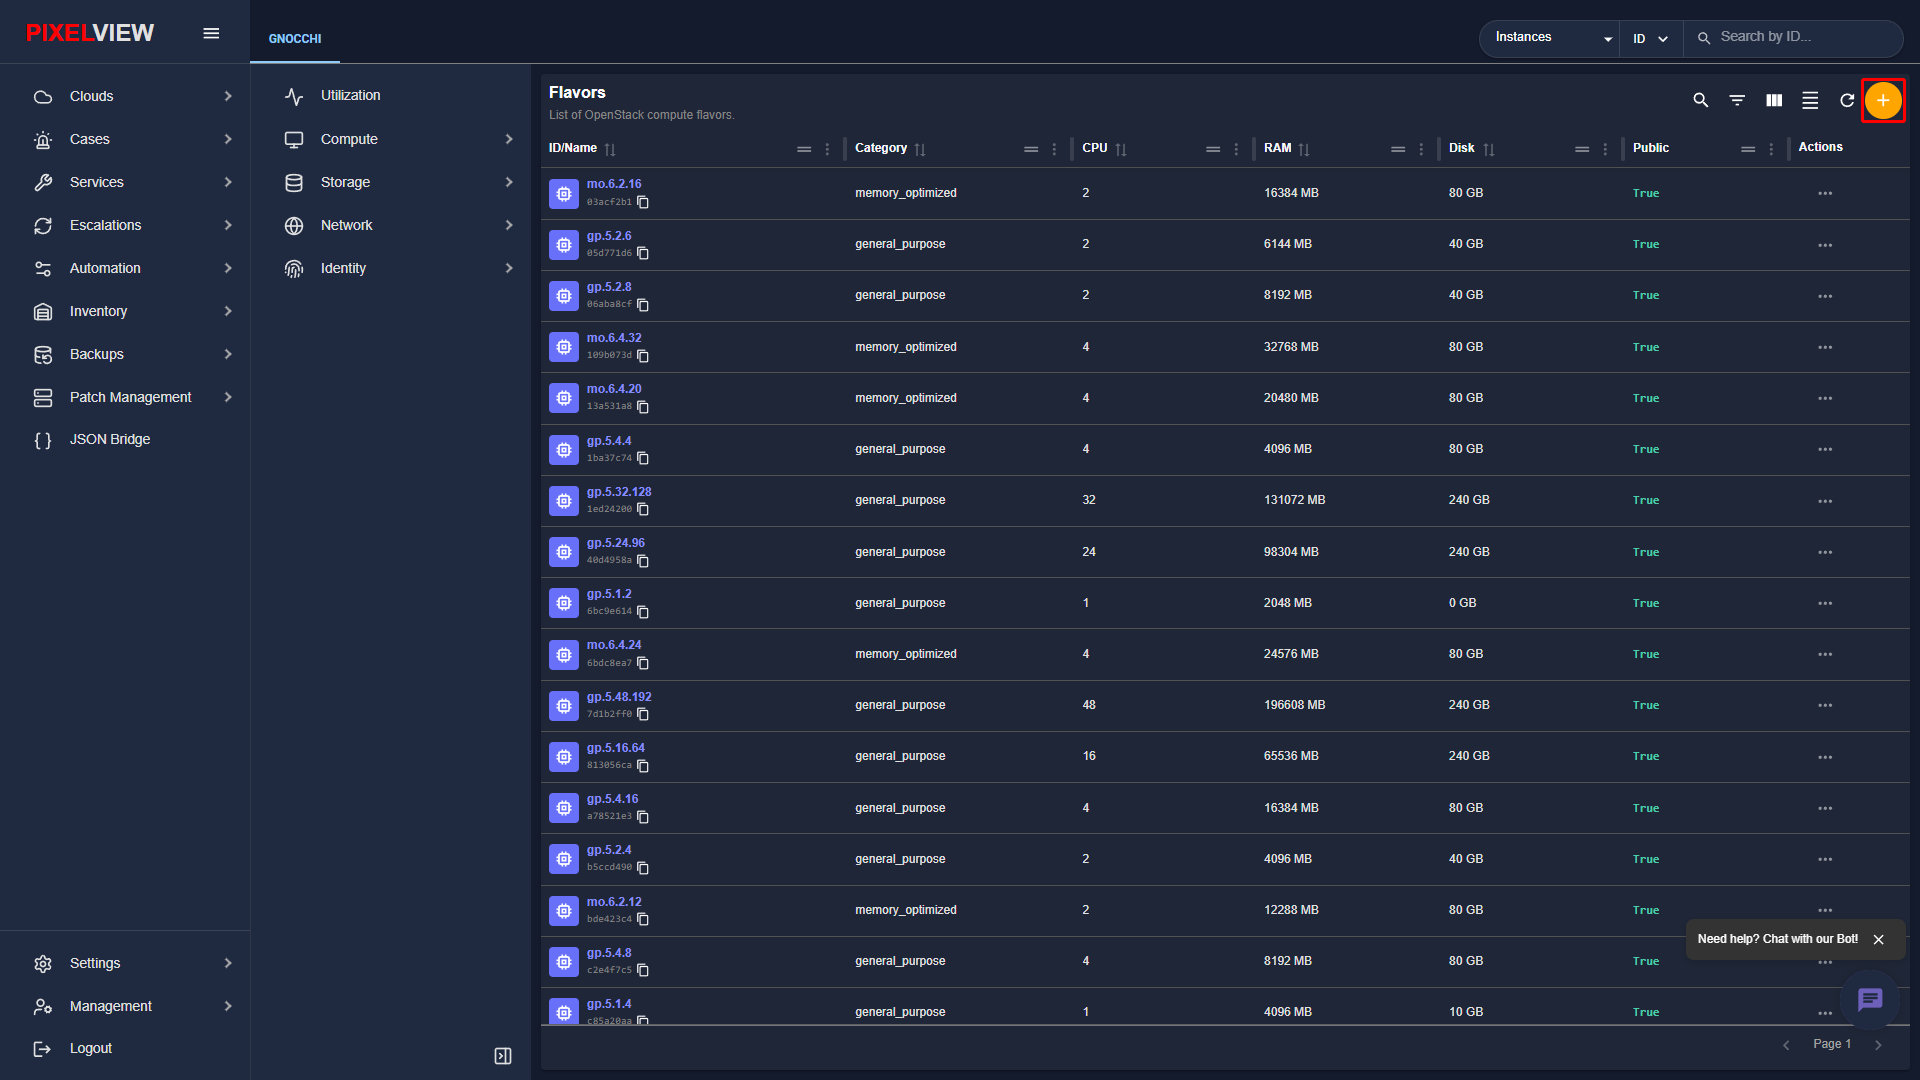
- Click the orange
+(Create Flavor) button in the top-right toolbar:
- The Create Flavor modal dialog opens:
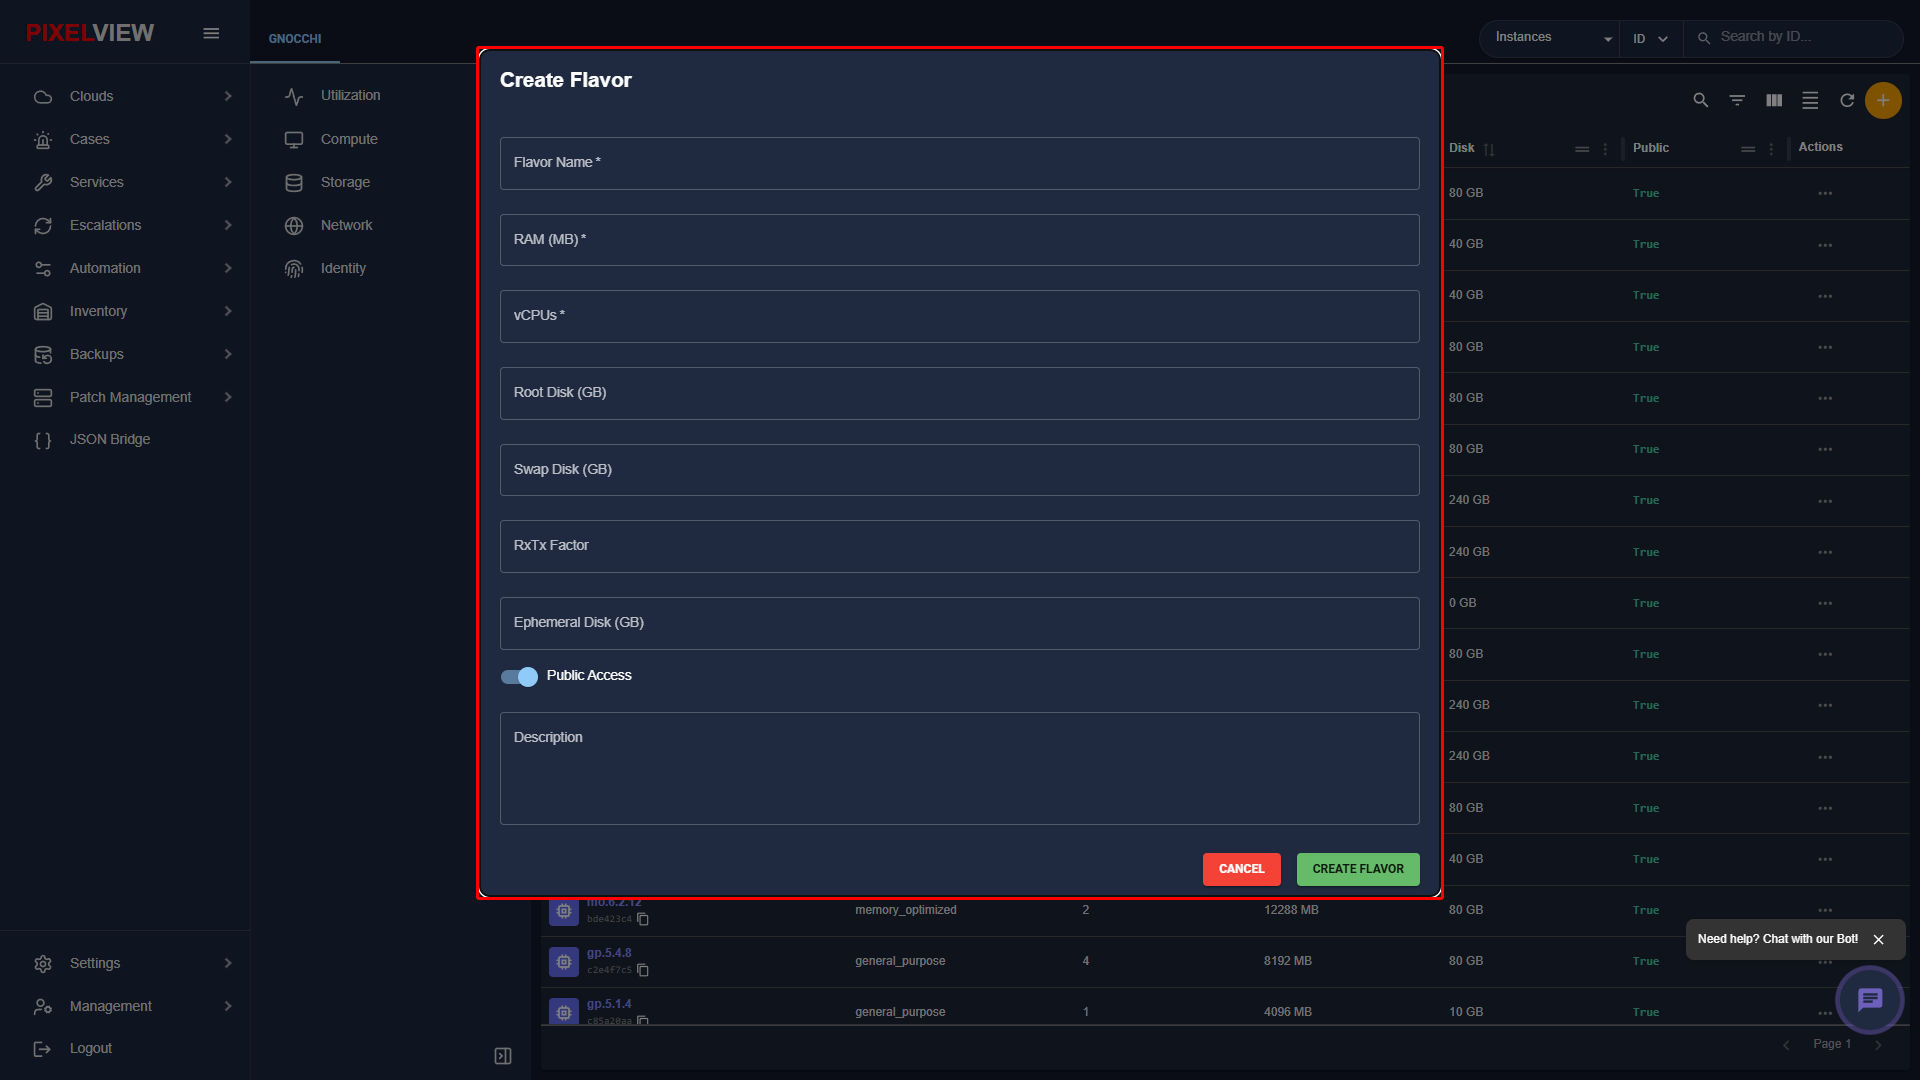
| Parameter | Type | Description |
|---|---|---|
| Flavor Name | Required Text | Name for the flavor (e.g., c2.large, m1.xlarge). |
| VCPUs | Required Number | Number of virtual cores assigned to the guest VM. |
| RAM (MB) | Required Number | Total memory allocated to the instance. |
| Root Disk (GiB) | Required Number | Size of the root filesystem disk. |
| Ephemeral Disk (GiB) | Optional Number | High-speed temporary scratch space. |
| Swap Disk (MB) | Optional Number | Swap space allocation. |
| Is Public | Checkbox | Enable to make this flavor available across all tenant accounts. |
Images (Glance)
The Images catalog (/openstack/:regionName/images) provides centralized management of base operating system images, cloud-init templates, and custom system snapshots.
Images Table Overview
Navigate to Compute → Images in the secondary sidebar:
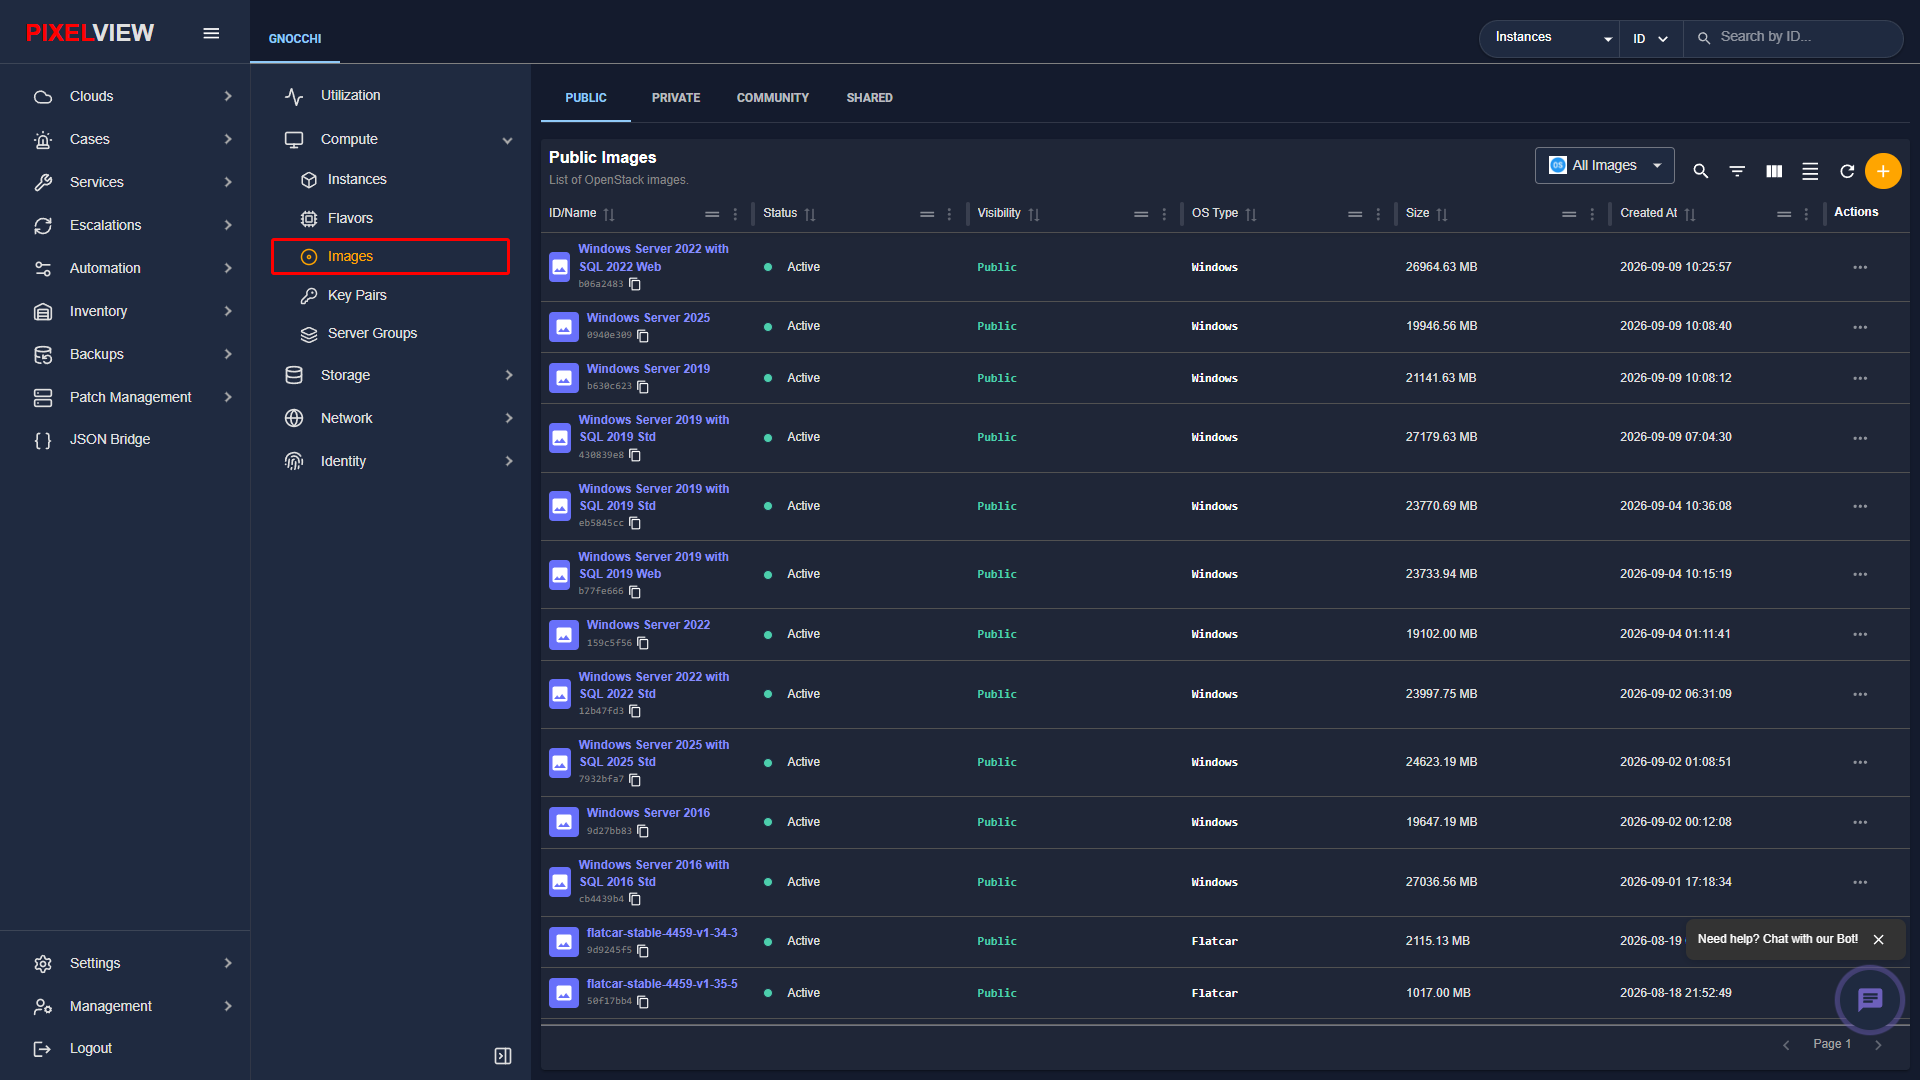
The table organizes images across scope tabs (Public, Private, Community, Shared):
| Column | Description |
|---|---|
| ID / Name | Operating system release name (e.g., Windows Server 2022, flatcar-stable) and system UUID. |
| Status | Image readiness state: Active, Saving, Queued, or Killed. |
| Visibility | Access scope: Public (available across all projects) or Private (restricted to current project). |
| Format | Disk container format (RAW, QCOW2, ISO, VMDK). |
| Size | Storage consumption of the image payload. |
| Actions | Context actions to launch instance directly, download image metadata, or delete obsolete builds. |
Creating / Uploading an Image
- Click the orange
+(Create Image) button in the top-right toolbar:
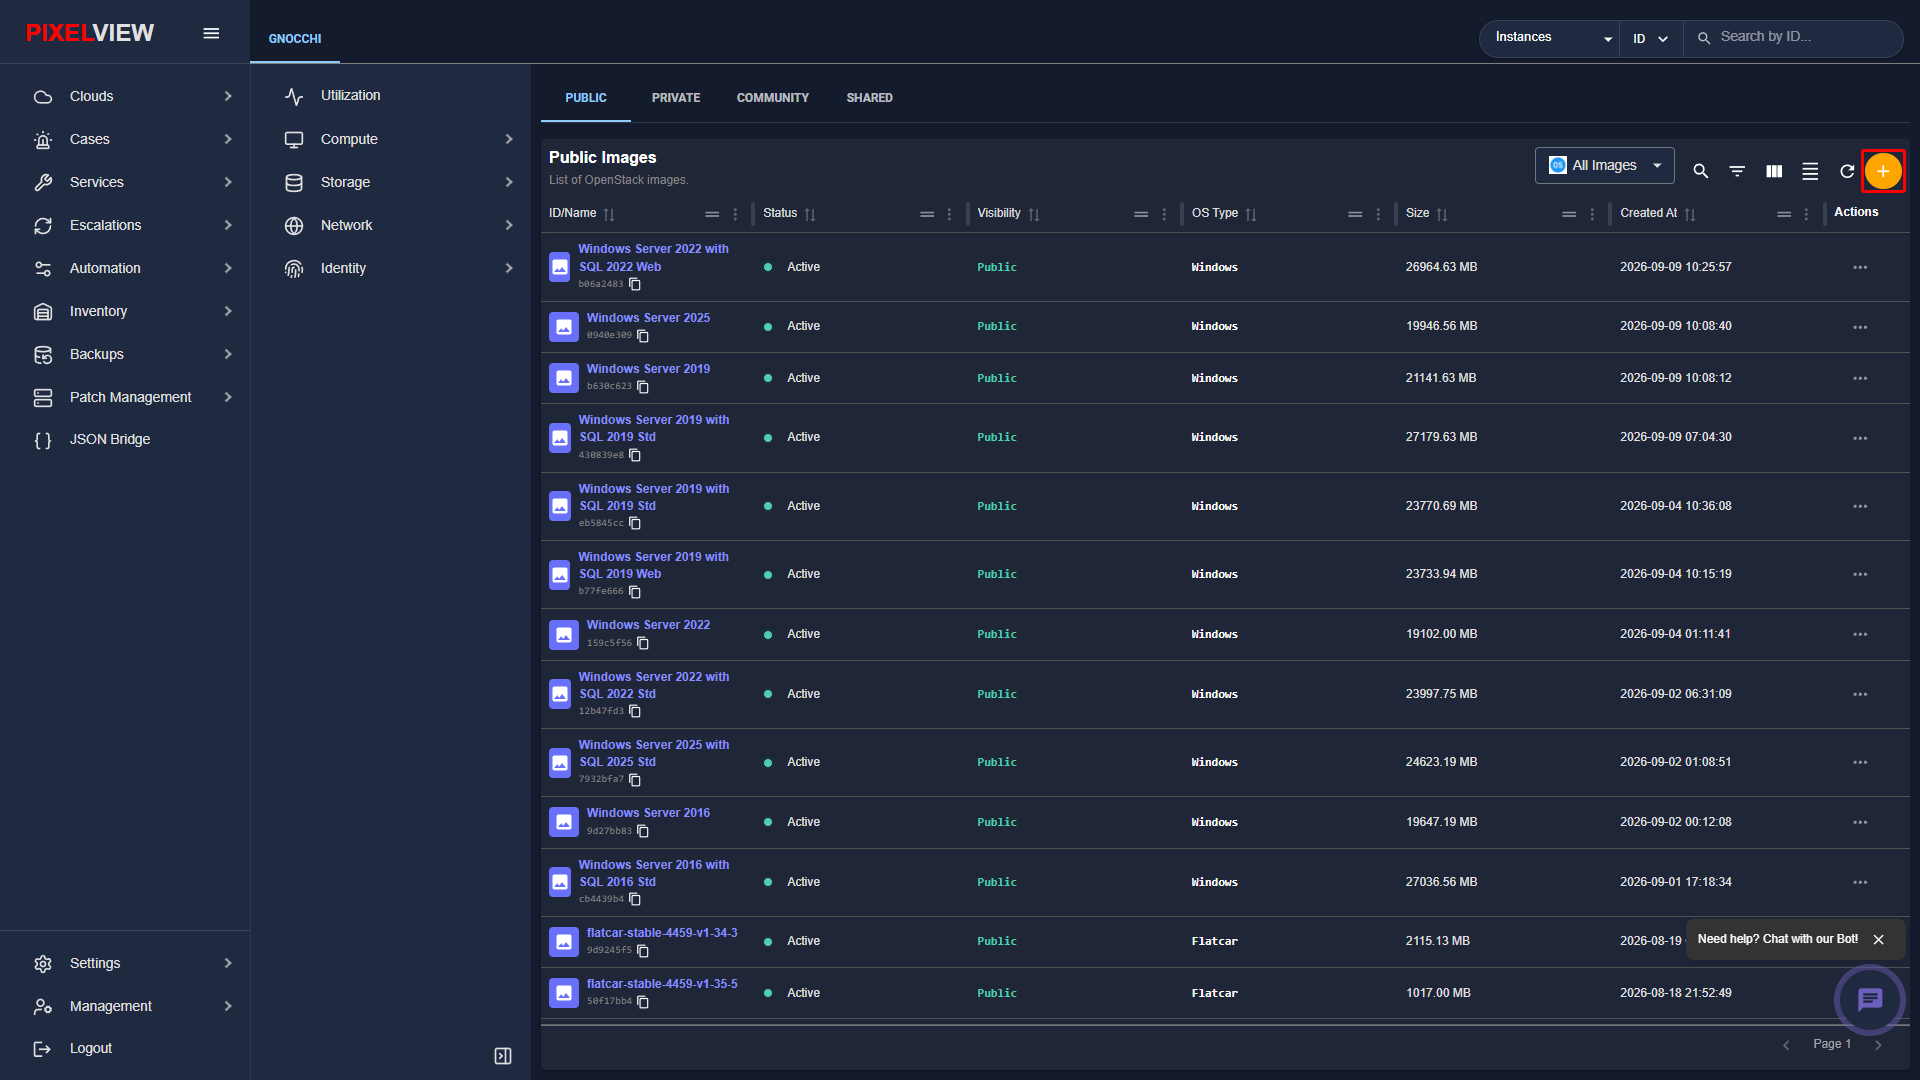
- The Create Image modal dialog opens:
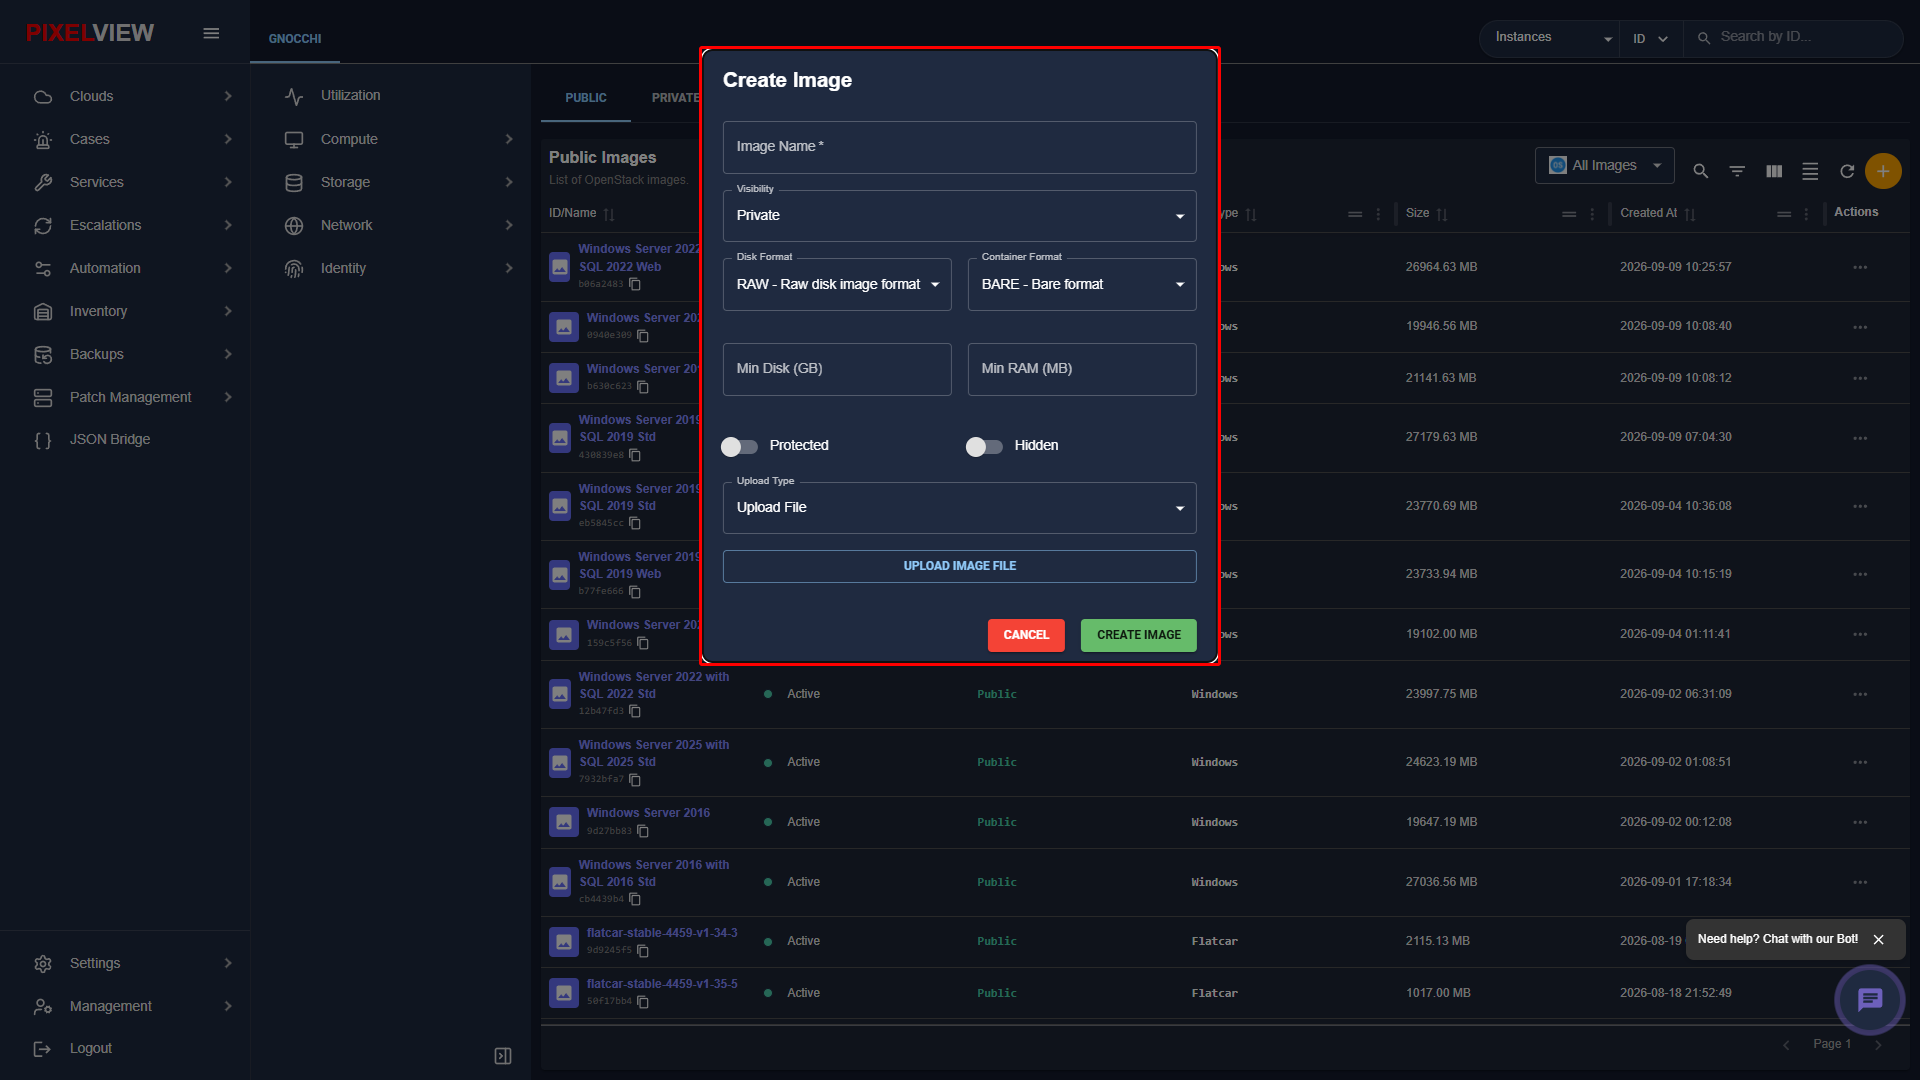
| Parameter | Type | Description |
|---|---|---|
| Image Name | Required Text | Descriptive display name for the template. |
| Image Description | Optional Text | Build notes, OS patch level, and kernel version. |
| Source Type | Dropdown | File (direct binary upload) or URL (remote HTTP/S download). |
| Format | Dropdown | File type specification (RAW, QCOW2, ISO). |
| Minimum Disk (GiB) | Number | Minimum root disk capacity required by the guest OS. |
| Minimum RAM (MB) | Number | Minimum memory required to boot. |
| Visibility | Selection | Set to Public, Private, or Shared. |
| Architecture | Text | Target CPU architecture (x86_64, aarch64). |
Images Contextual Row Actions
In the Images catalog, clicking the three-dot (...) button reveals row-level image actions:
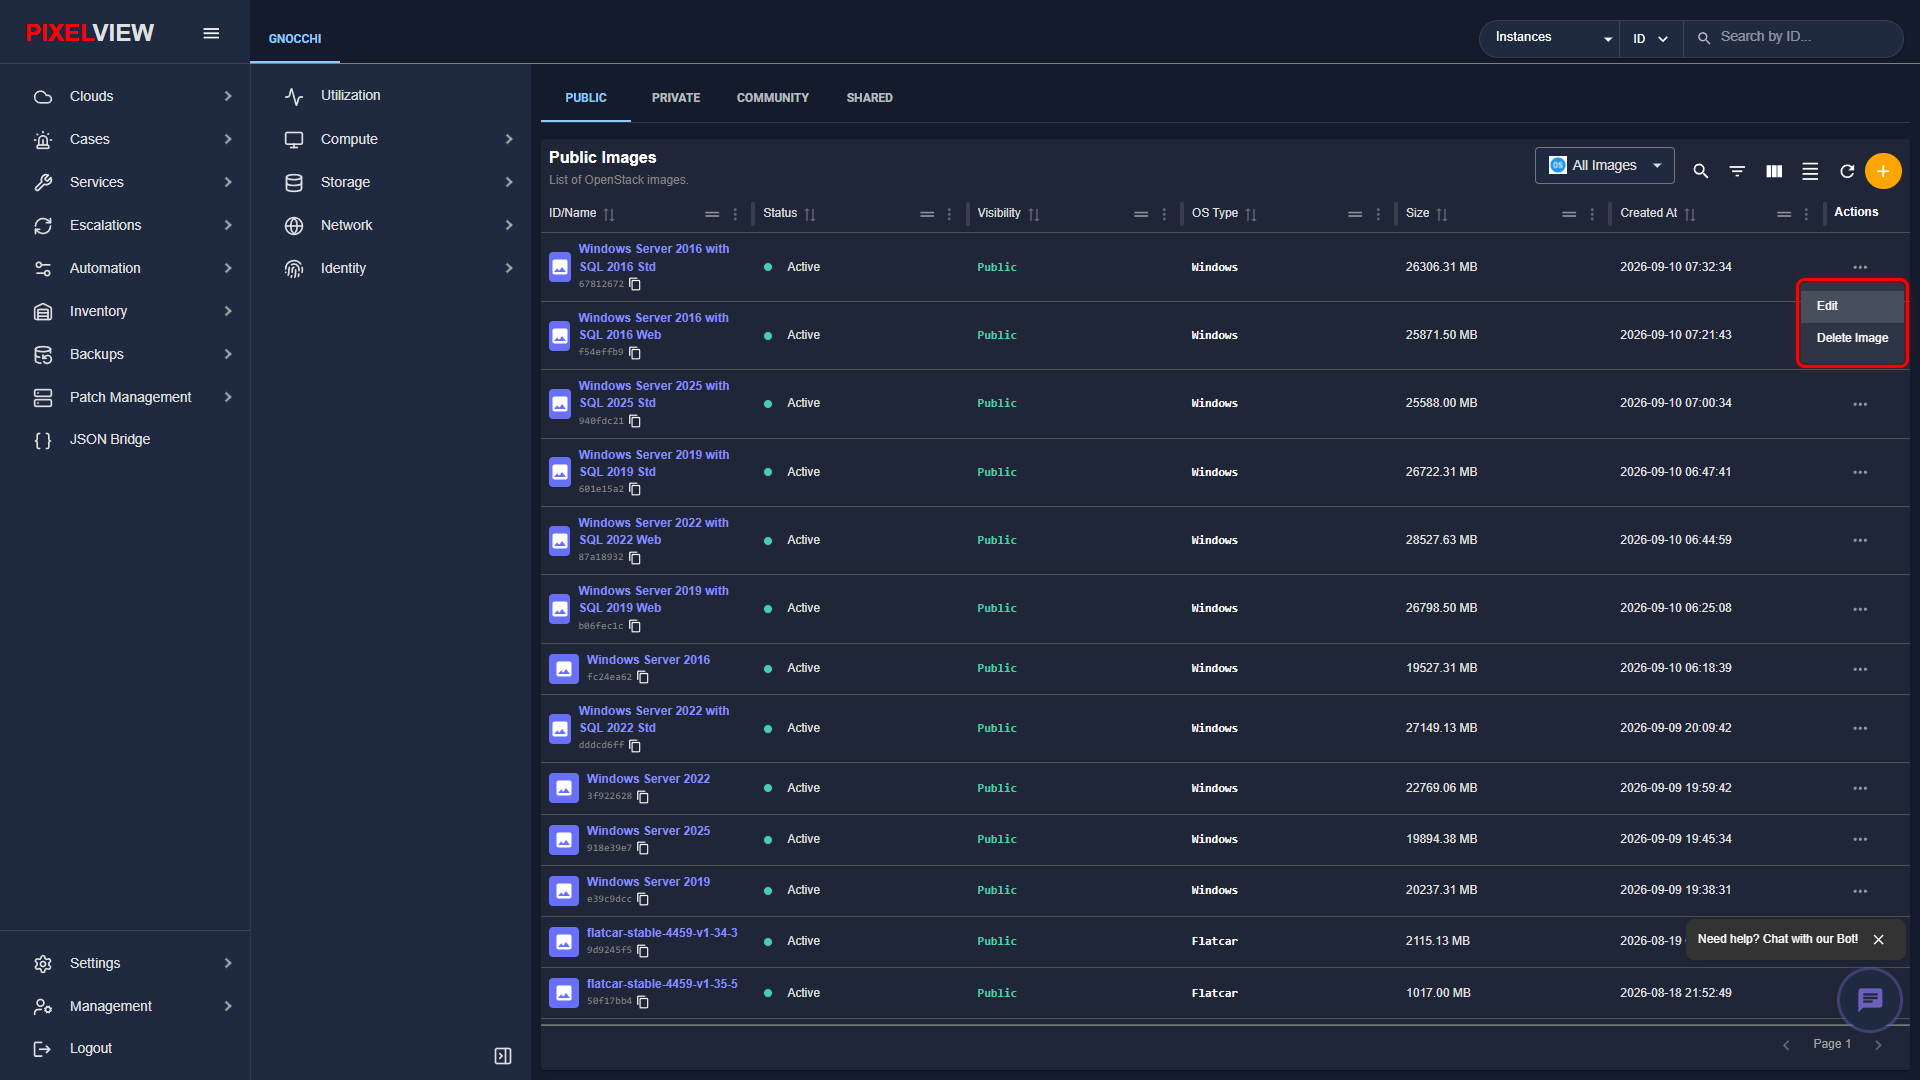
Key Pairs (SSH Credentials)
Key pairs provide cryptographic SSH public key injection into virtual machines at launch time, ensuring passwordless root/admin login without hardcoded secrets.
Key Pairs Table Overview
Navigate to Compute → Key Pairs in the secondary sidebar:
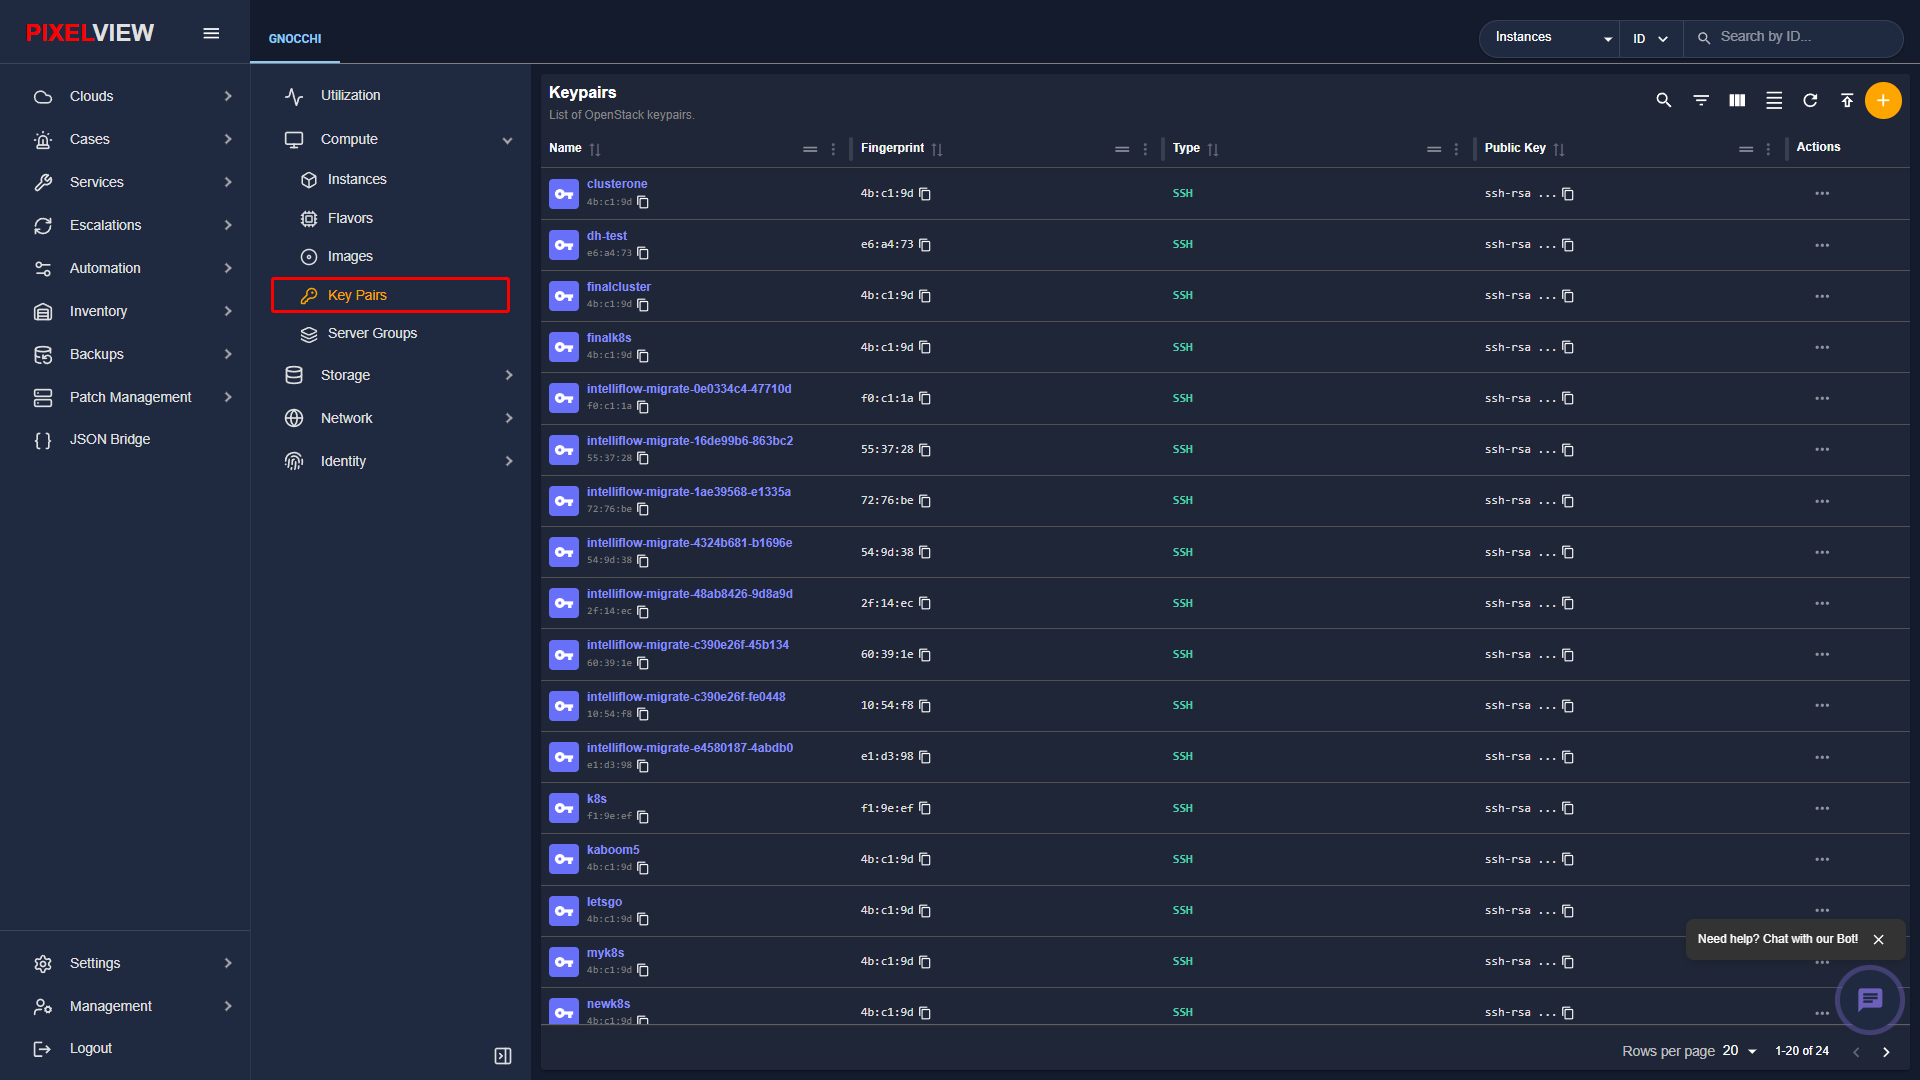
| Column | Description |
|---|---|
| Name | Display name for the SSH key pair. |
| Fingerprint | Cryptographic SHA256 or MD5 hash fingerprint verifying key authenticity. |
| Type | Key algorithm (ssh-rsa, ssh-ed25519). |
| Actions | Download public key or delete key pair. |
Creating / Importing a Key Pair
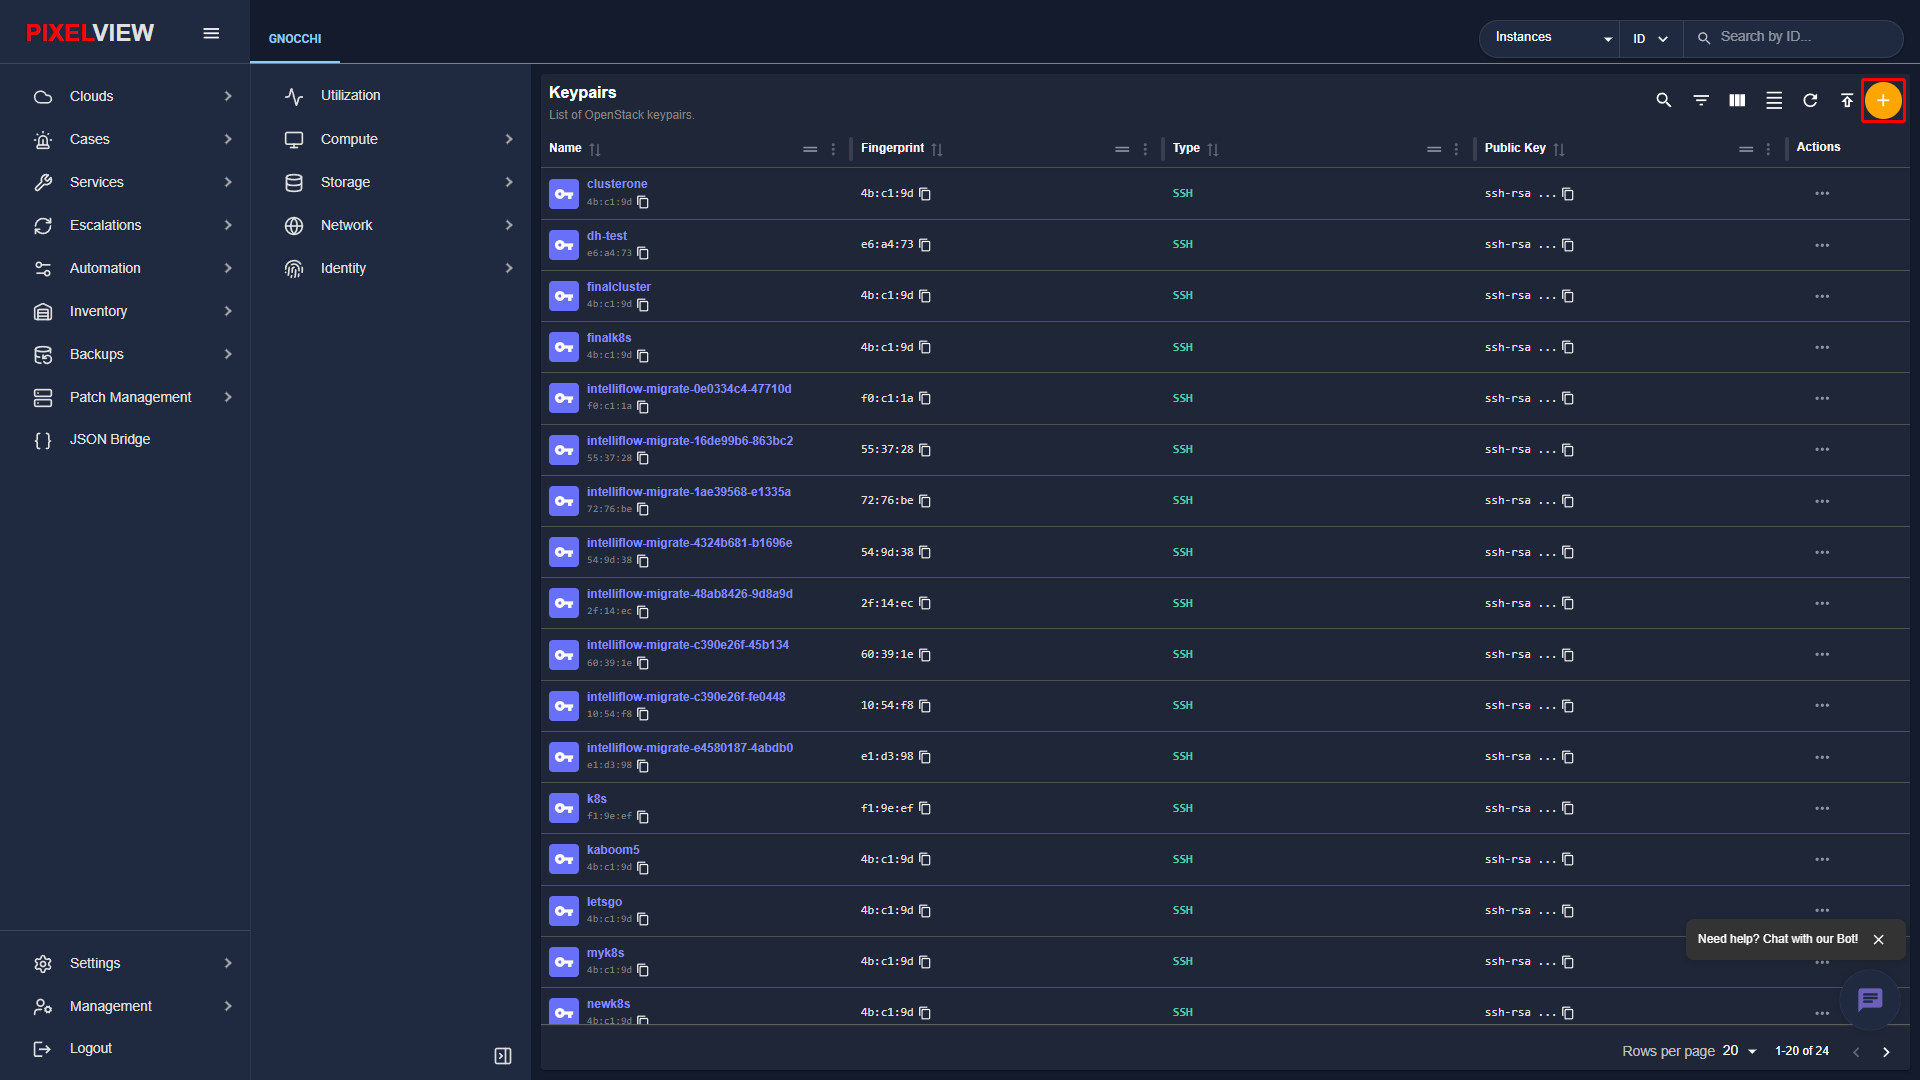
- Click the orange
+(Create Keypair) button in the top-right toolbar:
- The Create Keypair modal dialog opens:
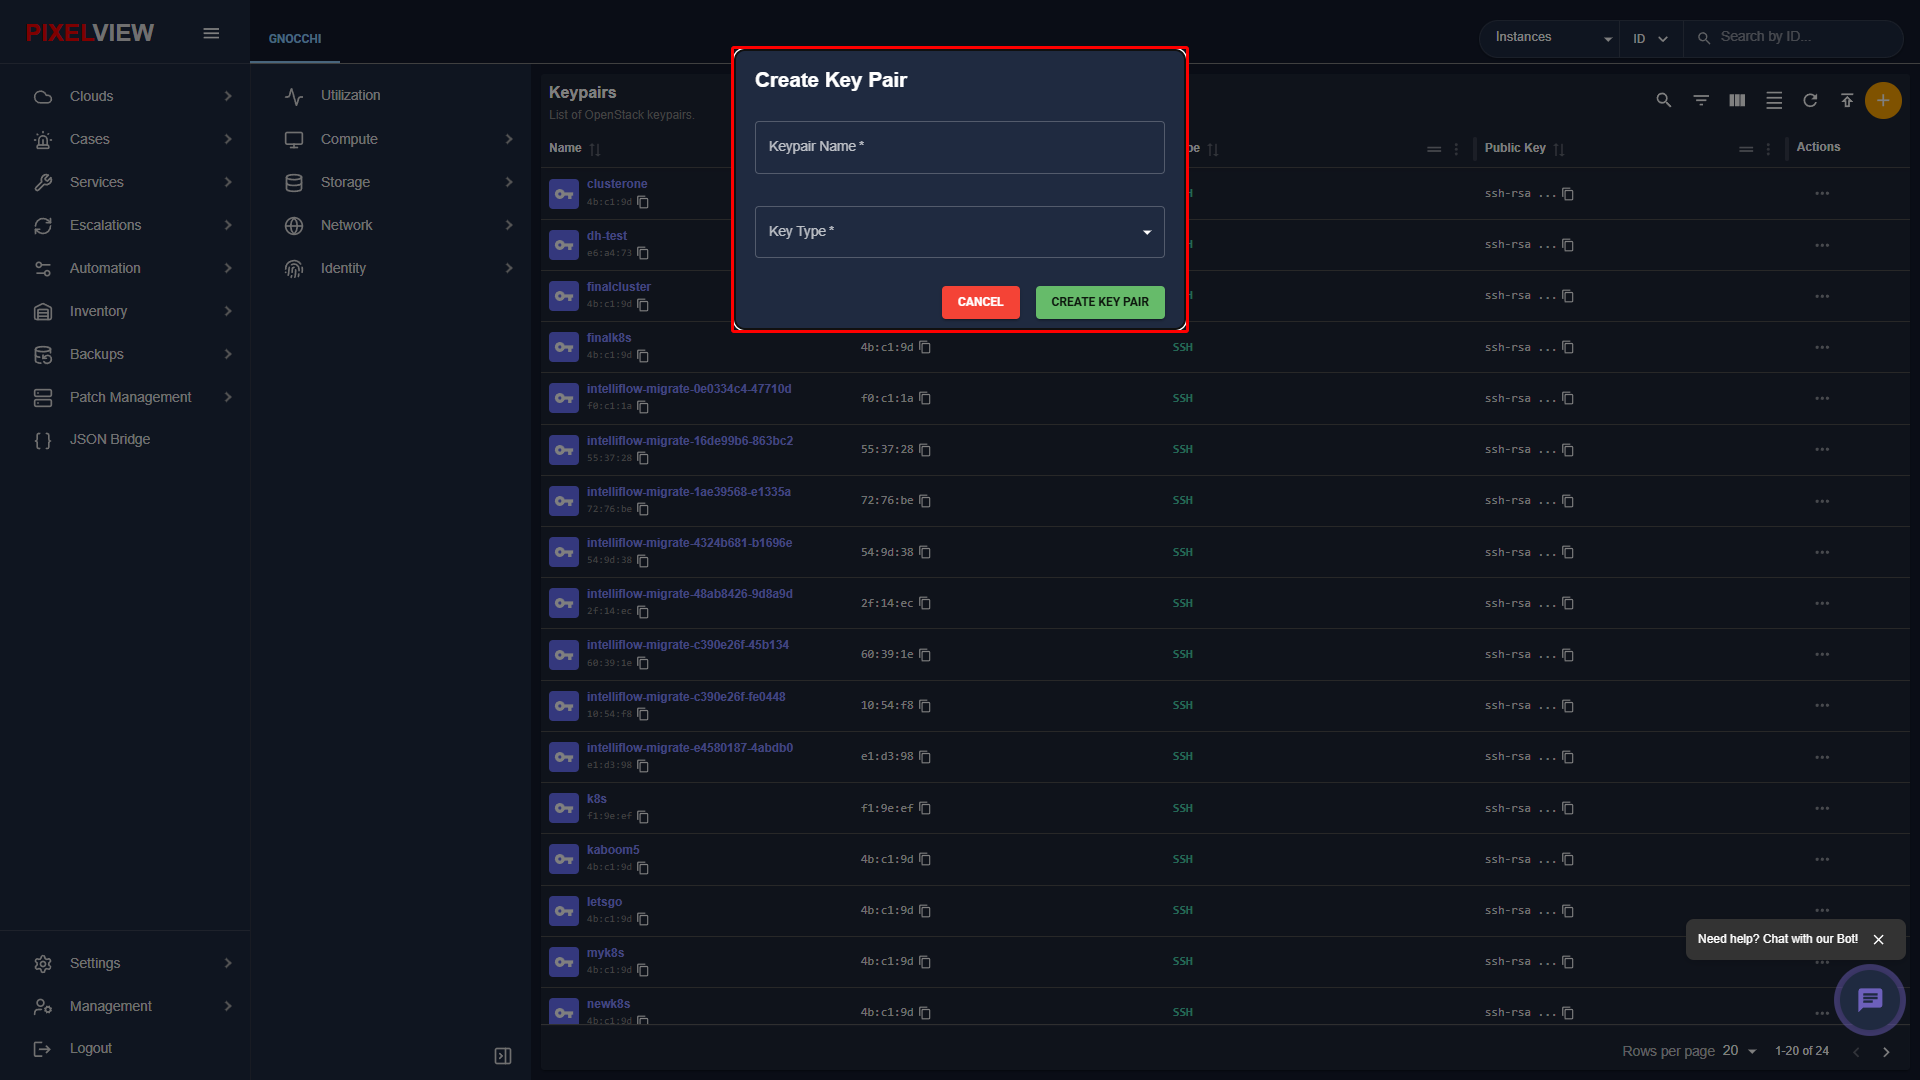
| Parameter | Type | Description |
|---|---|---|
| Keypair Name | Required Text | Label identifying the keypair (e.g., devops-admin-key). |
| Key Type | Selection | SSH Key (Standard) or X509 Certificate. |
| Public Key | Textarea (Optional) | Paste an existing public key (ssh-ed25519 AAA...) to import. Leave blank to have OpenStack generate a new private key for immediate download. |
Key Pairs Contextual Row Actions
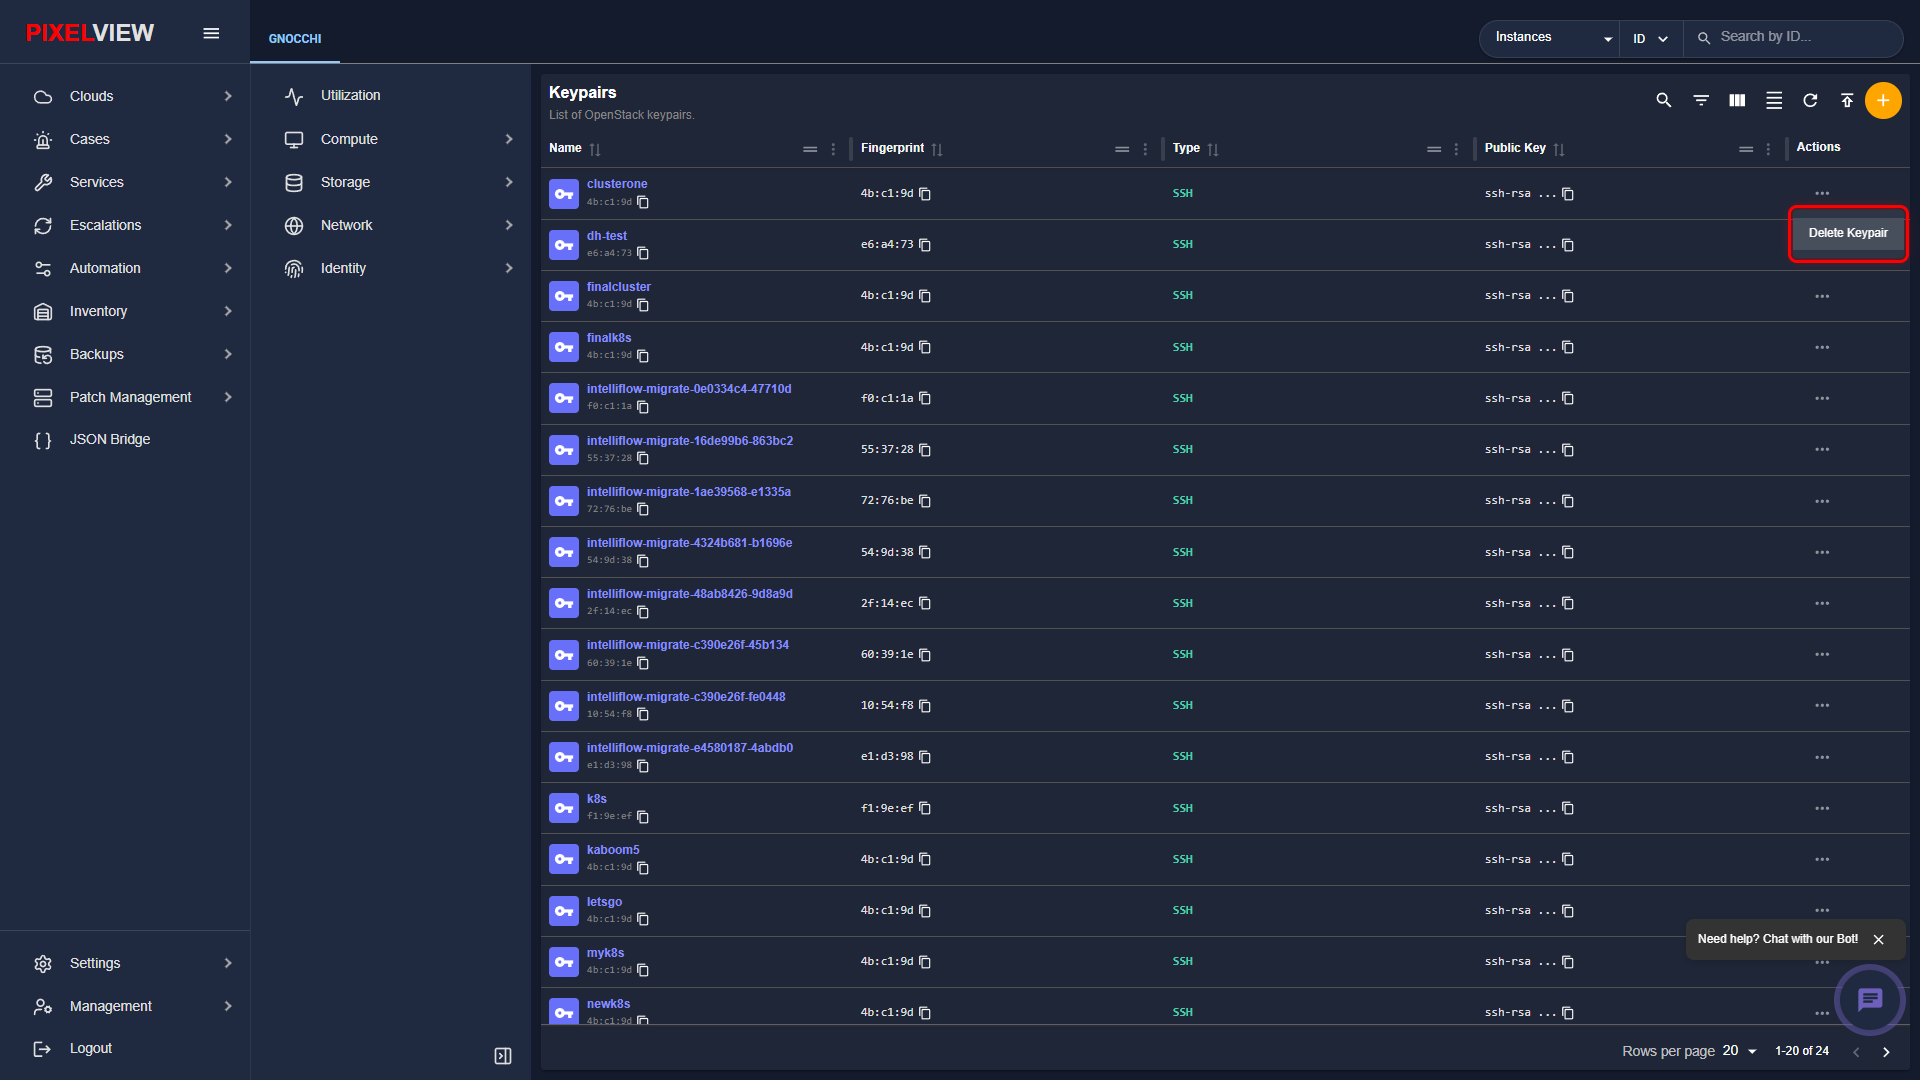
Clicking the three-dot (...) button on a key pair row displays contextual actions:
Server Groups (Placement & Anti-Affinity)
Server Groups enforce hardware-level placement policies, ensuring redundant instances reside on distinct physical hypervisors for fault tolerance.
Server Groups Table Overview
Navigate to Compute → Server Groups in the secondary sidebar:
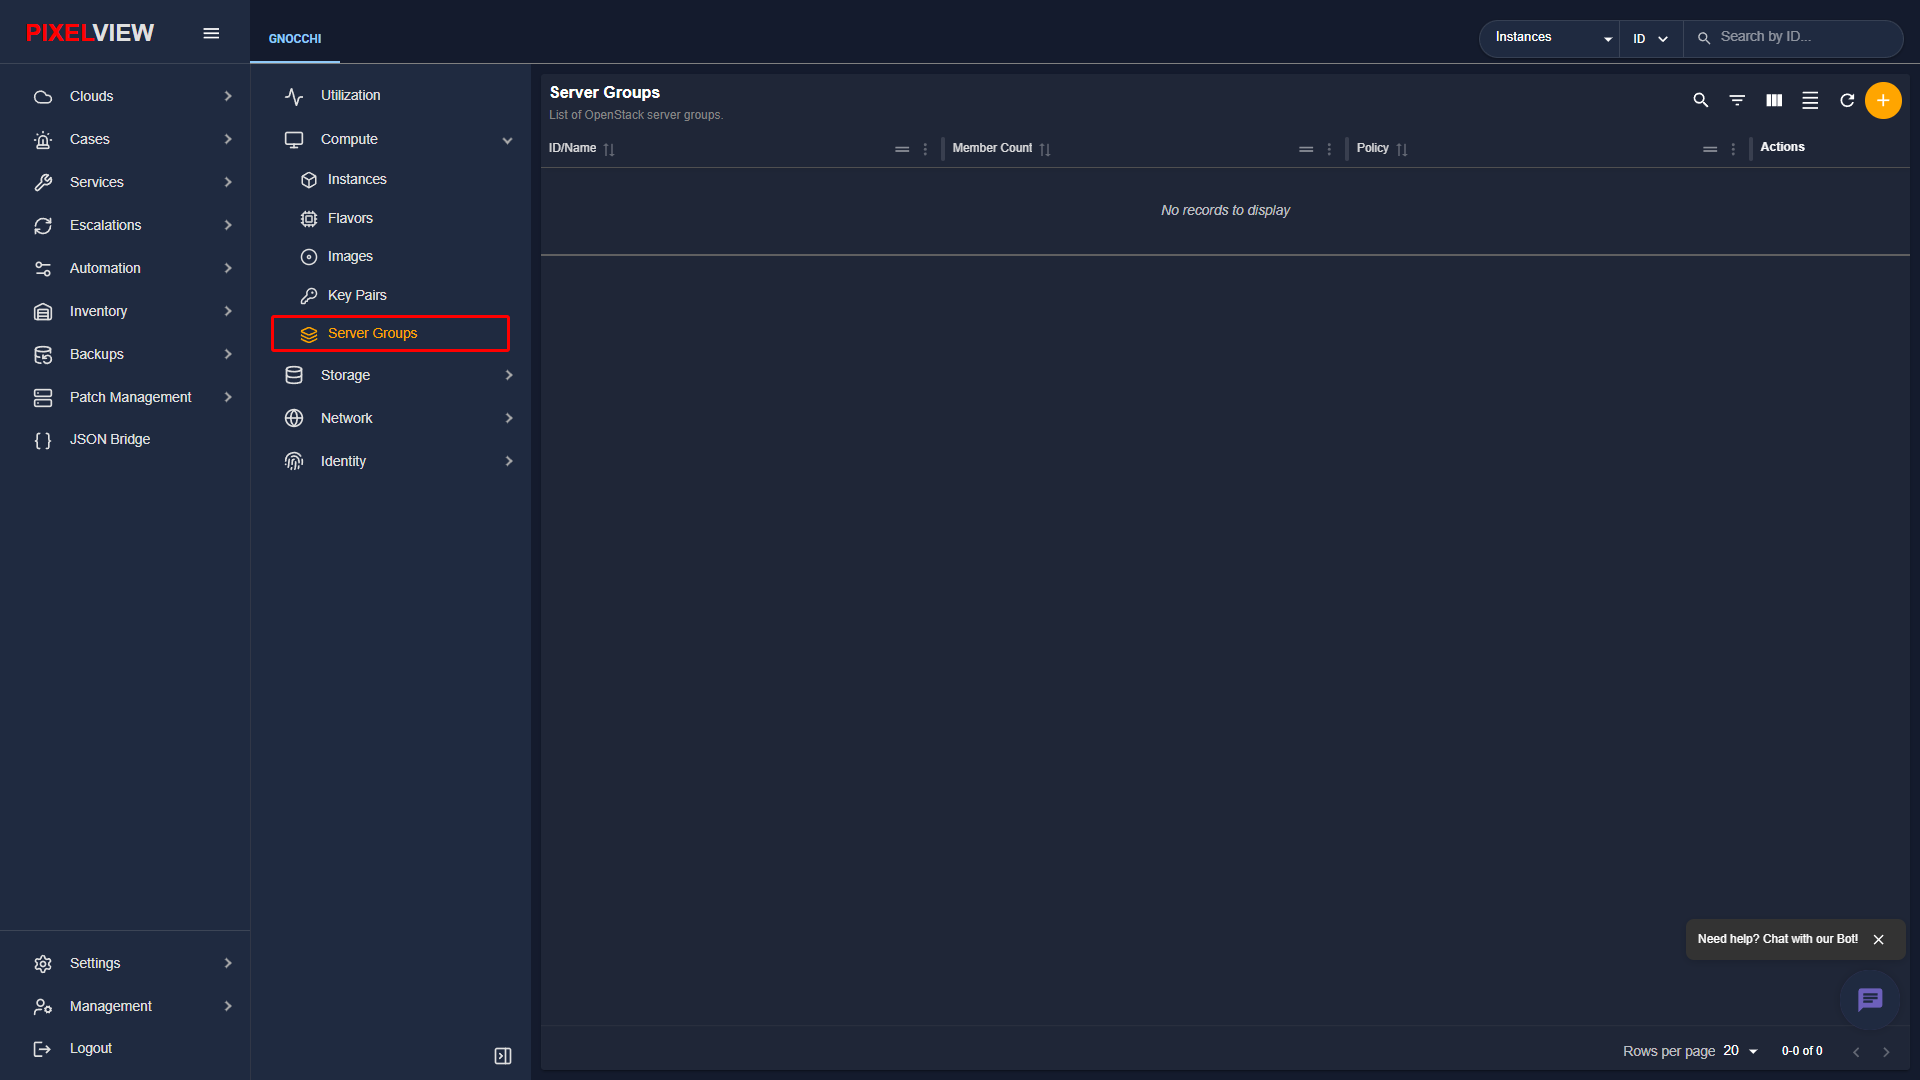
| Column | Description |
|---|---|
| ID / Name | Server group name and UUID. |
| Policy | Placement rule: anti-affinity, soft-anti-affinity, affinity, or soft-affinity. |
| Members | List of instance UUIDs currently assigned to the server group. |
| Actions | Delete server group or modify policy rules. |
Creating a Server Group
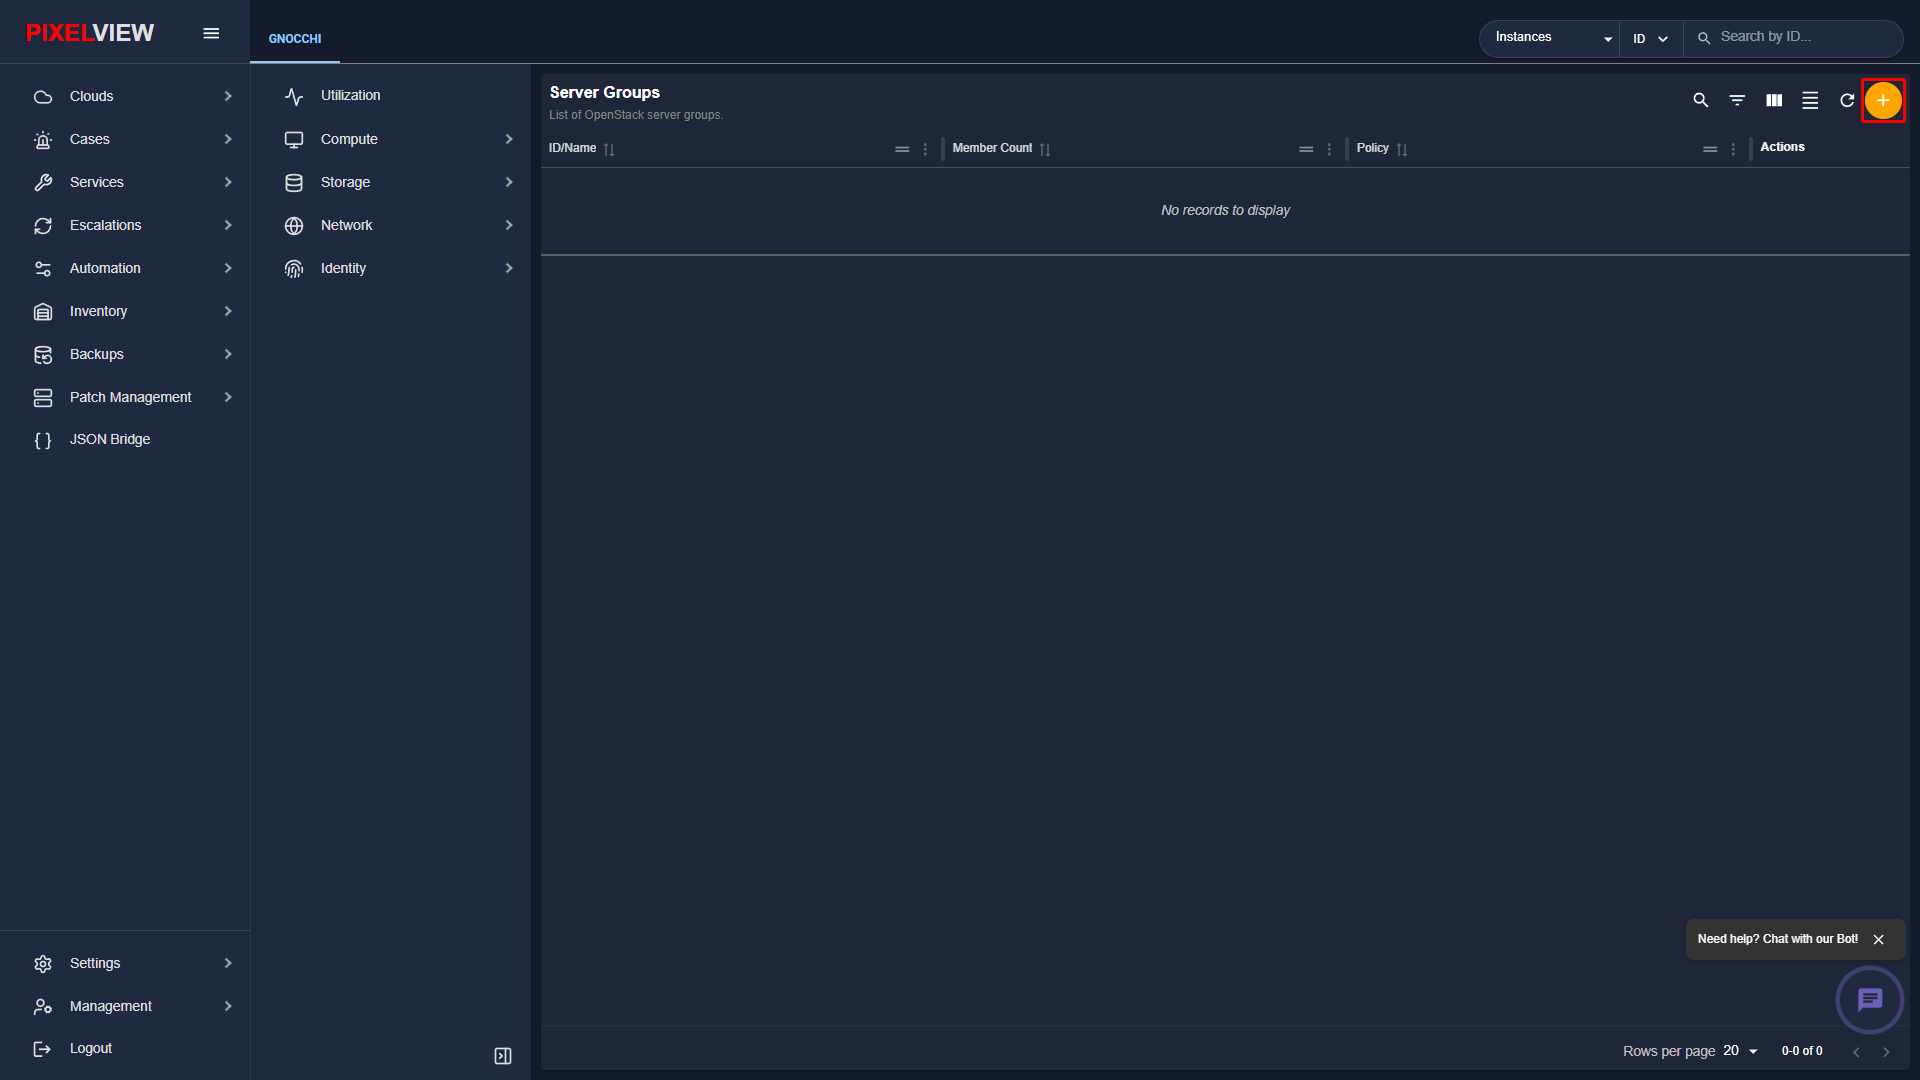
- Click the orange
+button in the top-right toolbar:
- The Create Server Group modal dialog opens:
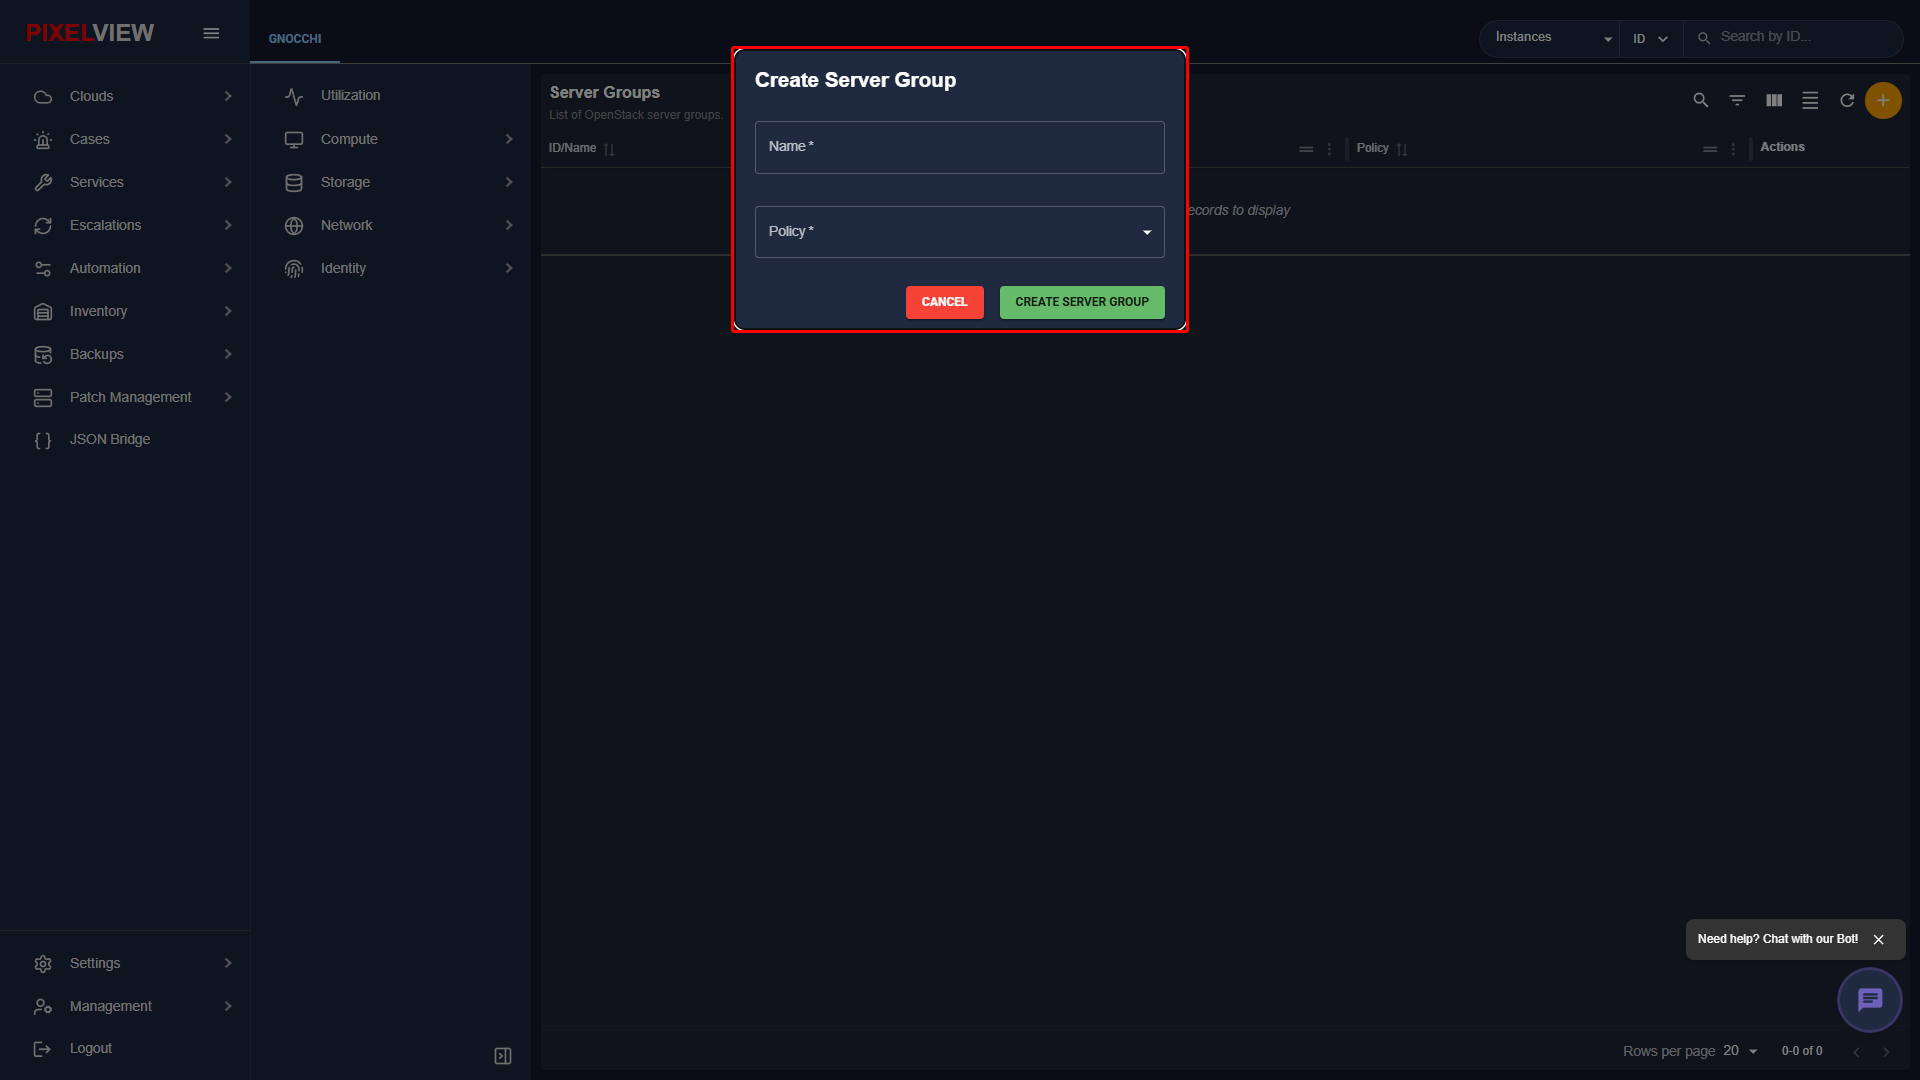
| Policy Type | Behavior | Best Use Case |
|---|---|---|
| Anti-Affinity | Guarantees instances are scheduled on completely separate physical hypervisors. Scheduling fails if insufficient hosts exist. | High-availability database clusters, Kubernetes control-plane nodes. |
| Soft Anti-Affinity | Attempts to schedule instances across different physical hosts, but permits collocation if capacity is exhausted. | Web worker tiers, stateless microservices. |
| Affinity | Forces all member instances to reside on the same physical hypervisor. | Ultra-low latency inter-node communication. |
Storage Services (Cinder & Swift)
PixelView provides full enterprise block storage and distributed object storage operations across the OpenStack region.
Volumes (Block Storage)
Volumes are durable block storage devices that can be attached to running instances, formatted with filesystems, and preserved across VM lifecycles.
Volumes Table Overview
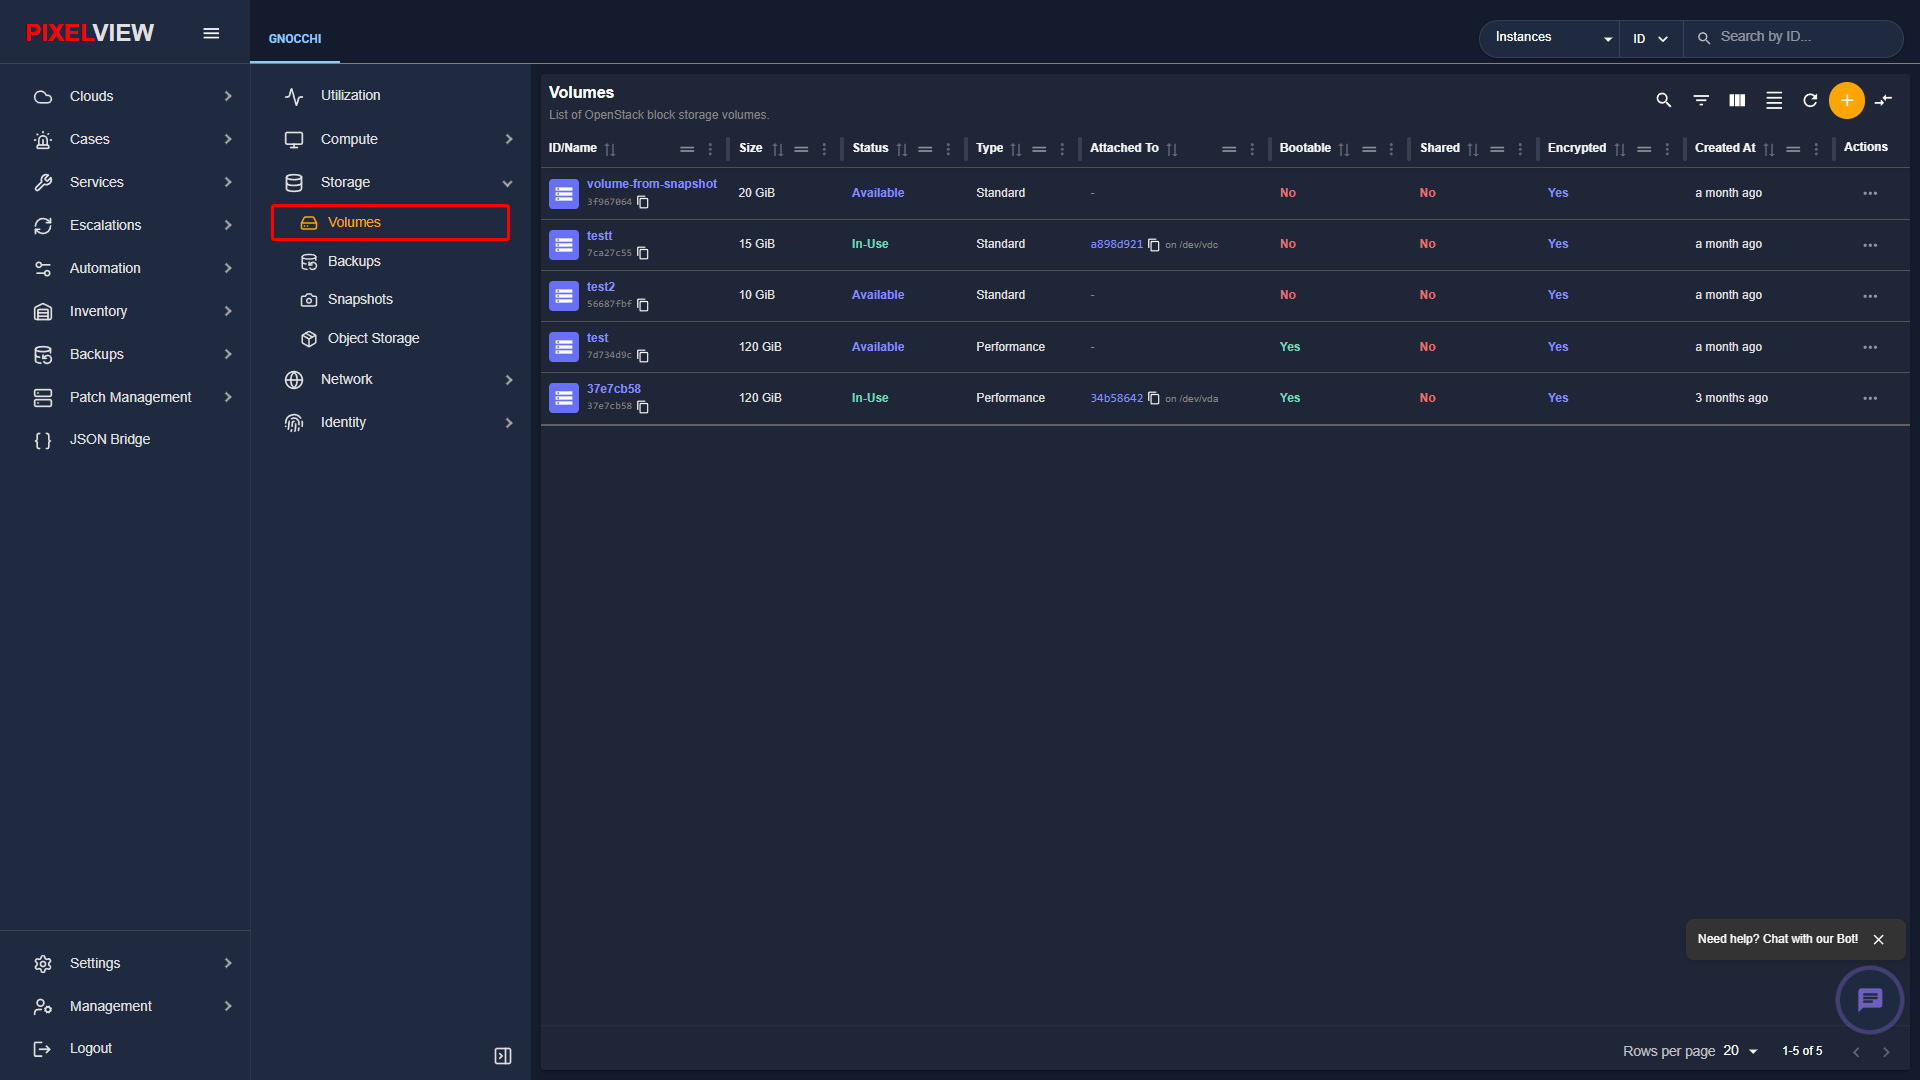
Navigate to Storage → Volumes in the secondary sidebar:
| Column | Description |
|---|---|
| ID / Name | Volume label and system UUID. |
| Status | Lifecycle state: available (unattached), in-use (attached to a VM), creating, or error. |
| Size | Total disk allocation in Gigabytes (GiB). |
| Type | Backend storage tier (e.g., standard-nvme, standard-ssd, ceph-rbd). |
| Attached To | Shows target VM hostname and device mount point (e.g., /dev/vdb). |
| Bootable | Indicates if the volume contains a bootable OS image. |
| Actions | Contextual menu: Attach/Detach Volume, Create Snapshot, Extend Volume, or Delete. |
Creating a Volume
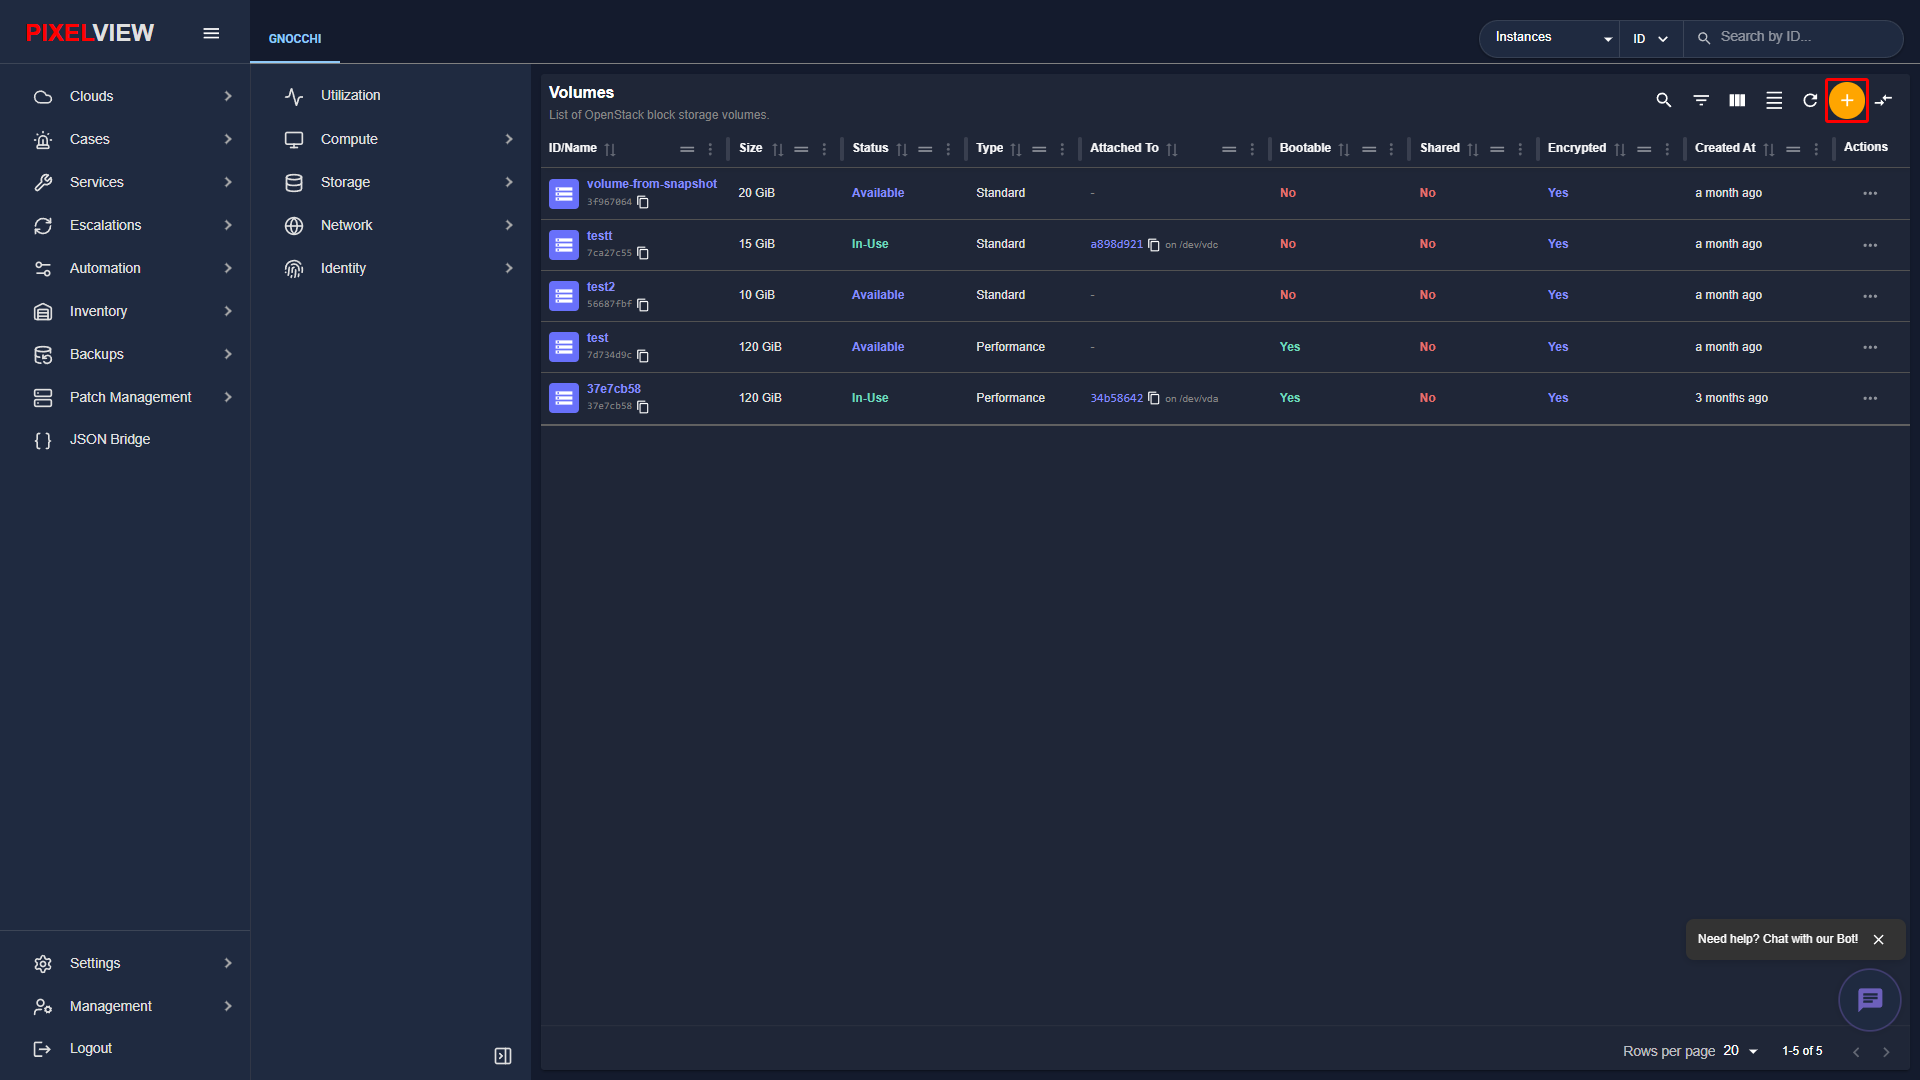
- Click the orange
+(Create Volume) button in the top-right toolbar:
- The Create Volume modal dialog opens:
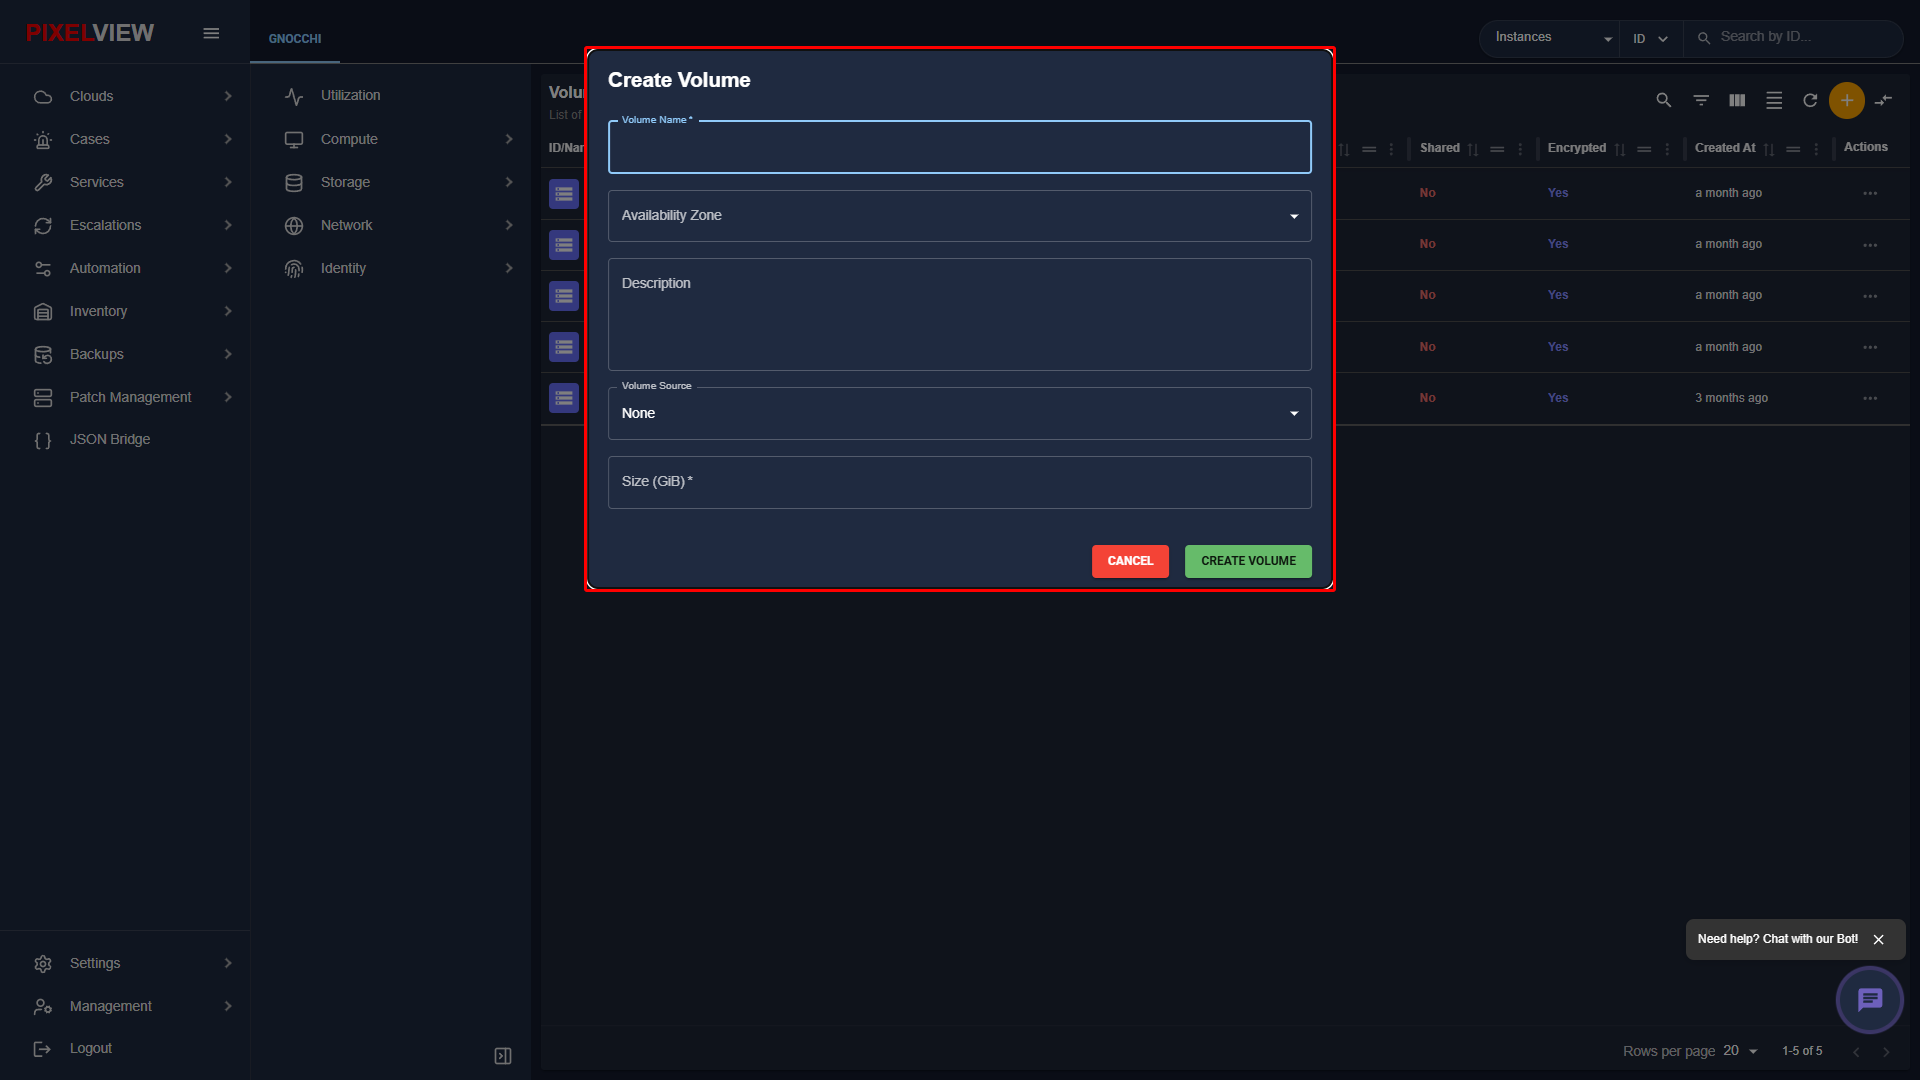
| Parameter | Type | Description |
|---|---|---|
| Volume Name | Required Text | Human-readable label for the volume. |
| Description | Optional Text | Storage purpose and mount instructions. |
| Size (GiB) | Required Number | Capacity to allocate. |
| Volume Type | Dropdown | Storage backend profile defining performance SLA (e.g., NVMe vs SSD). |
| Source | Dropdown | Empty Volume (blank raw device), Image (clone from OS image), or Snapshot (restore from snapshot). |
Volume Details & Drill-Down
Clicking on any volume name in the table navigates to the Volume Details view (/openstack/:regionName/volumes/:uuid):
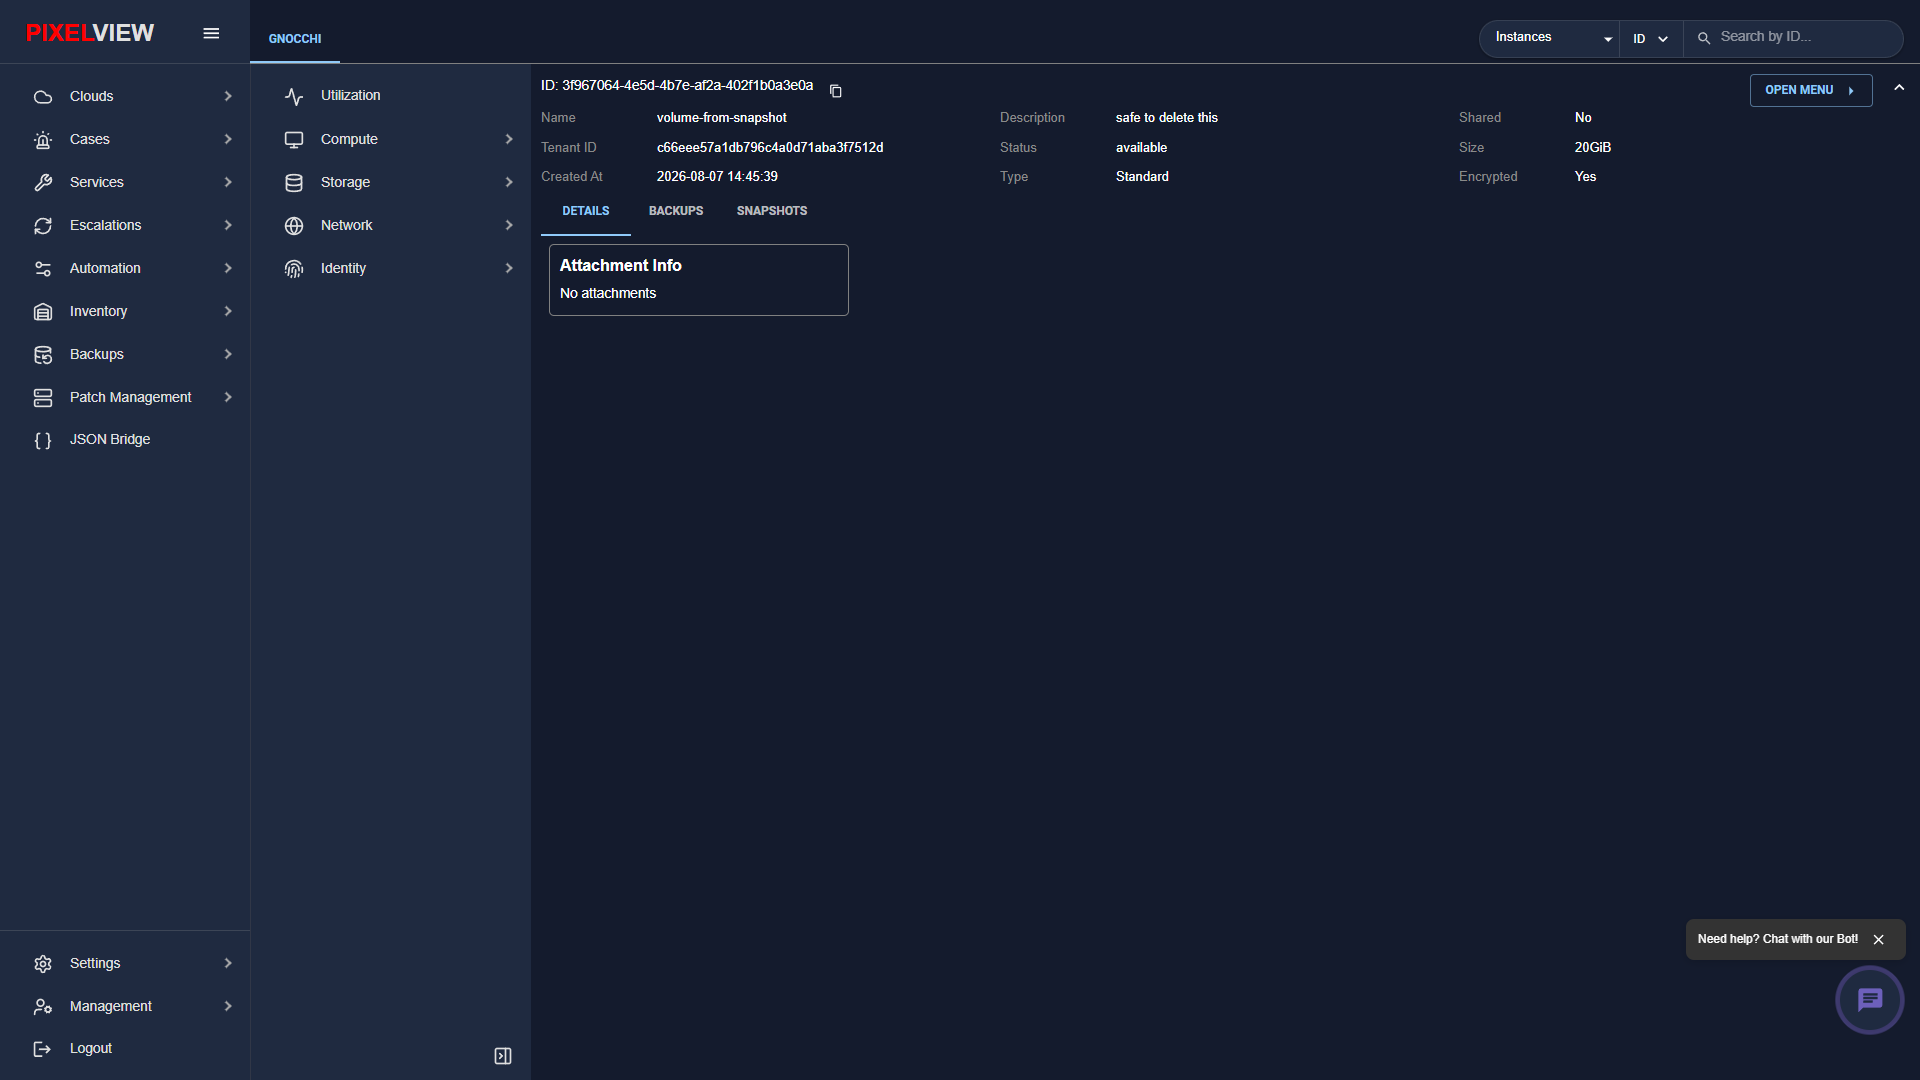
The Volume Details view organizes storage properties across three dedicated tabs:
- DETAILS: Complete block device specifications including UUID, Name, Tenant ID, Status (available or in-use), Type (Standard), Description, Shared status, Size (20GiB), Encryption status (Yes/No), and an Attachment Info panel showing target instance connections.
- BACKUPS: Durable backups associated with this volume.
- SNAPSHOTS: Point-in-time snapshot tree generated from this volume.
Volume Operations Menu
Clicking the OPEN MENU button in the top-right corner of the Volume Details view exposes granular block device operations:
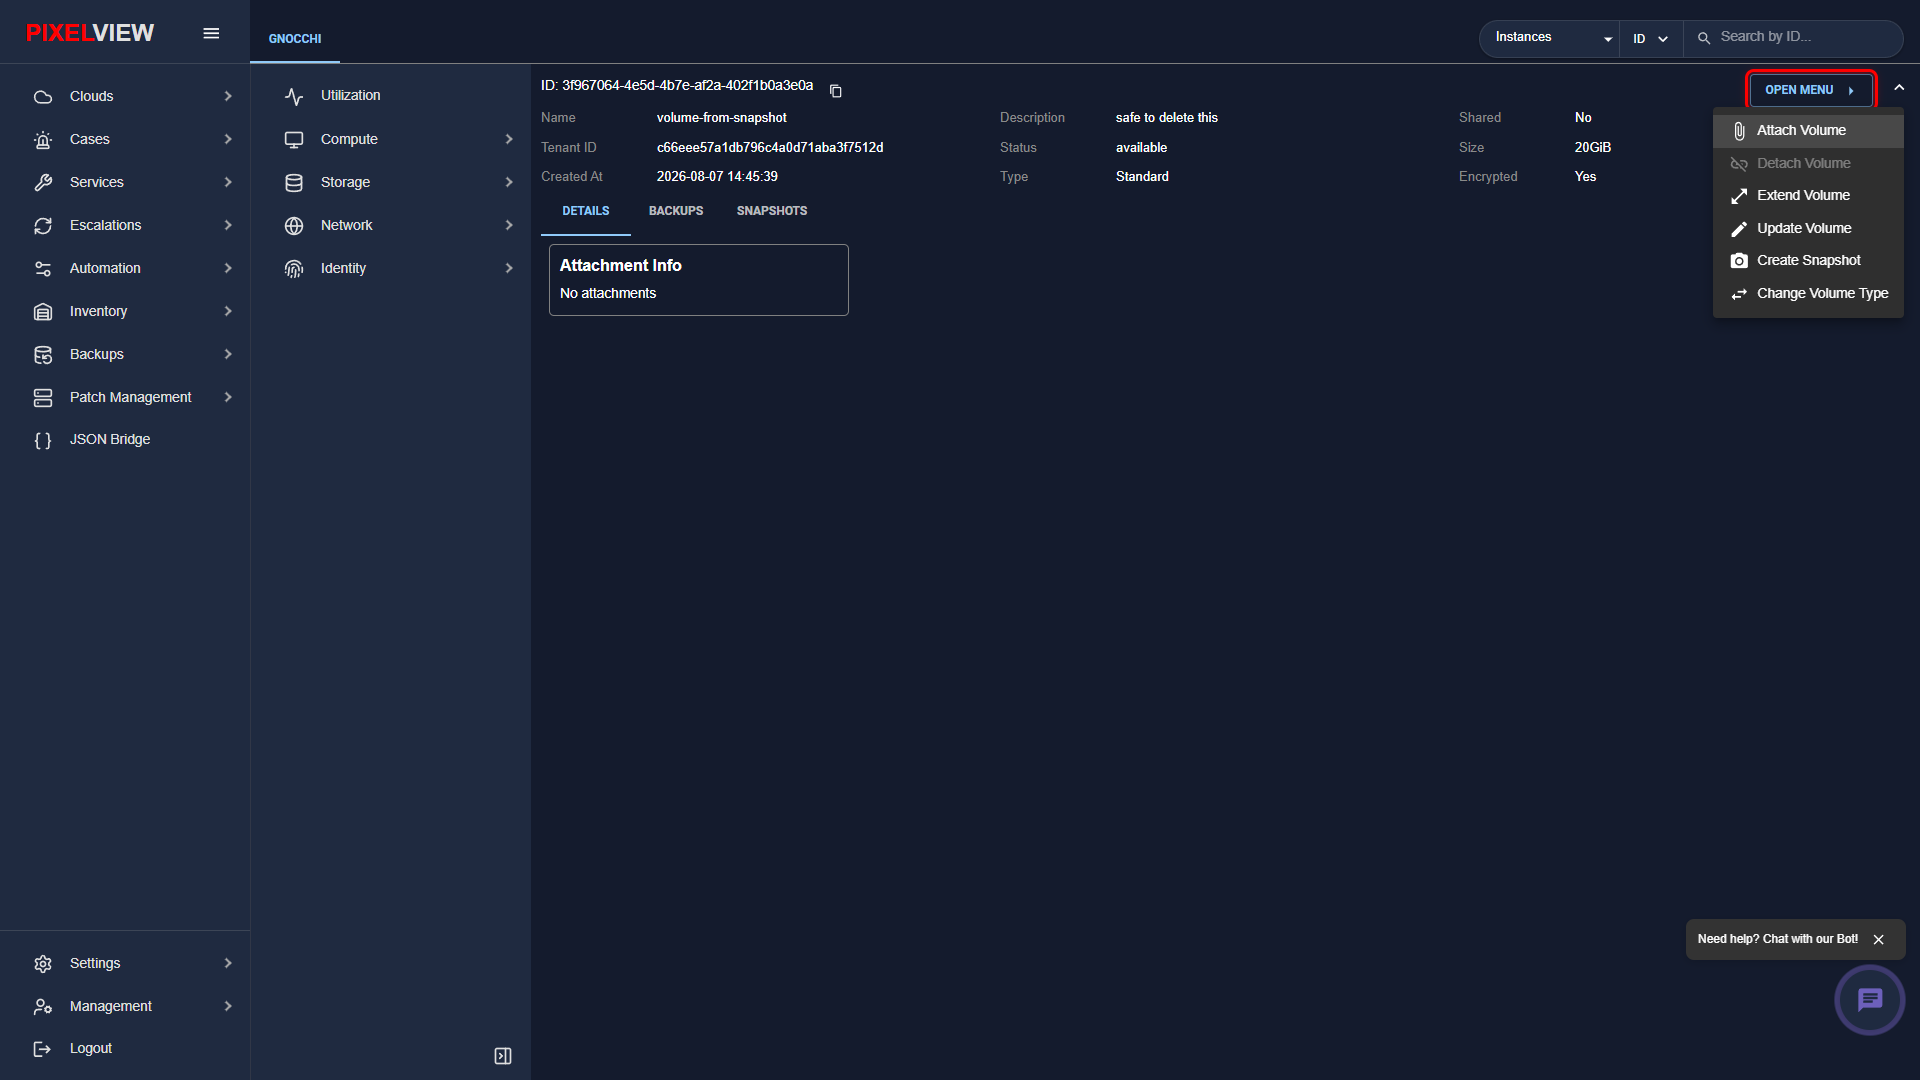
| Operation | Description |
|---|---|
| Attach Volume | Mount the block volume to an active compute instance in the same availability zone. |
| Detach Volume | Safely unmount the volume from its attached virtual machine. |
| Extend Volume | Increase volume storage capacity on-the-fly without data loss. |
| Update Volume | Modify the volume's display name, description, or bootable flag. |
| Create Snapshot | Generate an immediate point-in-time snapshot of the volume data. |
| Change Volume Type | Migrate the volume backend between storage tiers (e.g., standard SSD to NVMe). |
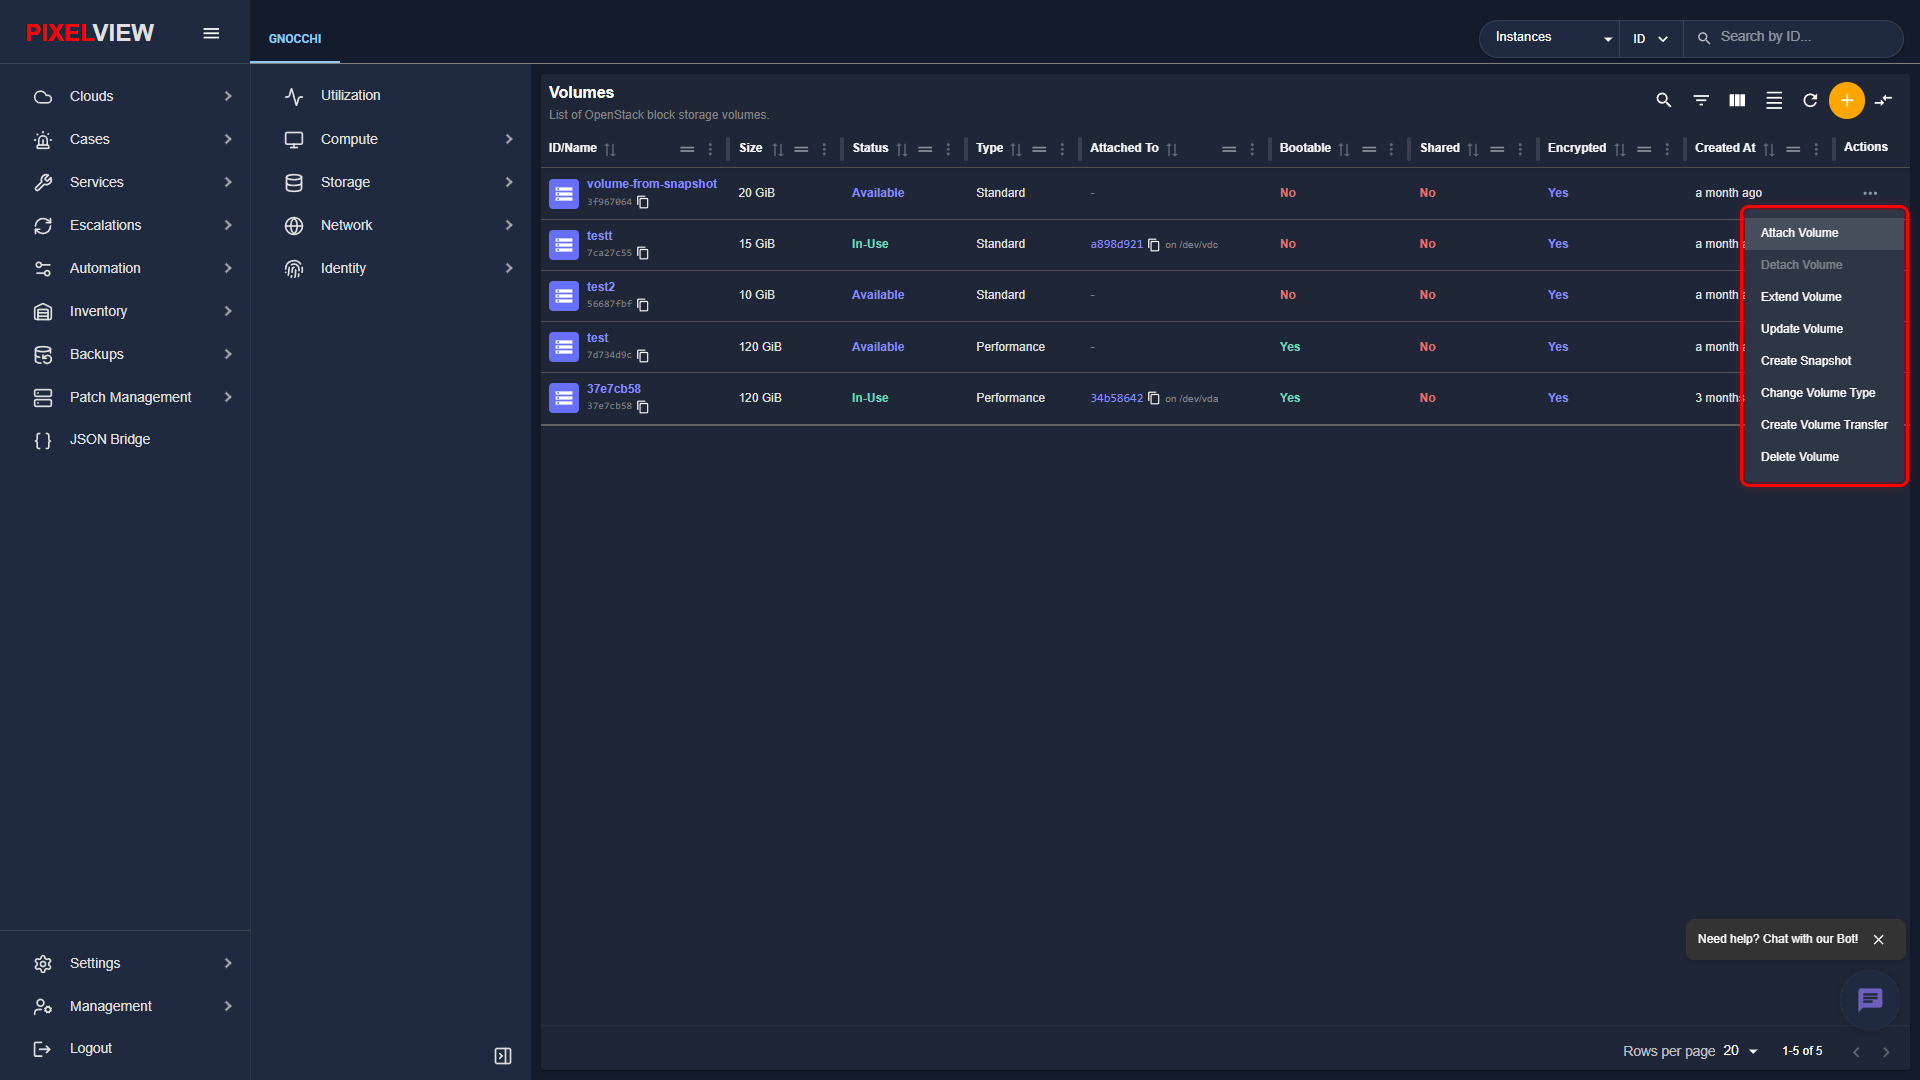
Volumes Contextual Row Actions
From the main Volumes table, clicking the three-dot (...) button on any volume row opens the row actions menu:
Updating a Volume
Selecting Update Volume from the row actions menu or the volume details page opens the volume metadata update modal:
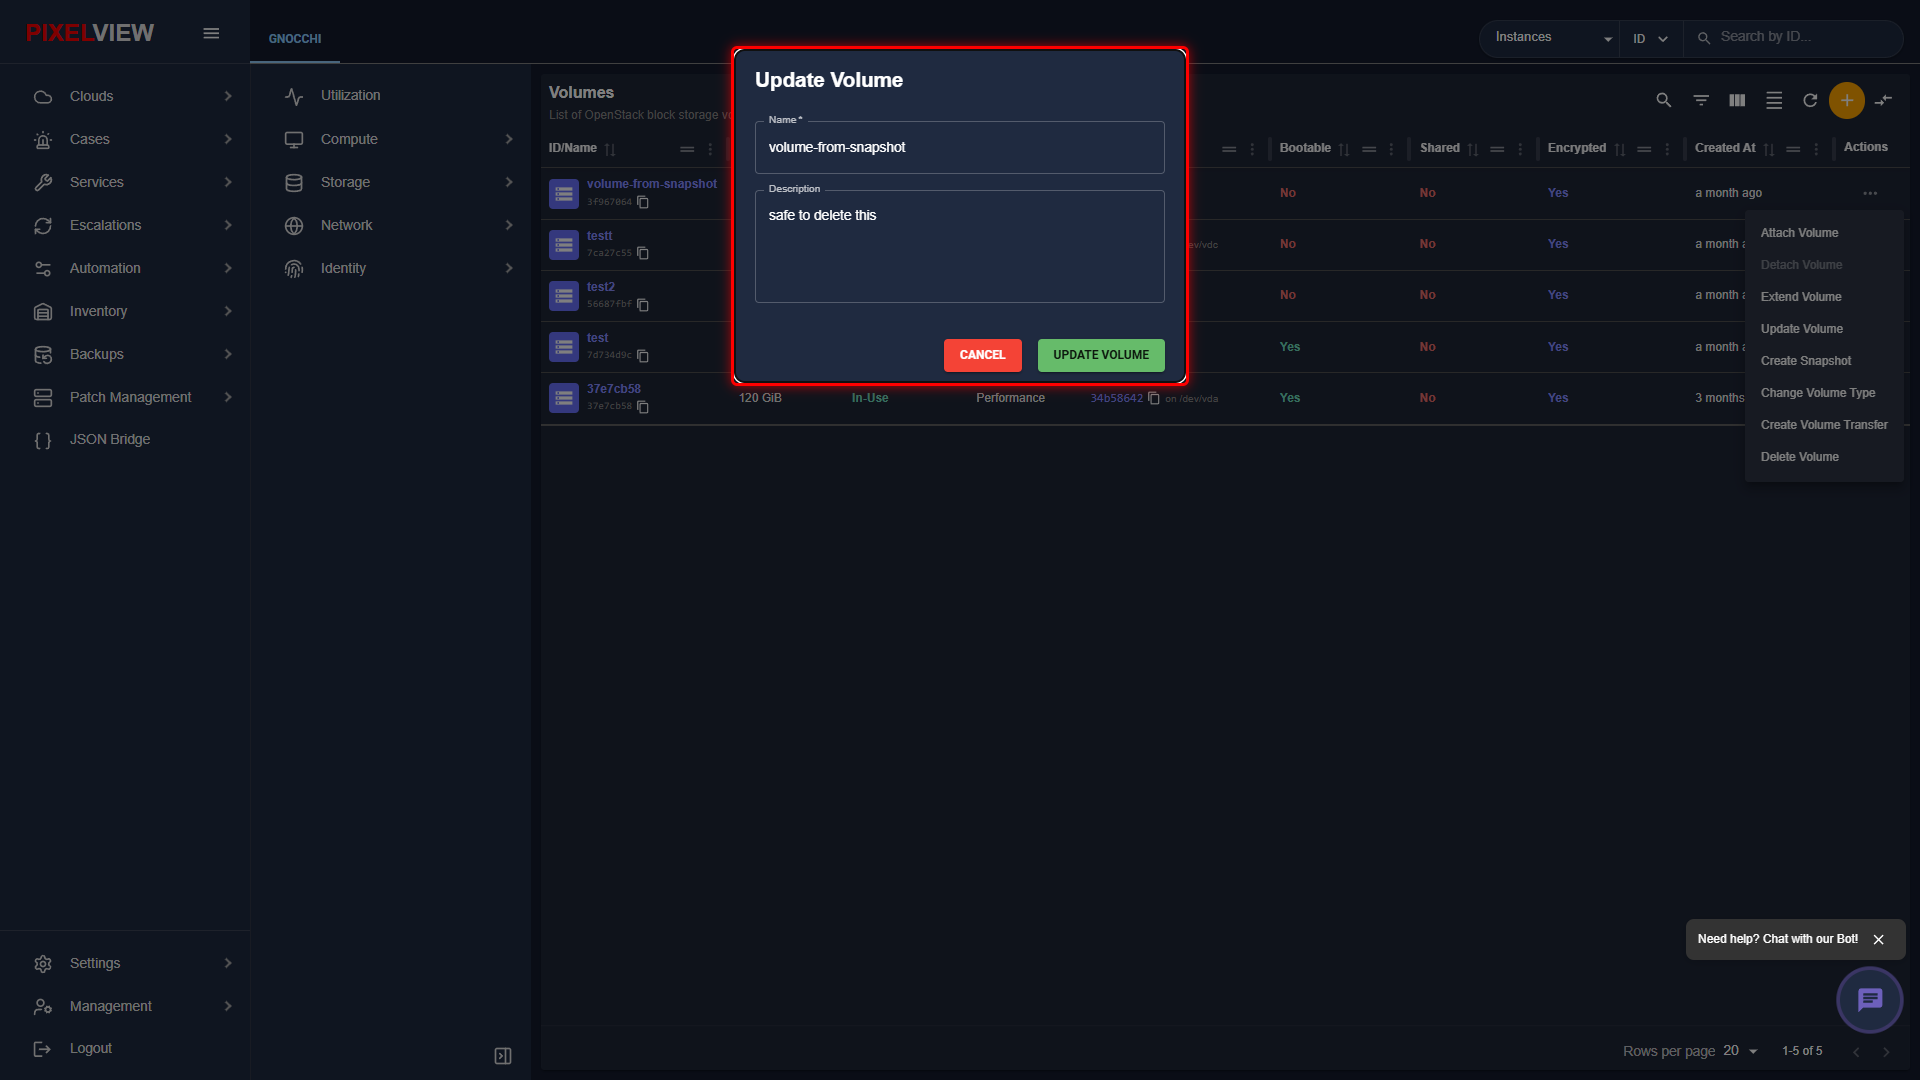
| Parameter | Type | Description |
|---|---|---|
| Name | Required Text | Updated human-readable label for the block storage volume. |
| Description | Optional Text | Contextual notes detailing volume workload, mount purpose, or retention requirements. |
Volume Backups
Volume backups provide durable, off-site secondary storage for entire block volumes. Backups are stored independently in secondary object storage clusters, protecting workloads against catastrophic storage pool outages.
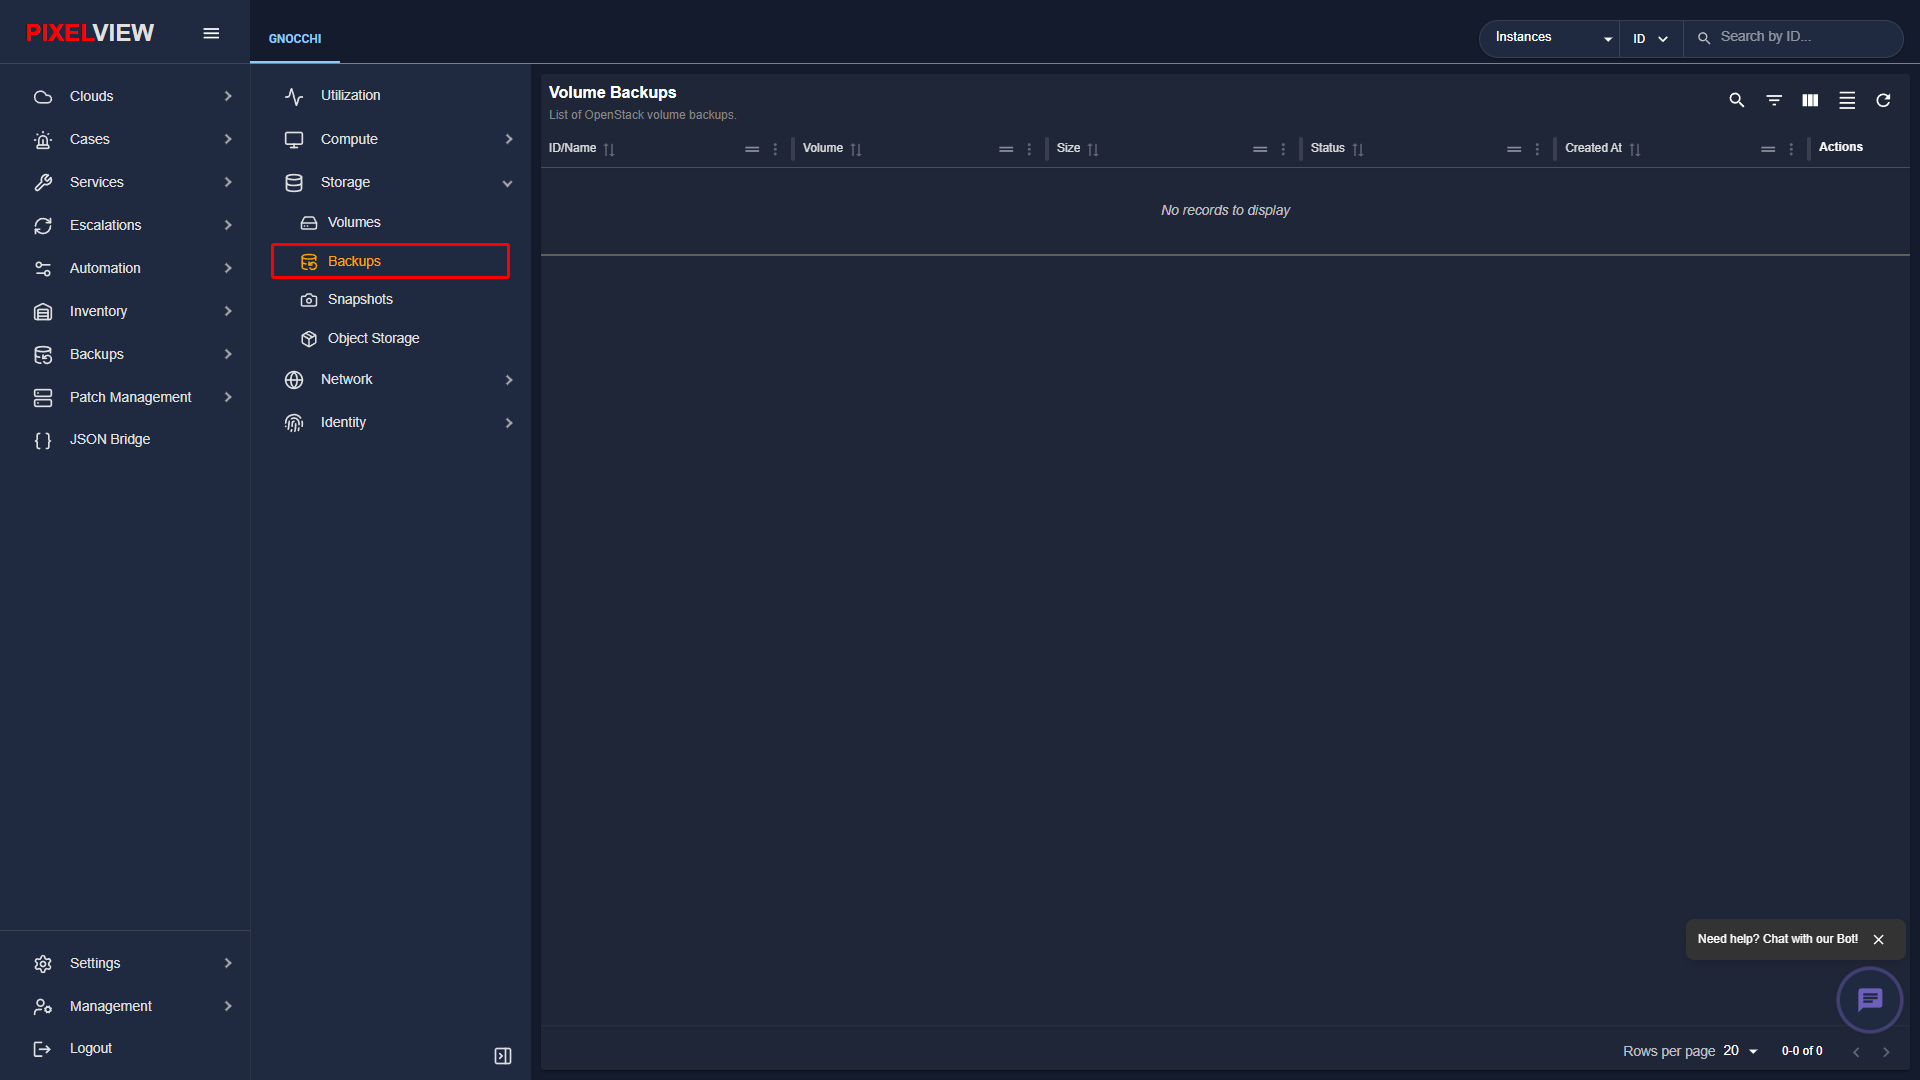
Backups Table Overview
Navigate to Storage → Backups in the secondary sidebar:
| Column | Description |
|---|---|
| ID / Name | Backup identifier and timestamped catalog label. |
| Size | Data size preserved in object storage. |
| Status | Backup lifecycle state: Available, Restoring, or Error. |
| Source Volume | Originating volume UUID. |
| Container | Target object storage container holding the backup chunks. |
| Actions | Restore backup to a new or existing volume, or purge backup record. |
- Creation Workflow: Volume backups do not provide an independent toolbar
+button because they are point-in-time copies generated directly from an existing volume. To initiate a backup, navigate to the Volumes table, click the contextual row actions menu (...) on the source volume, and select Create Backup.
Volume Snapshots
Snapshots capture instantaneous, point-in-time read-only copies of a Cinder volume, allowing instant rollbacks or rapid provisioning of identical volumes.
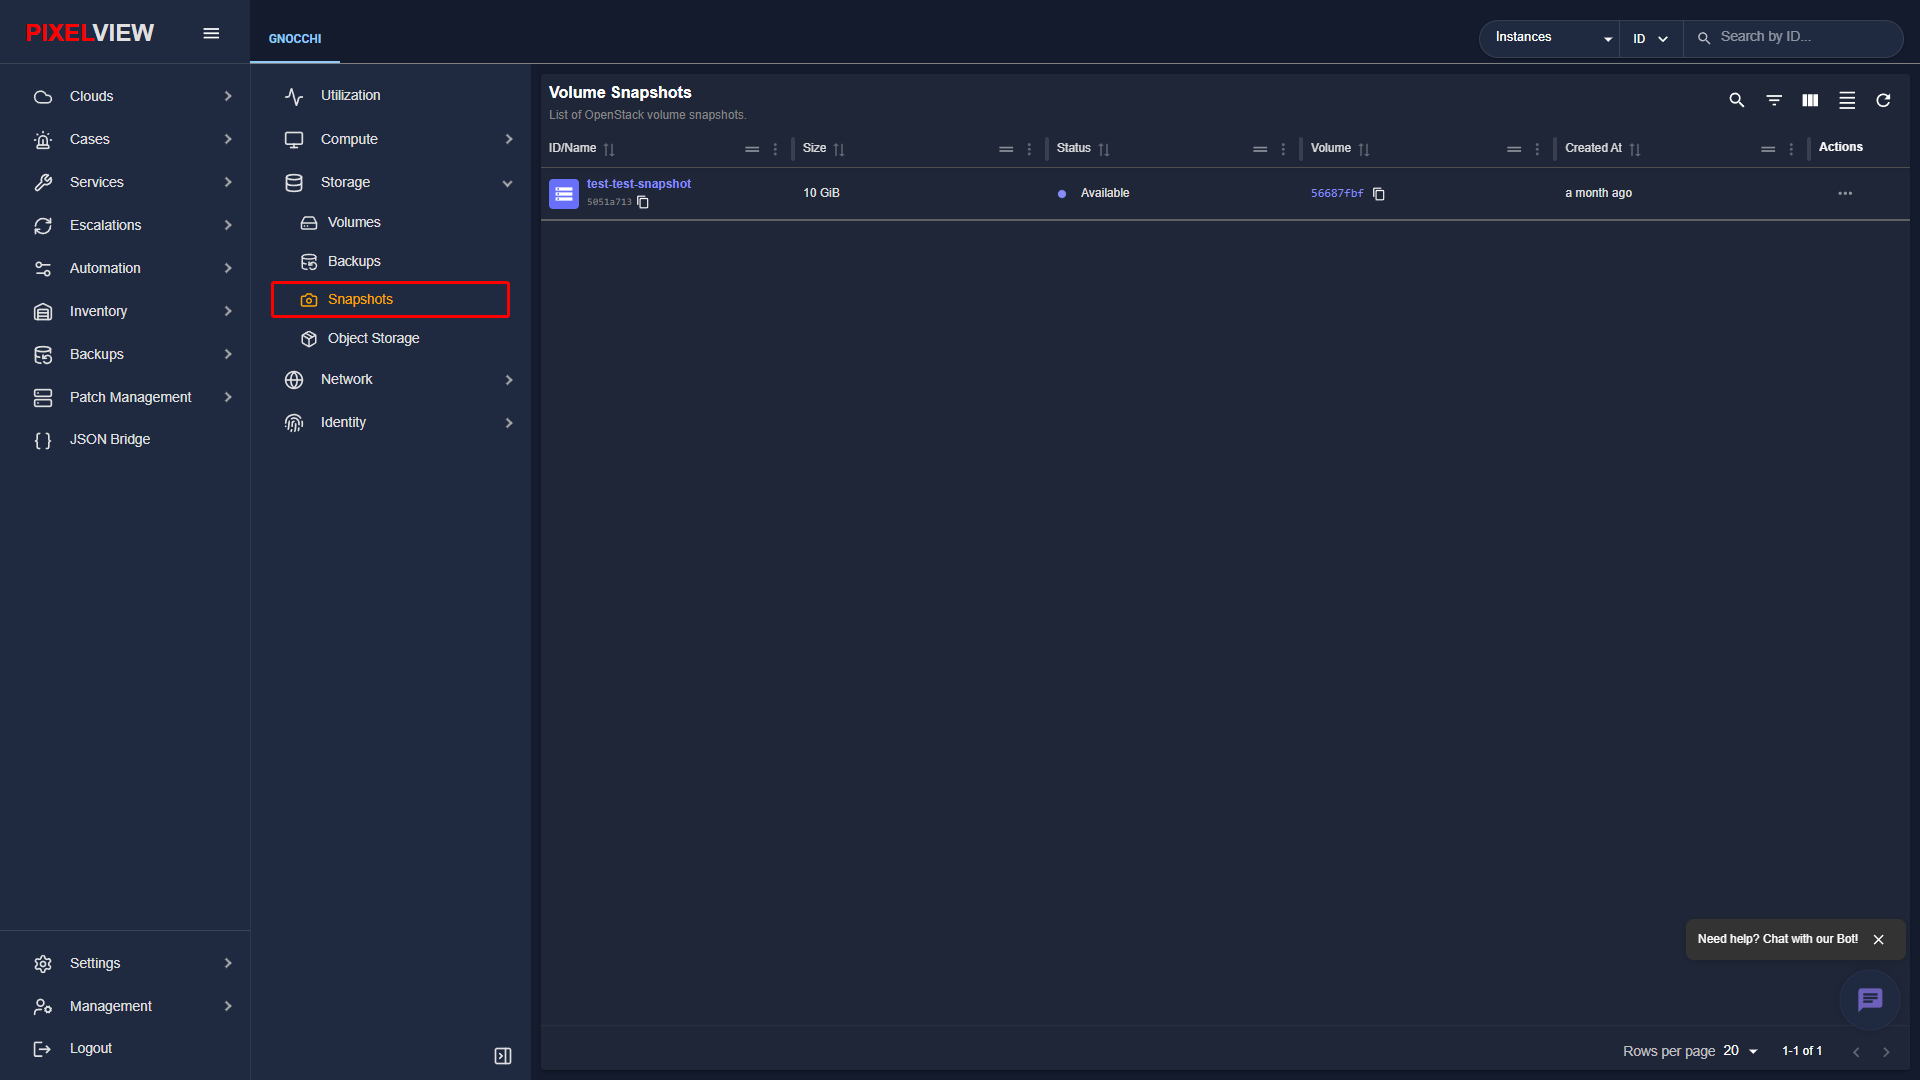
Snapshots Table Overview
Navigate to Storage → Snapshots in the secondary sidebar:
- Creation Workflow: Volume snapshots do not provide an independent toolbar
+button. They are instantaneous delta snapshots initiated directly from the source volume's row actions menu (...) → Create Snapshot in the Volumes table.
| Column | Description |
|---|---|
| ID / Name | Snapshot display name and UUID. |
| Source Volume | Name and UUID of the parent block volume. |
| Size | Capacity preserved from the source volume (GiB). |
| Status | Readiness state: available, creating, or error. |
| Created At | Timestamp recording snapshot creation. |
| Actions | Shortcuts to Create Volume from Snapshot, Reset State, or Delete. |
Object Storage (Swift Containers)
The Object Storage catalog (/openstack/:regionName/object-storage) allows operators to manage highly available, distributed OpenStack Swift object storage containers and multi-gigabyte blob storage.
Object Storage Table Overview
Navigate to Storage → Object Storage in the secondary sidebar:
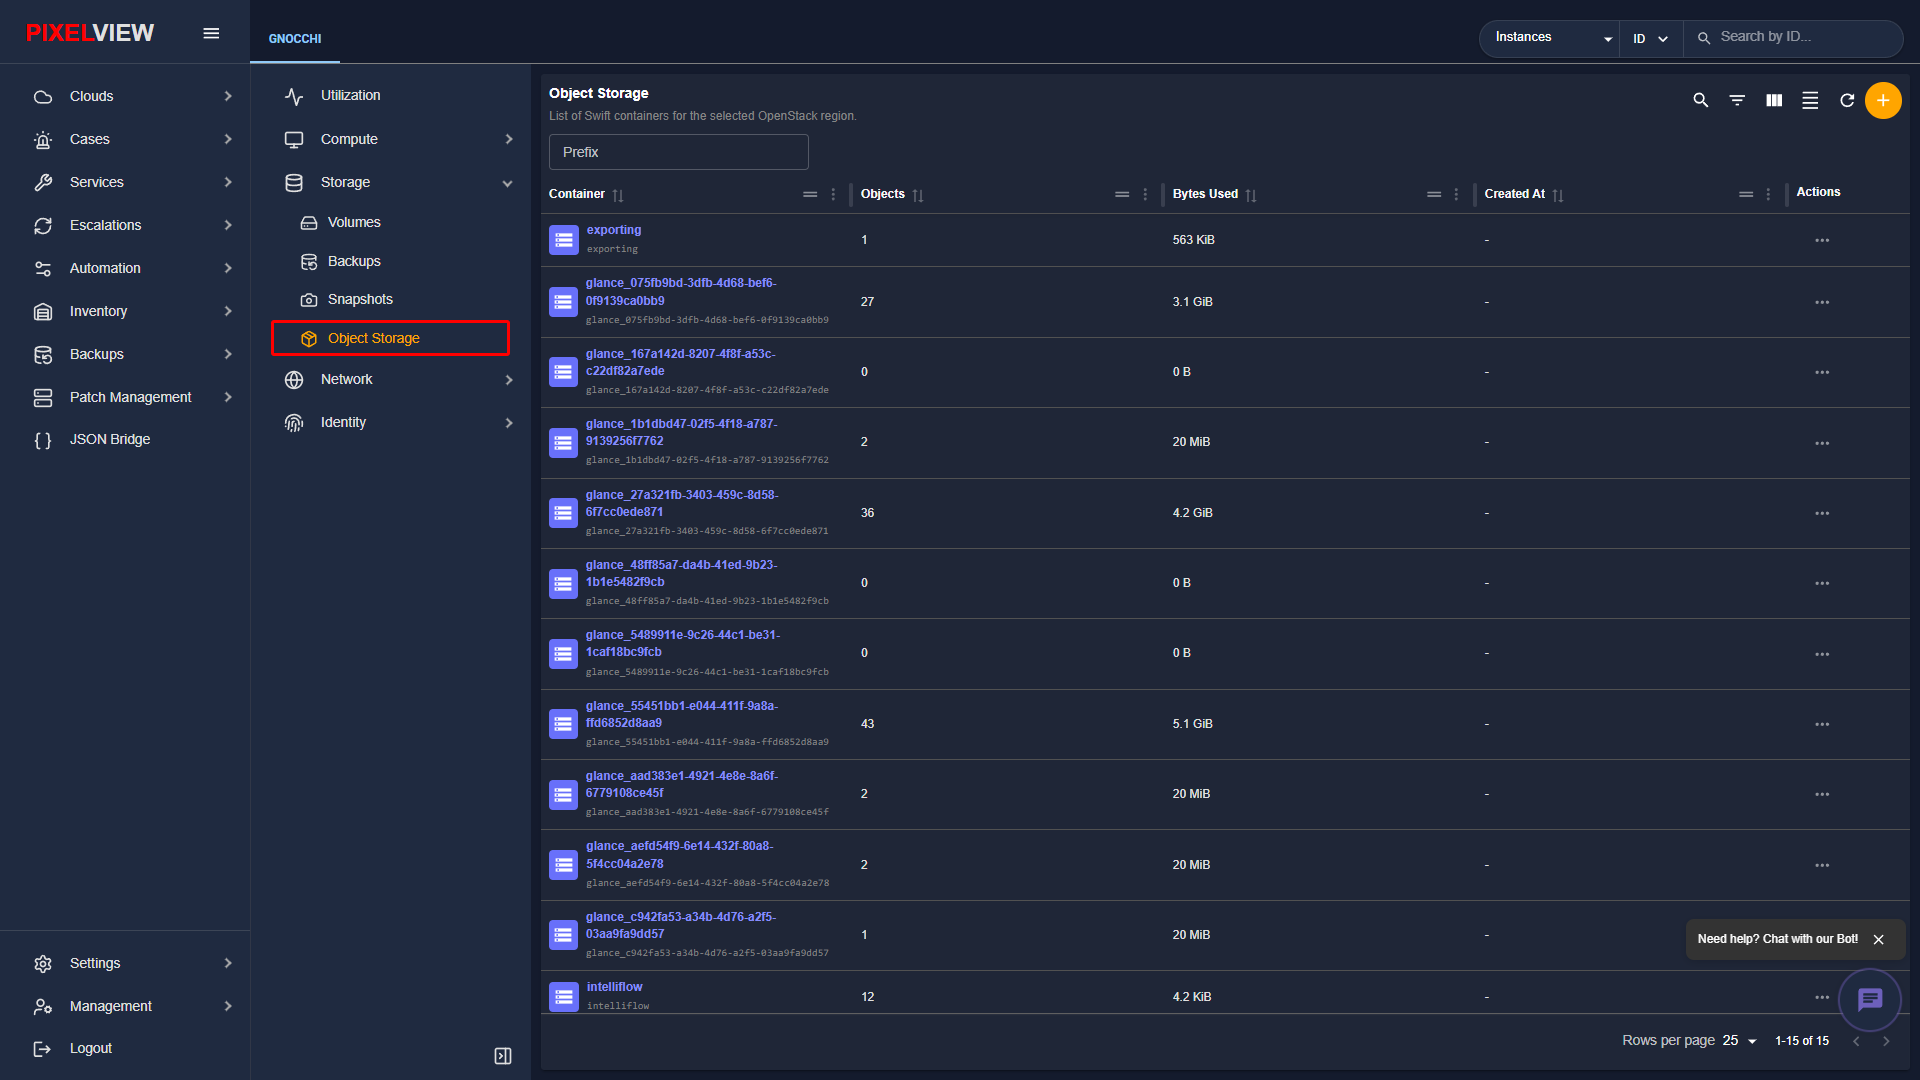
| Column | Description |
|---|---|
| Container | Swift container name and quick-access prefix link. |
| Objects | Total number of individual data objects, blobs, and file chunks stored within the container. |
| Bytes Used | Aggregated storage consumption (e.g., 20 MiB, 4.2 GiB, 5.1 GiB). |
| Created At | Timestamp indicating the container creation date and time. |
| Actions | Contextual options menu allowing operators to upload files, configure container ACLs, or delete empty containers. |
Creating a Container
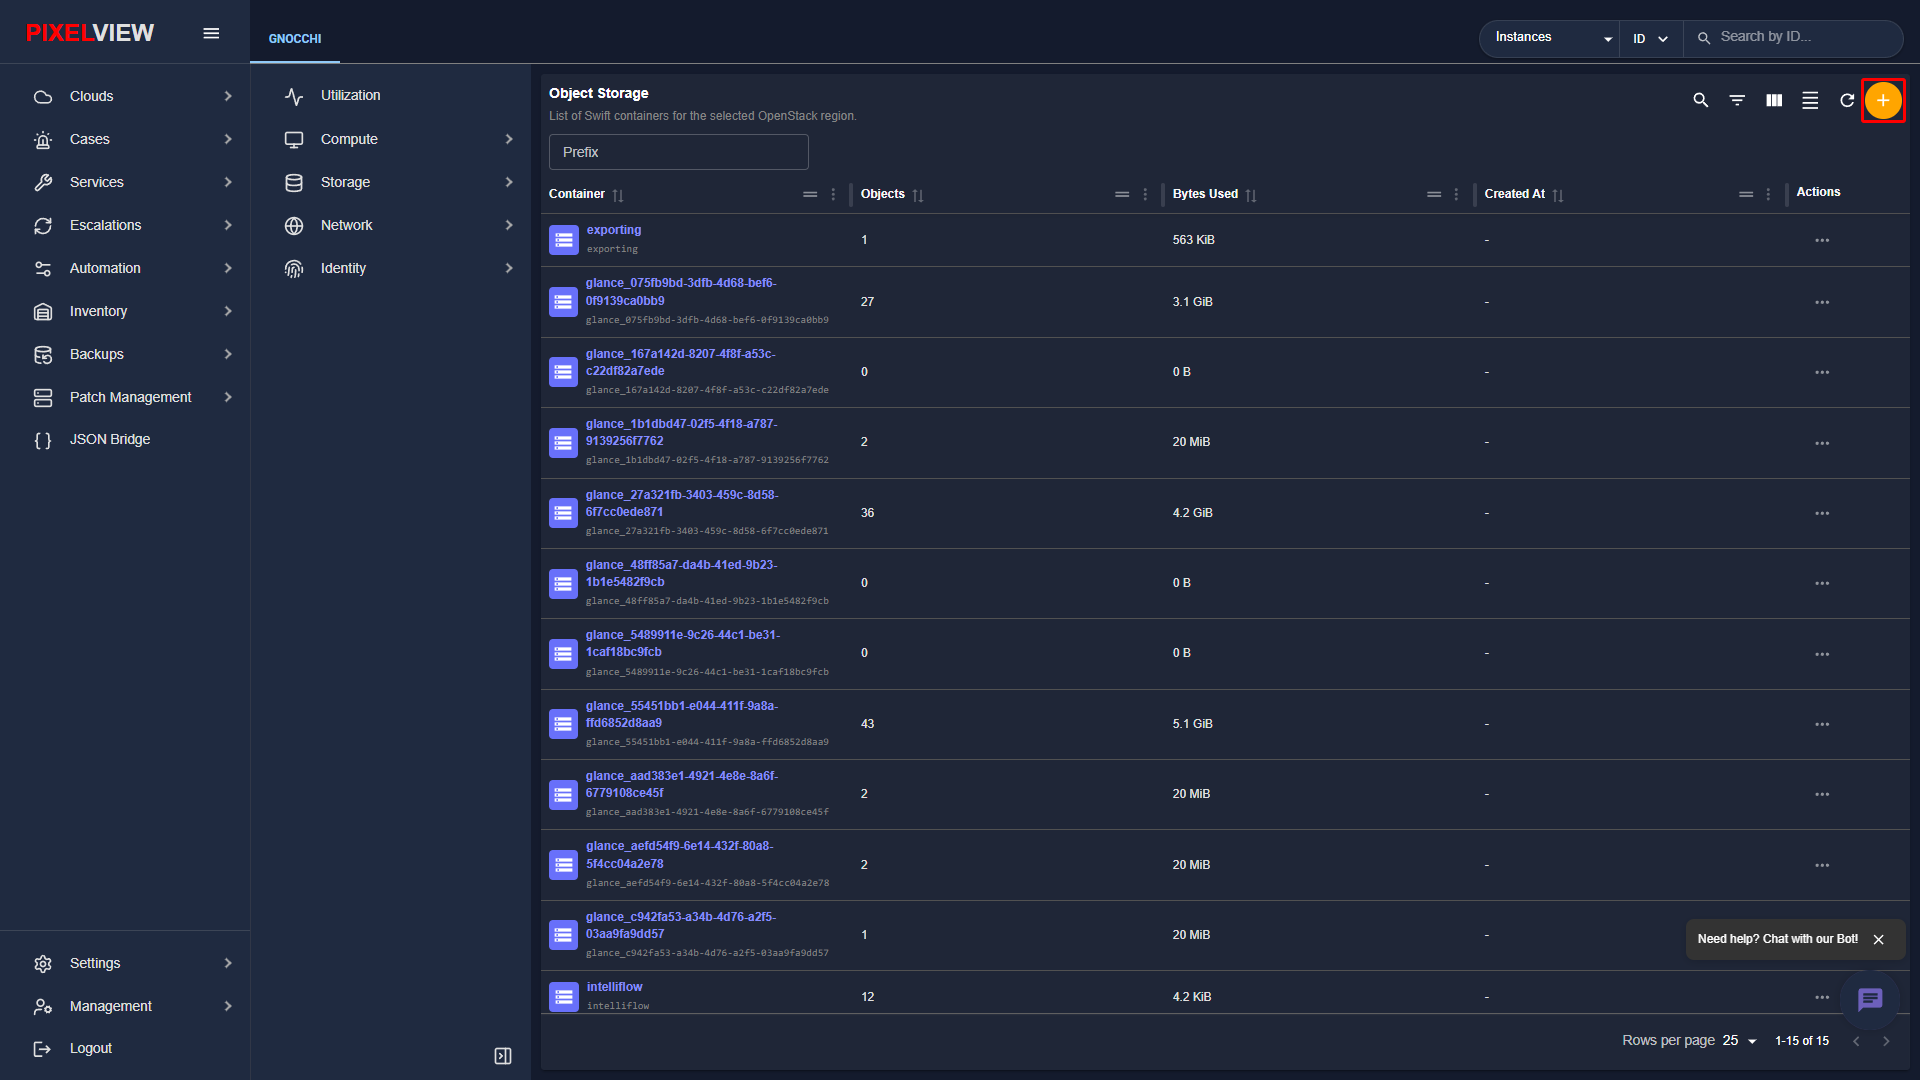
To create a new Swift storage container:
* Click the orange + button located in the top-right toolbar:
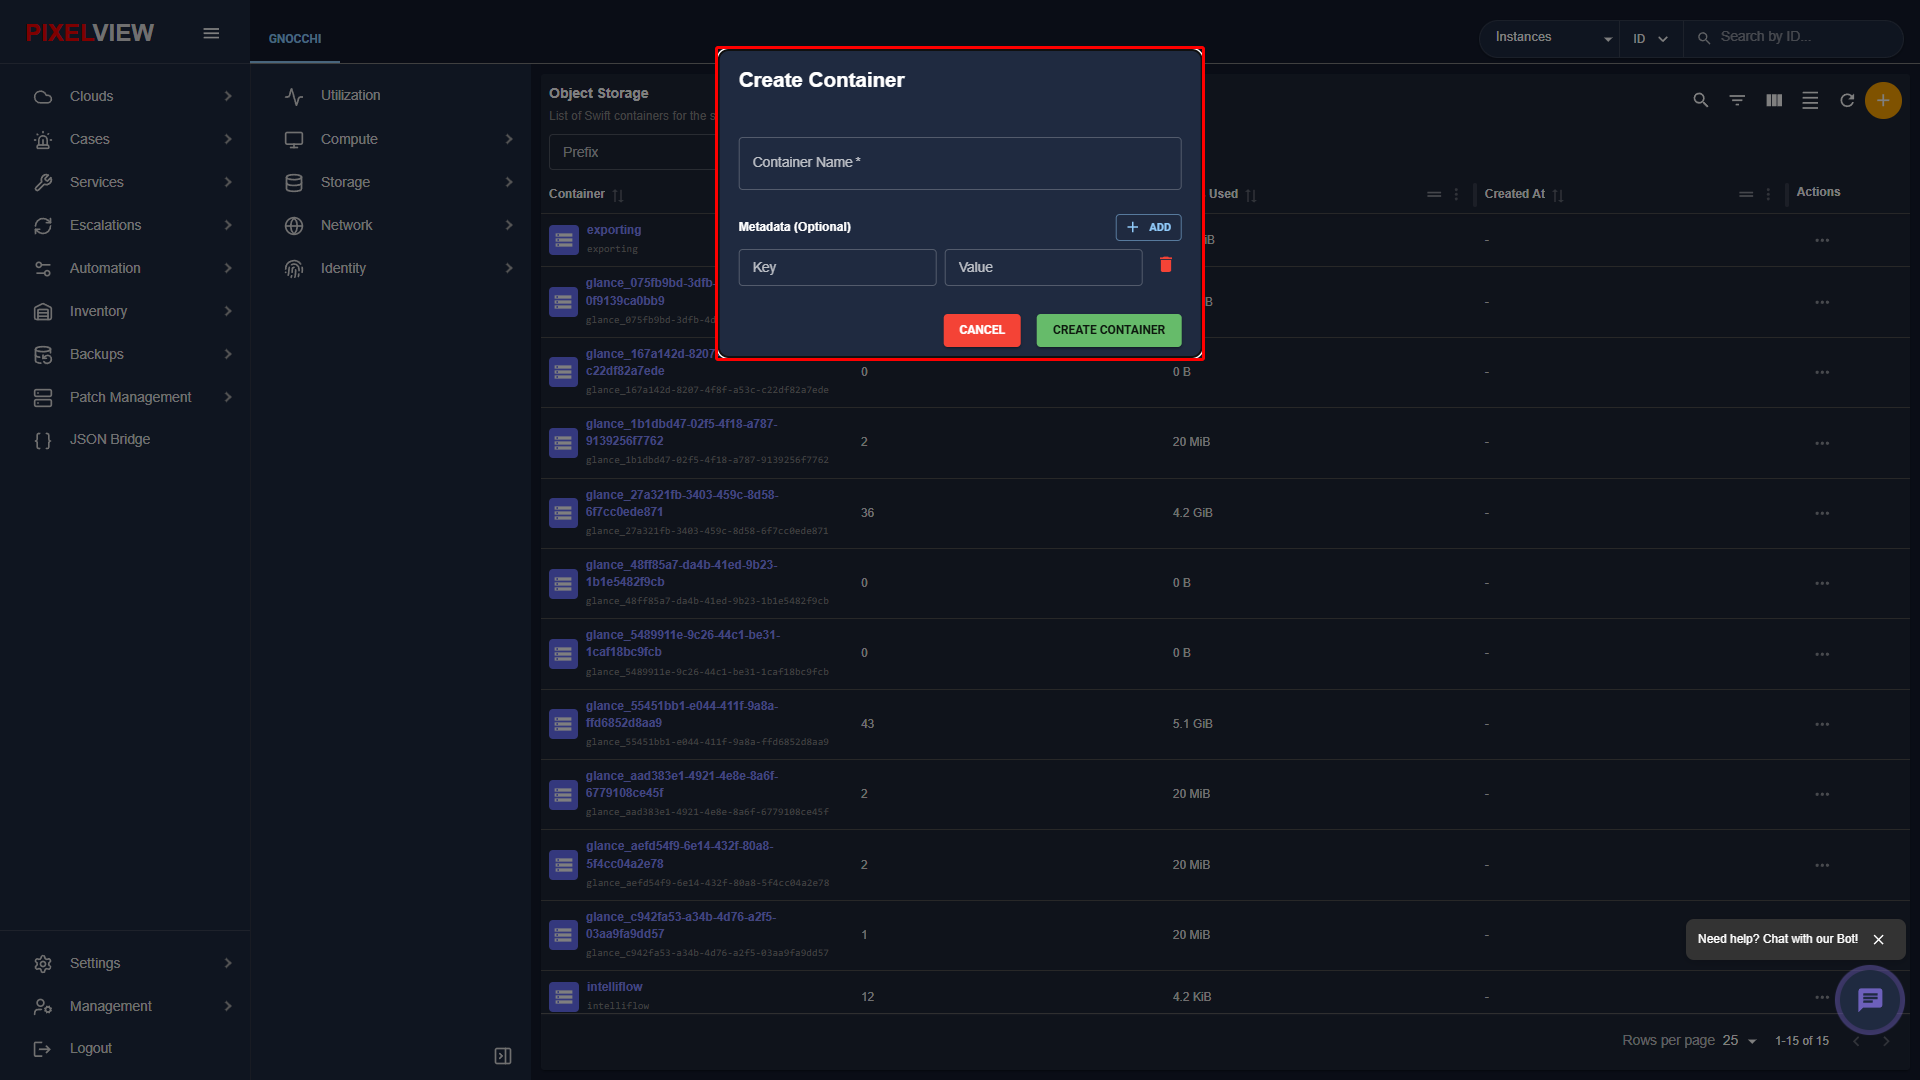
- The Create Container modal dialog opens:
| Parameter | Type | Description |
|---|---|---|
| Container Name | Required Text | A globally unique, alphanumeric identifier for the object storage container. |
| Metadata (Optional) | Key-Value Pairs | Custom user-defined key-value attributes attached to the container headers for categorization, lifecycle policy tagging, or application integration. Click + ADD to specify additional metadata entries. |
Container Details & Drill-Down
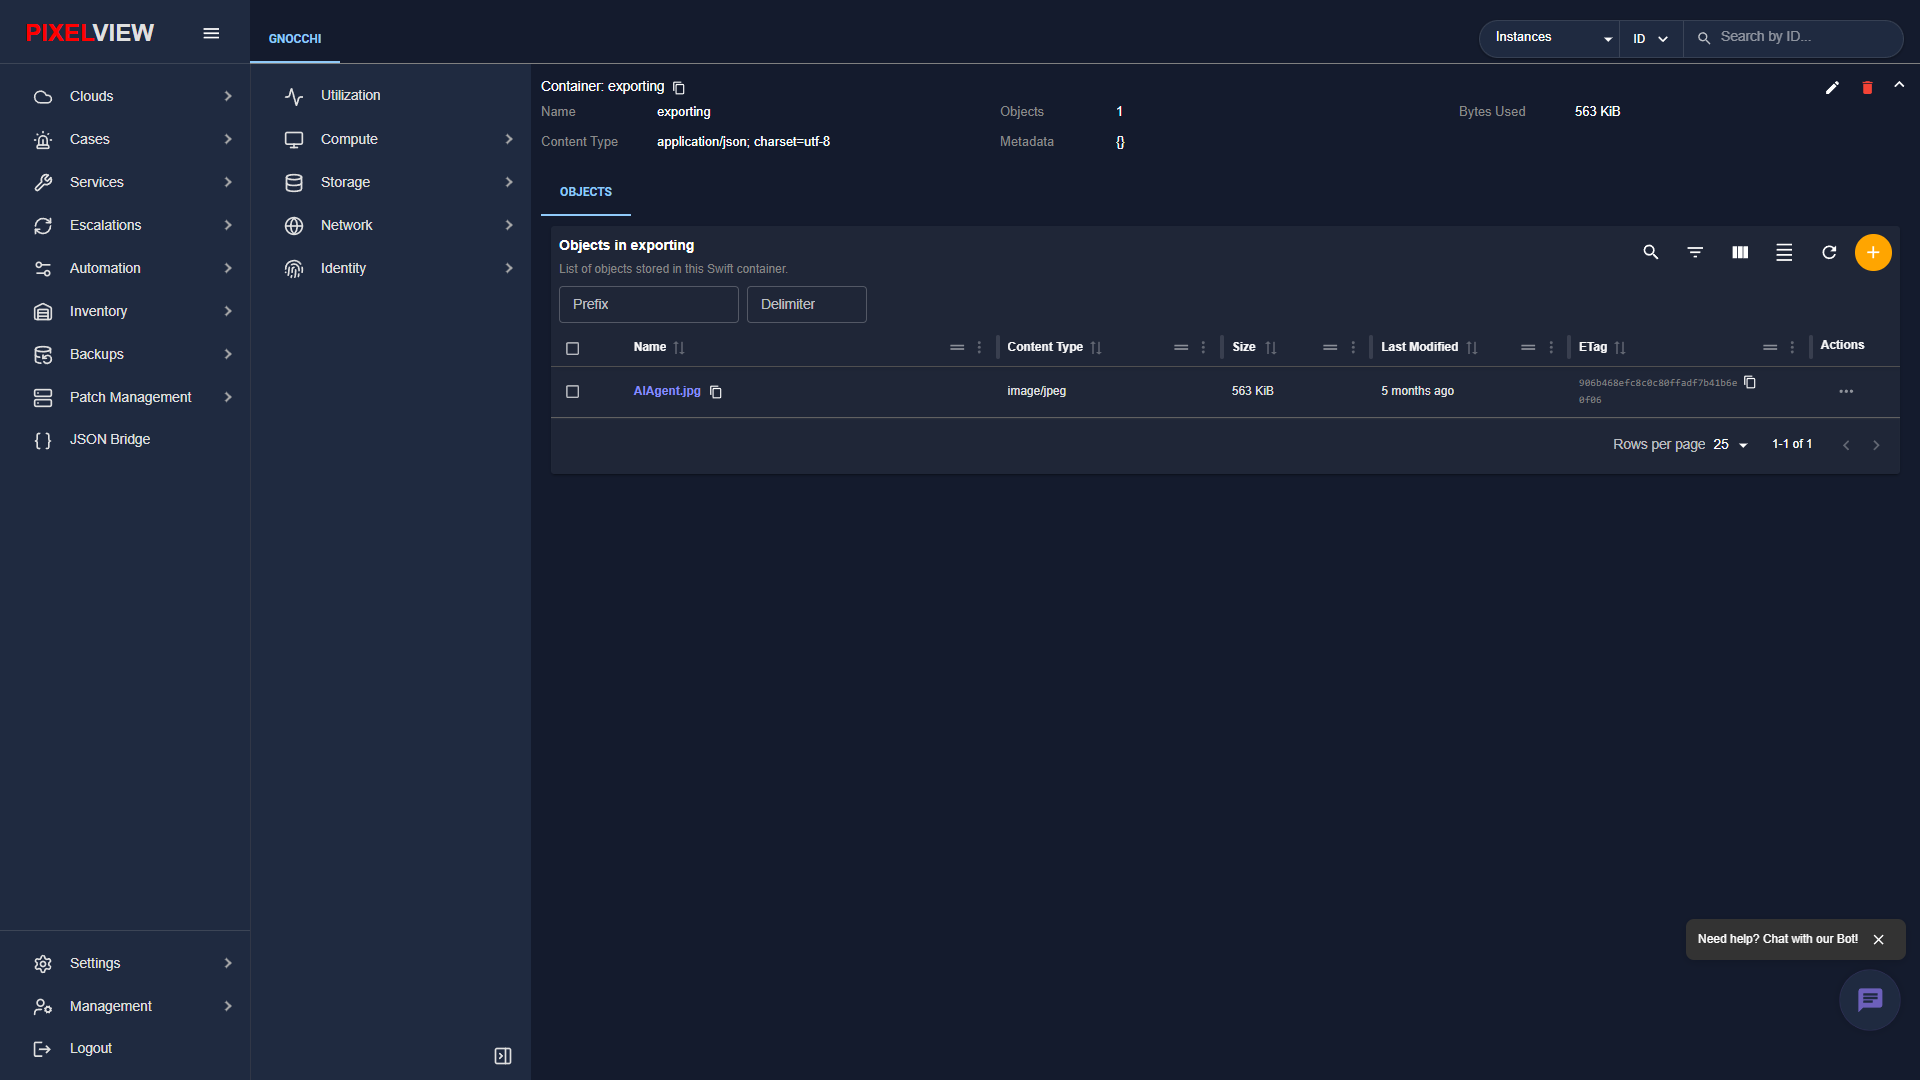
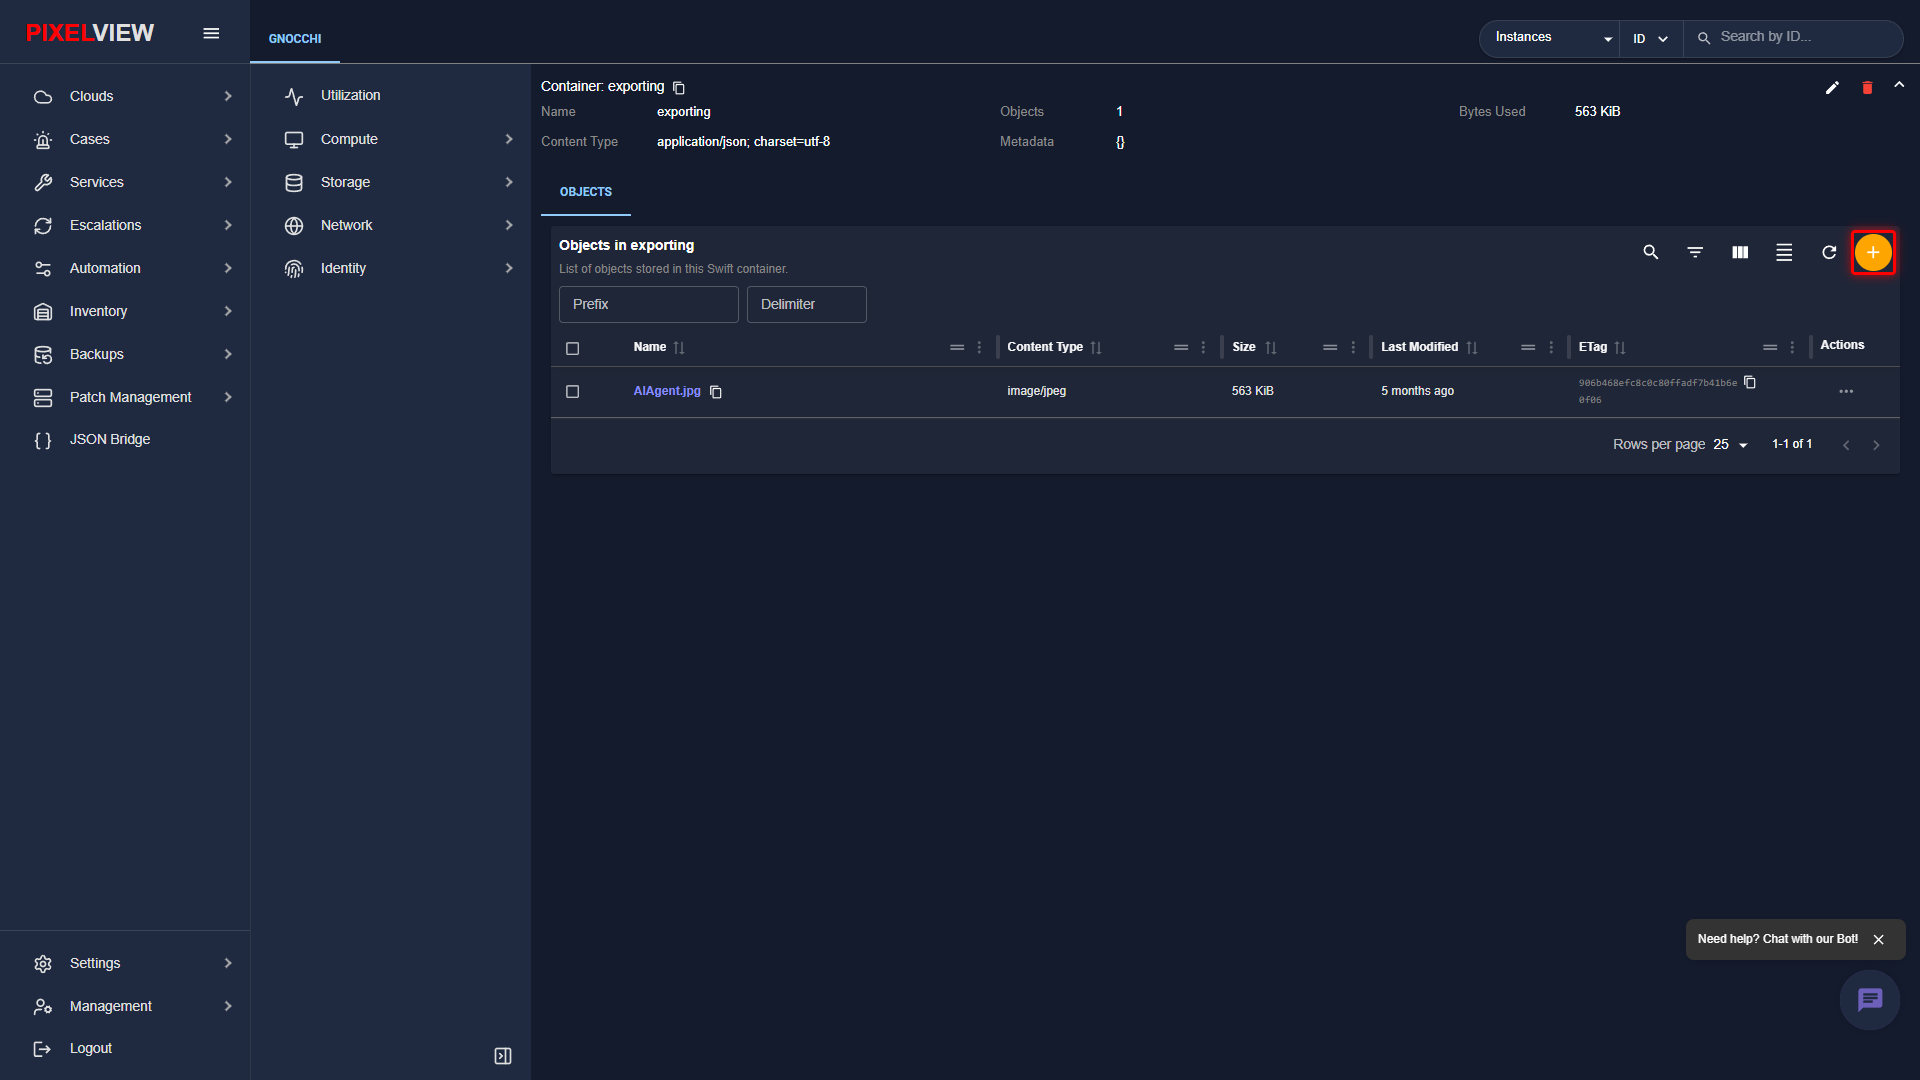
Clicking any container name navigates into the container file explorer, listing individual stored objects, size allocations, and direct download links:
Uploading Objects to Swift Containers
To upload a new file or object into the active container:
* Click the orange + (Upload Object) button in the upper right corner of the container file list:
- The Upload Object modal dialog opens:
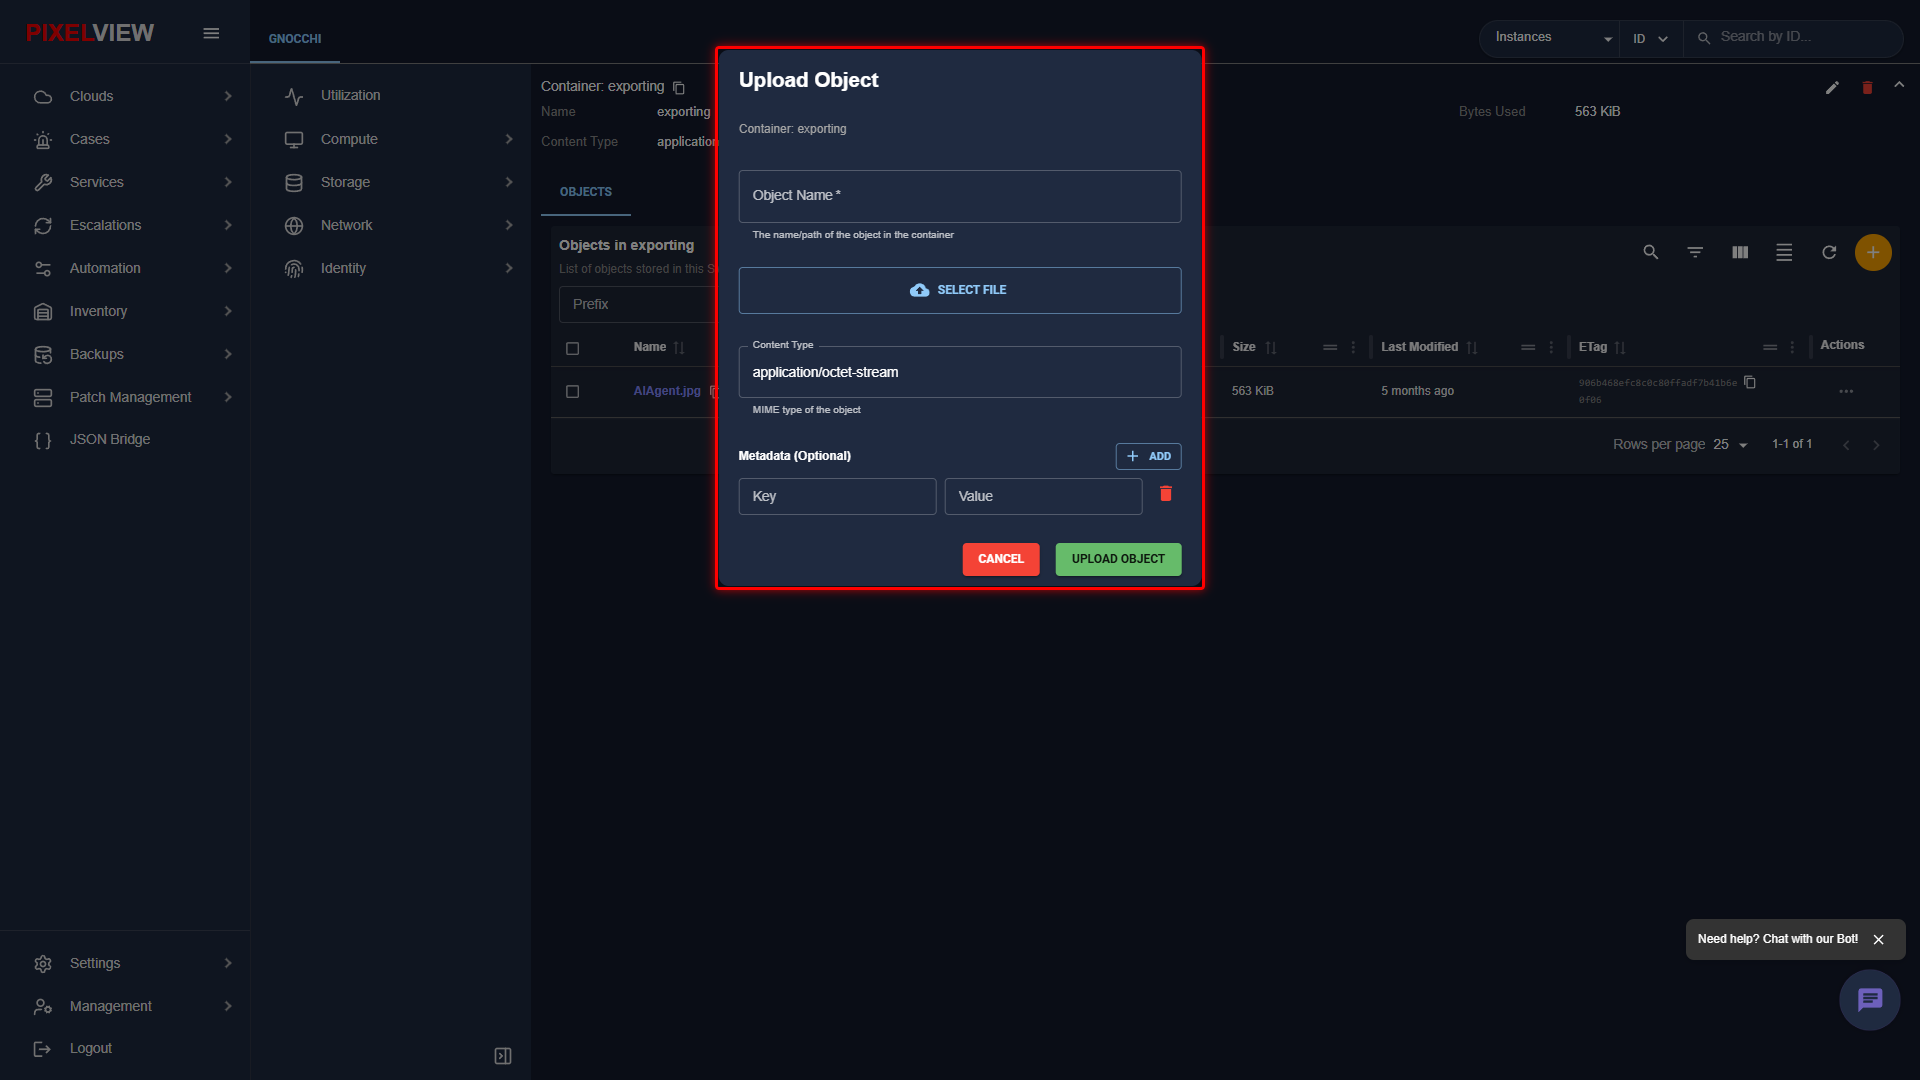
| Parameter | Type | Description |
|---|---|---|
| Object Name | Required Text | Path or filename identifying the payload inside the container (e.g., images/diagram.png, archive.tar.gz). |
| Select File | File Picker | Select and attach the binary payload or document from the local filesystem. |
| Content Type | Text Input | MIME type descriptor (e.g., image/jpeg, application/octet-stream). |
| Metadata (Optional) | Key-Value Pairs | Custom user-defined key-value attributes stored in object headers. |
Object Storage Contextual Row Actions
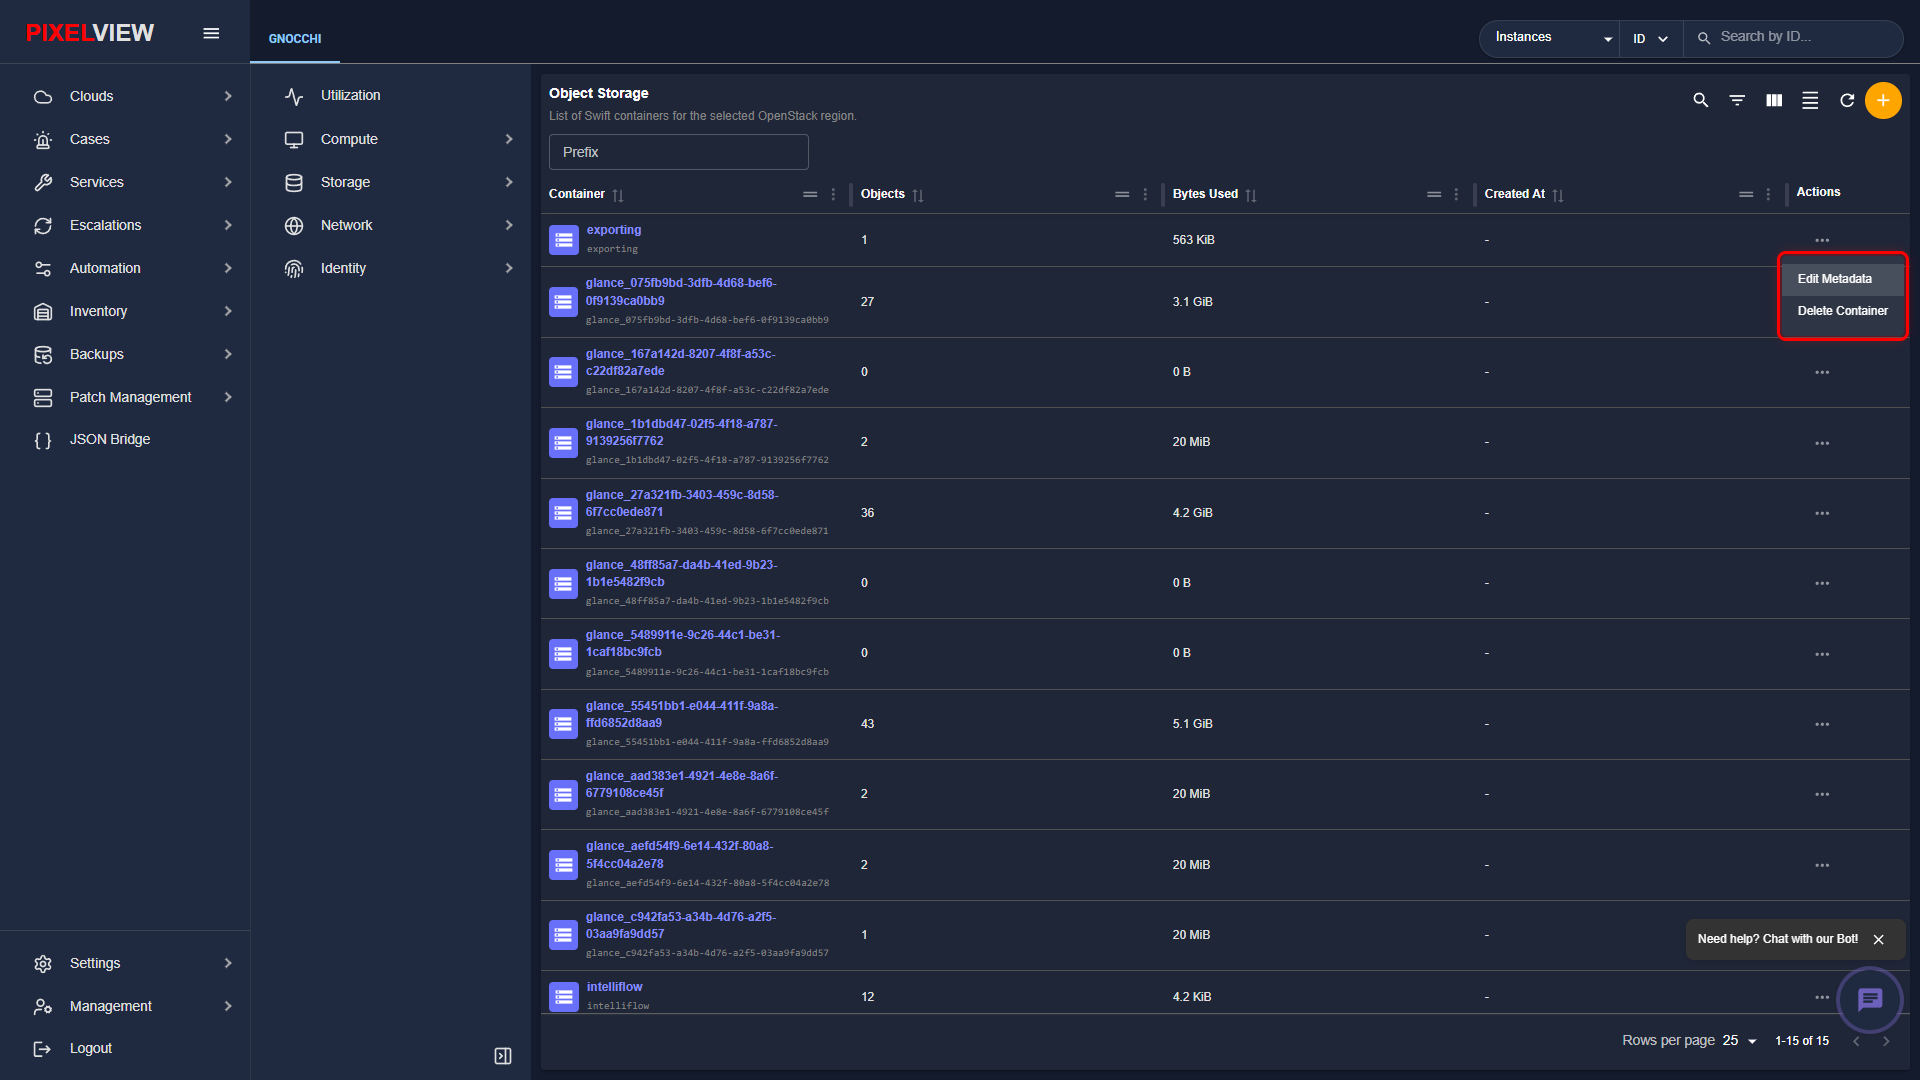
Clicking the three-dot (...) button on any container row exposes container-level actions:
Software-Defined Networking (Neutron & Octavia)
The Network submenu provides comprehensive control over software-defined networks, visual topologies, interfaces, routing, firewalls, elastic IPs, bandwidth QoS policies, and load balancers.
Networks & Subnets
Networks Table Overview
Navigate to Network → Networks in the secondary sidebar:
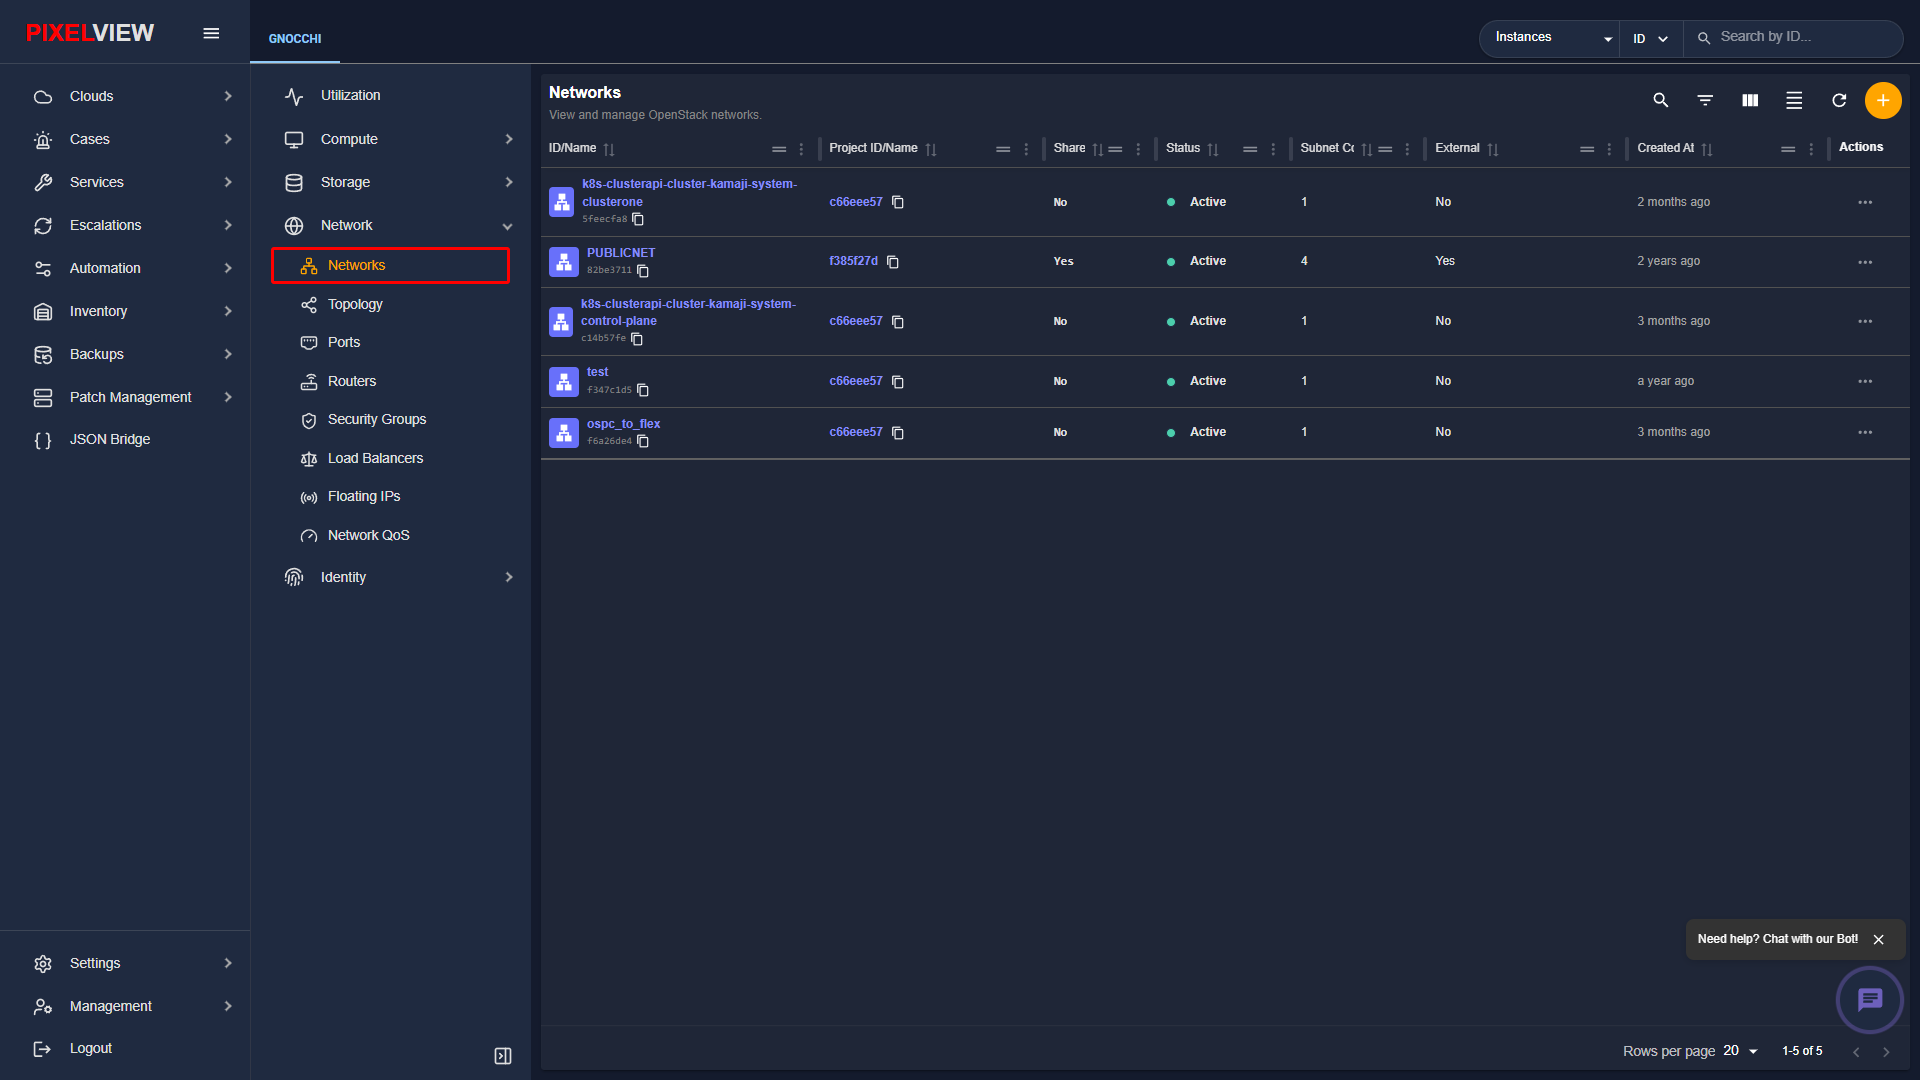
| Column | Description |
|---|---|
| ID / Name | Network label (e.g., PUBLICNET, internal tenant networks) and UUID. |
| Subnets Associated | List of CIDR subnets bound to the network with DHCP pool ranges. |
| Shared | Flag indicating if other tenant projects can attach interfaces to this network. |
| External Network | Indicates whether this network routes directly to the upstream internet/WAN. |
| Status | Network state: ACTIVE or DOWN. |
| Admin State | Administrative status: UP or DOWN. |
| Actions | Context menu shortcuts to Edit Network, Add Subnet, or Delete. |
Creating a Network & Subnet
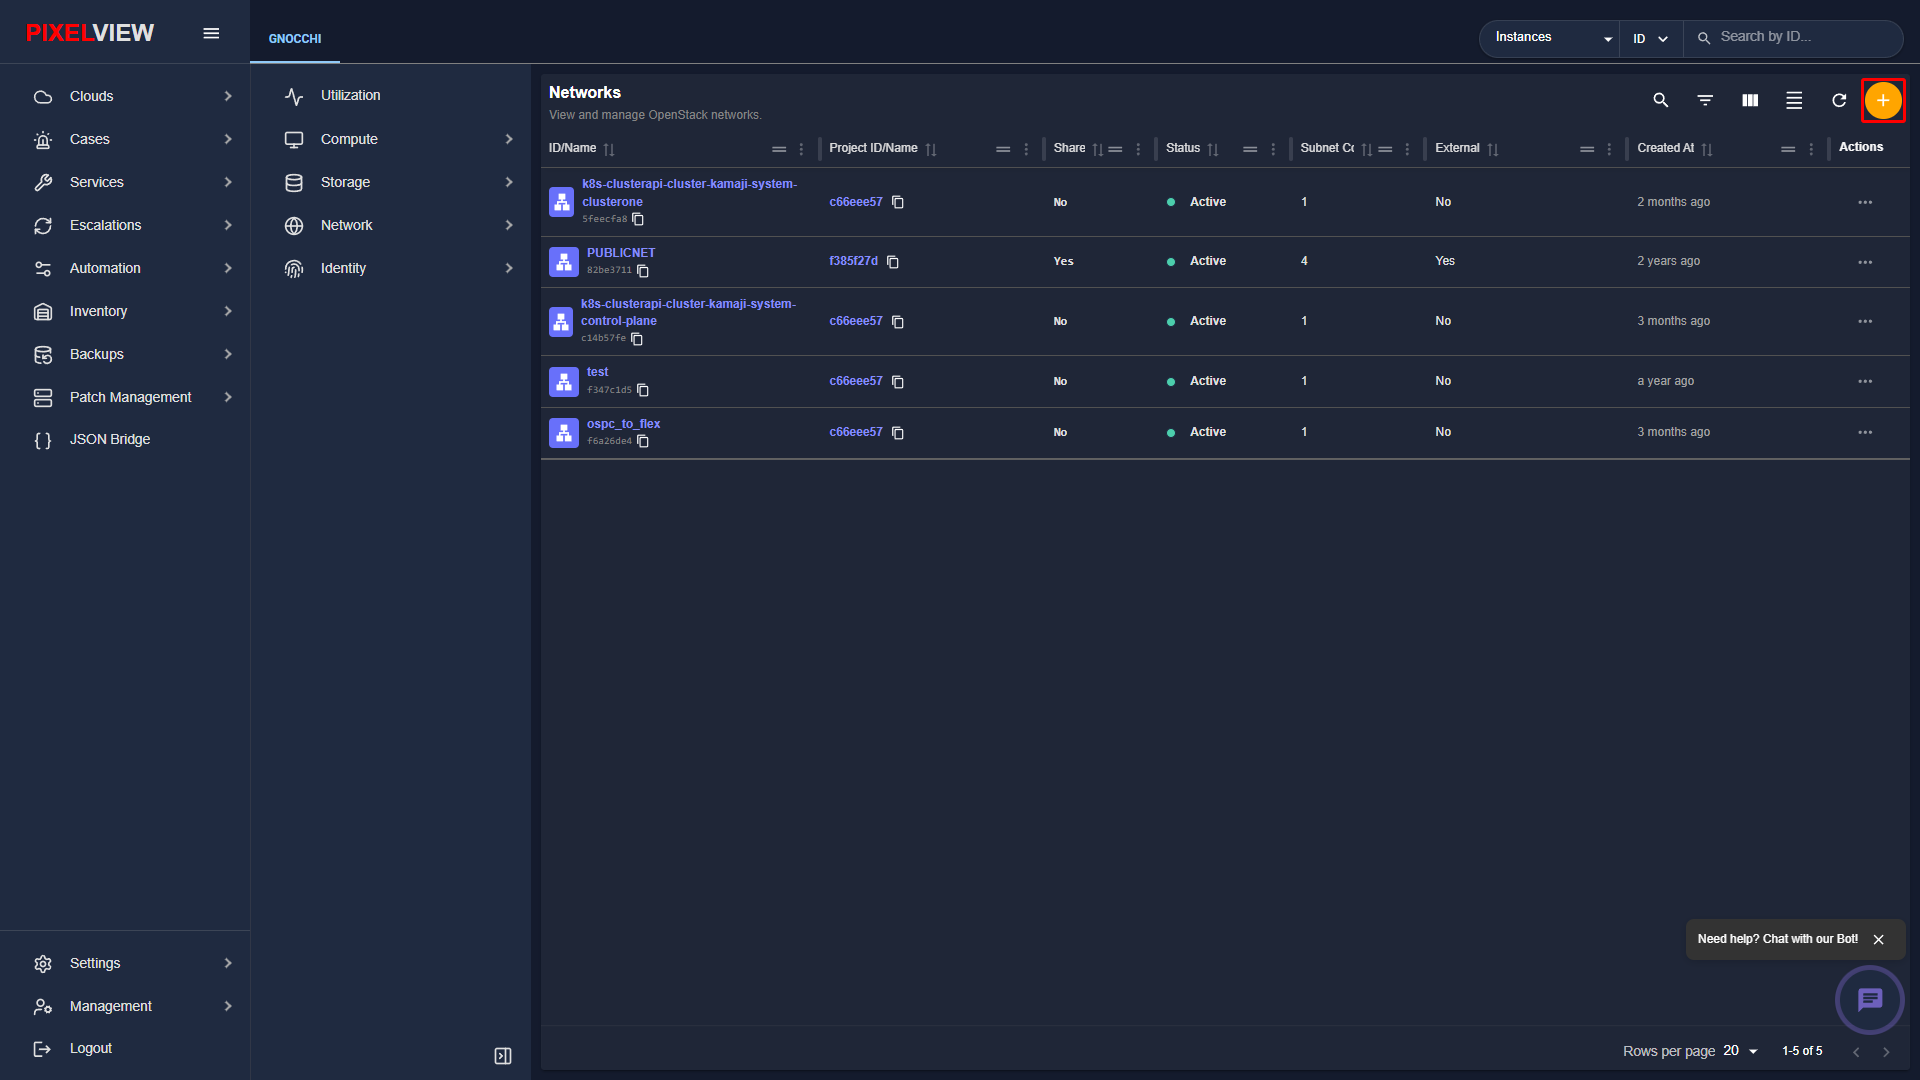
- Click the orange
+(Create Network) button in the top-right toolbar:
- The Create Network modal dialog opens:
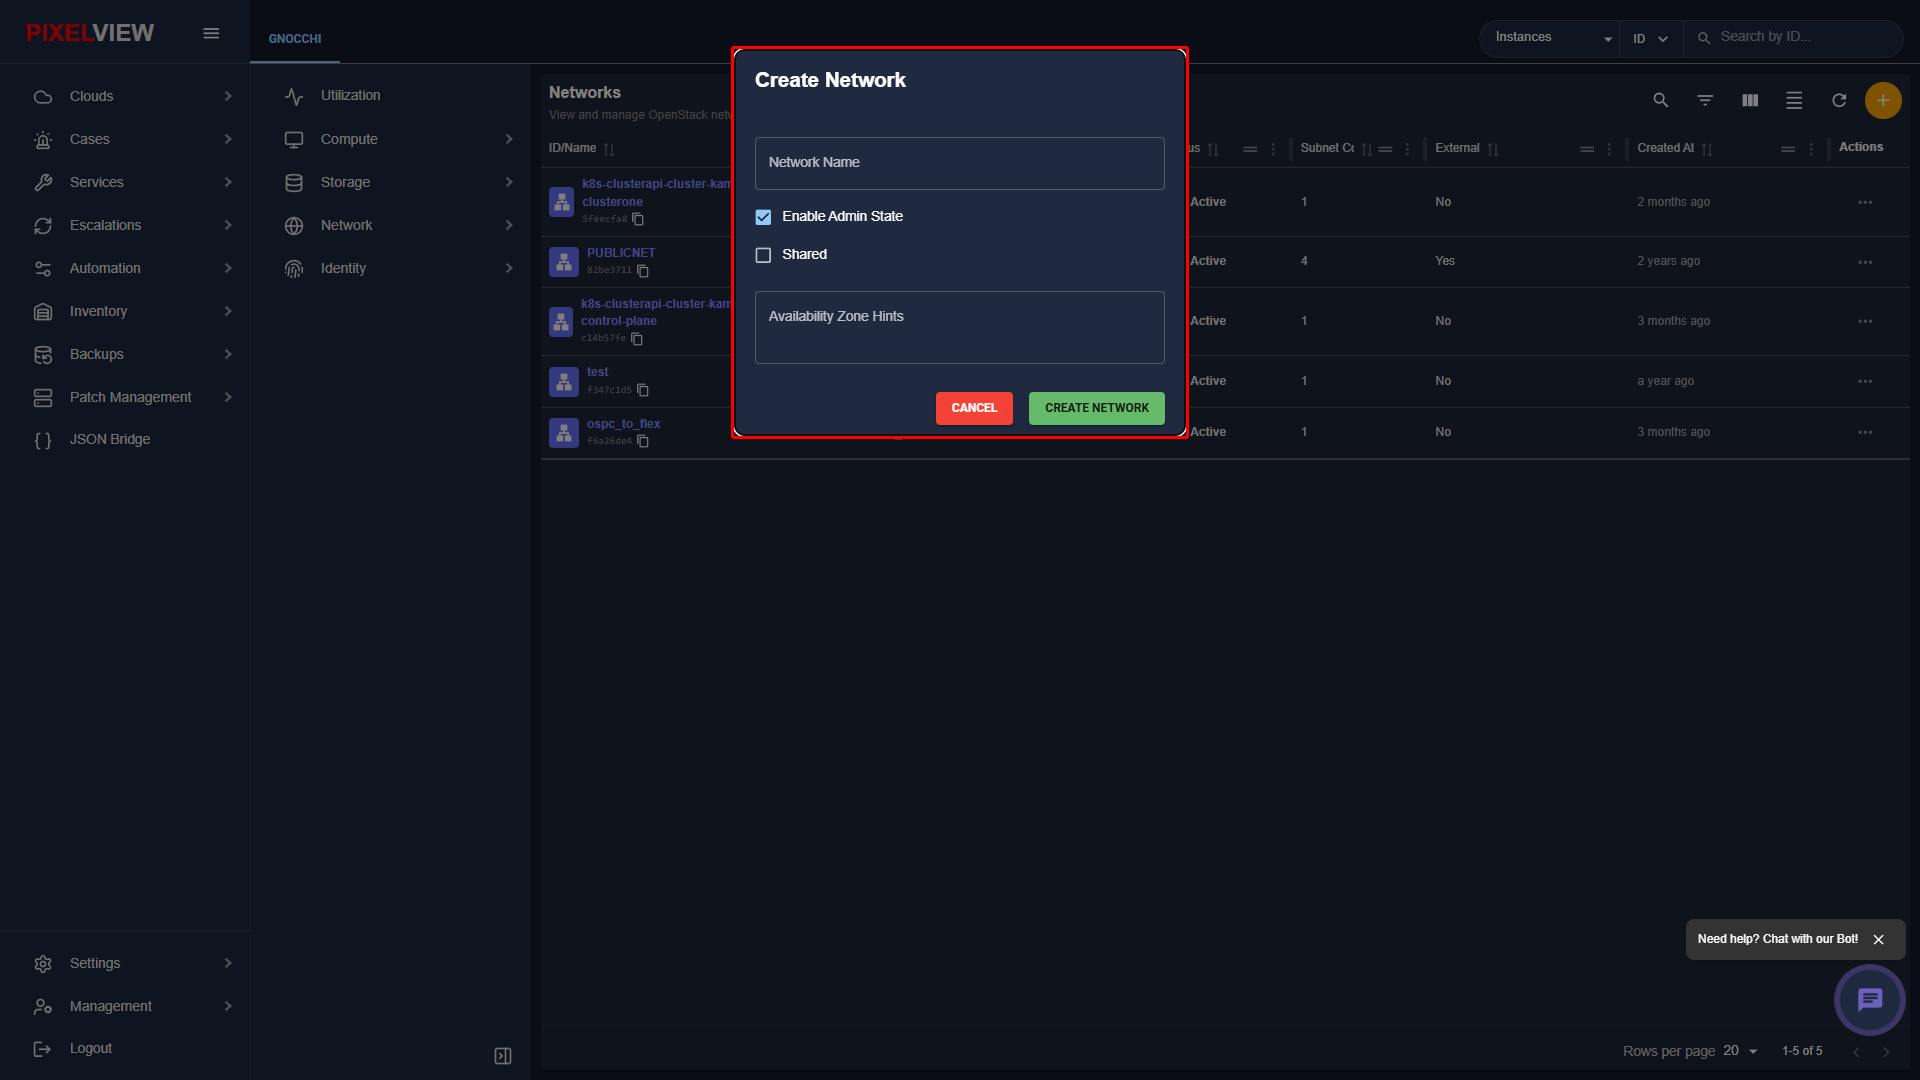
Network and Subnet Parameter Reference
| Step | Parameter | Description |
|---|---|---|
| Network | Network Name | Identifier for the L2 broadcast domain. |
| Enable Admin State | Flag setting administrative operational state to UP. | |
| Shared | Allow other tenant projects to attach virtual interfaces. | |
| Create Subnet | Checkbox to immediately configure an IP subnet. | |
| Subnet | Subnet Name | Descriptive label for the IP range. |
| Network Address | CIDR notation subnet (e.g., 192.168.10.0/24, 10.0.0.0/16). |
|
| IP Version | IPv4 or IPv6. |
|
| Gateway IP | Default gateway address for the subnet (e.g., 192.168.10.1). |
|
| Subnet Details | Enable DHCP | Automatically run Neutron dnsmasq DHCP agents on the subnet. |
| Allocation Pools | Explicit IP ranges reserved for dynamic lease assignment. | |
| DNS Name Servers | Upstream DNS resolver IPs (e.g., 1.1.1.1, 8.8.8.8). |
Network Details & Drill-Down
Clicking on any network name navigates to the Network Details page (/openstack/:regionName/networks/:uuid):
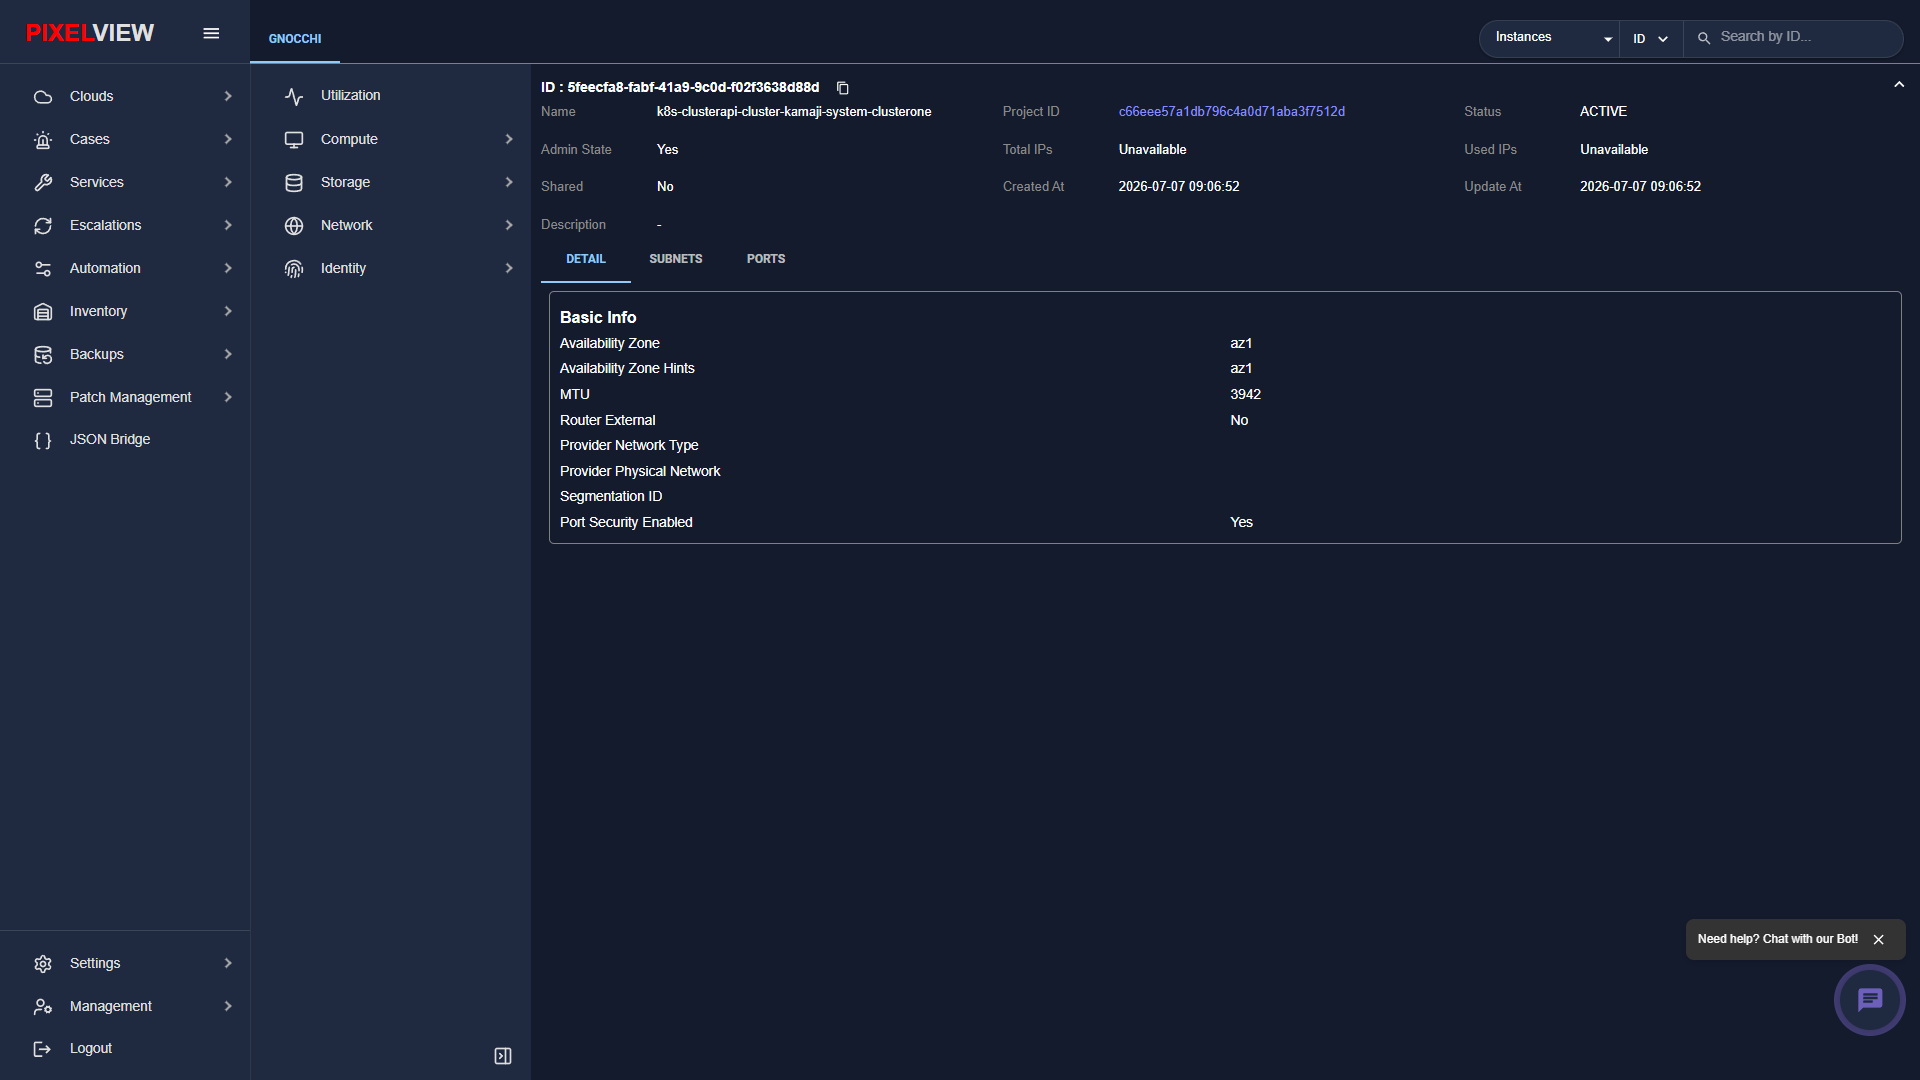
The Network Details page provides granular parameters across three tabs:
- DETAIL: Core L2 attributes including Availability Zone (az1), MTU (3942), External Router status, Provider Network Type, and Port Security enforcement (Yes).
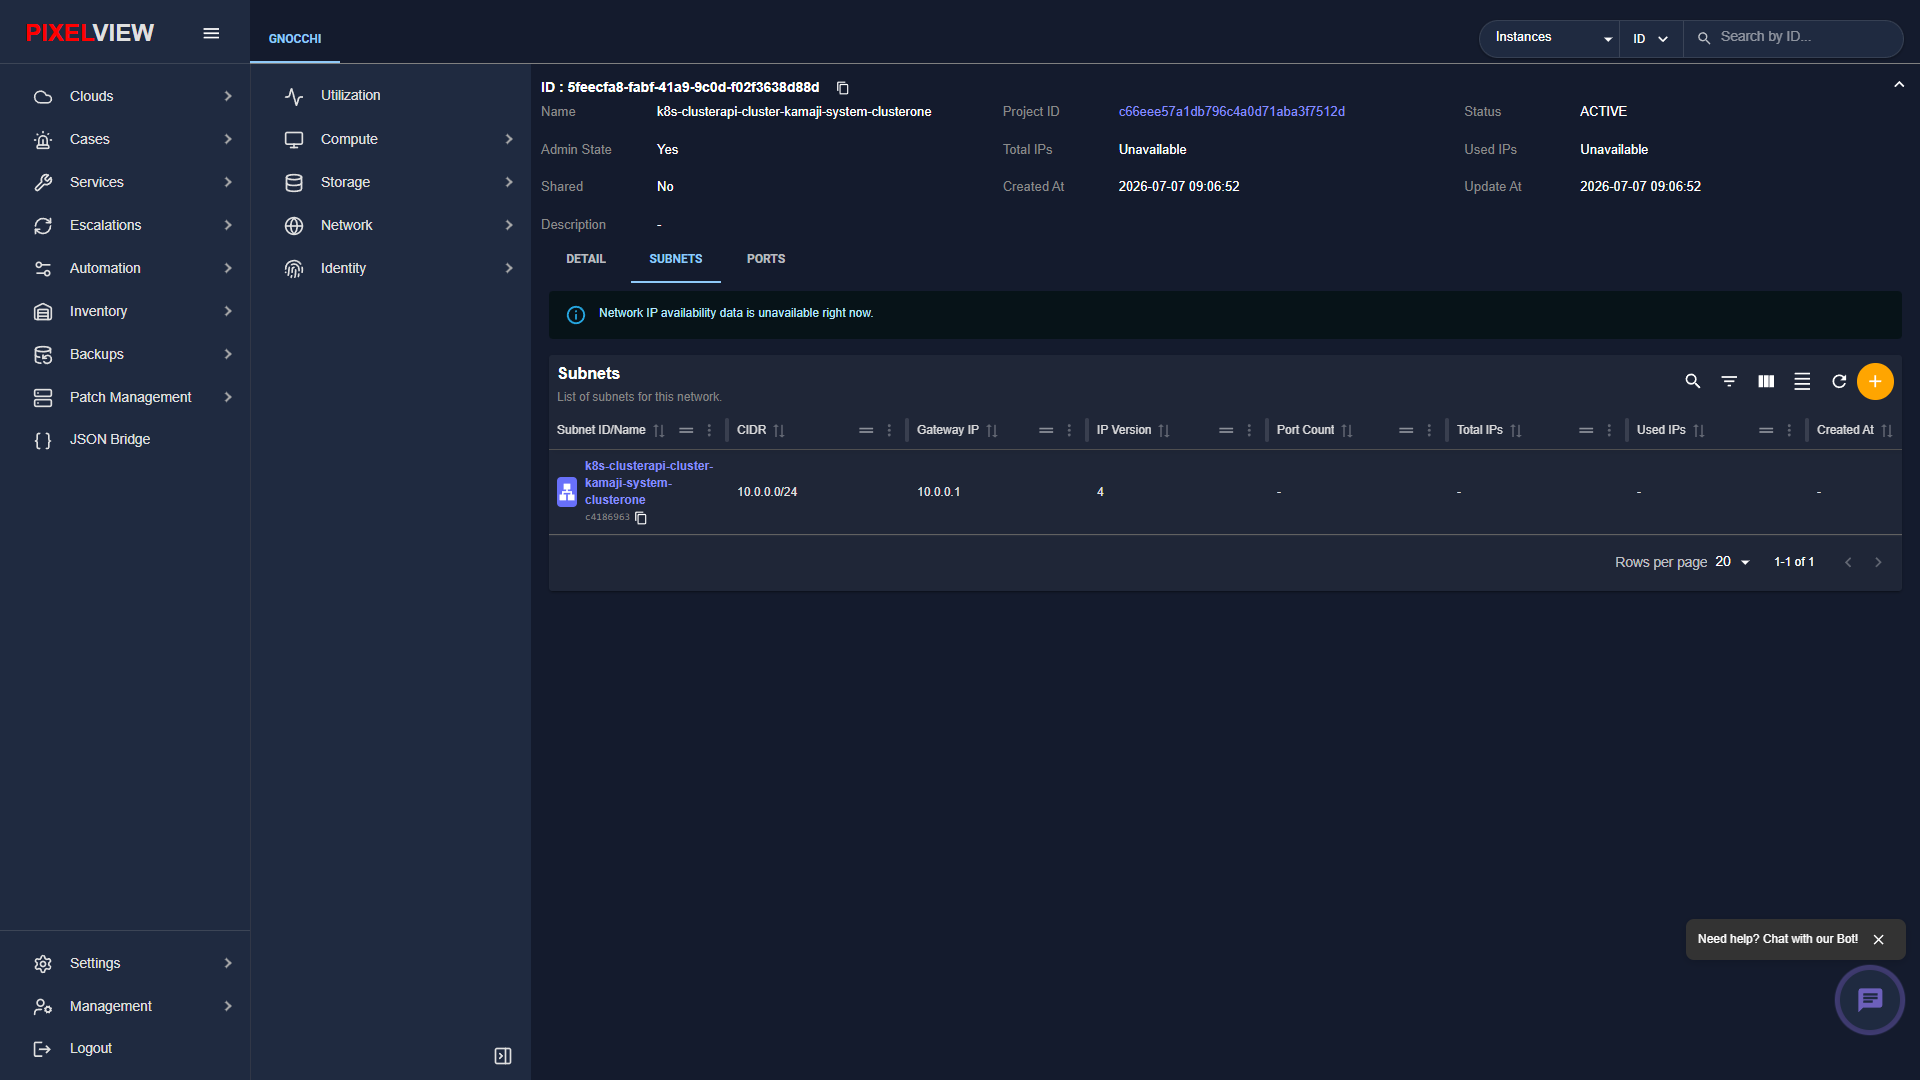
- SUBNETS: Detailed list of all IP subnets attached to this network.
- PORTS: Inventory of all virtual ports bound to this broadcast domain.
Network Subnets Tab
Clicking the SUBNETS tab displays every active CIDR block, DHCP pool range, and gateway address allocated to the network:
Creating Subnets within a Network
To configure a new subnet on an existing network:
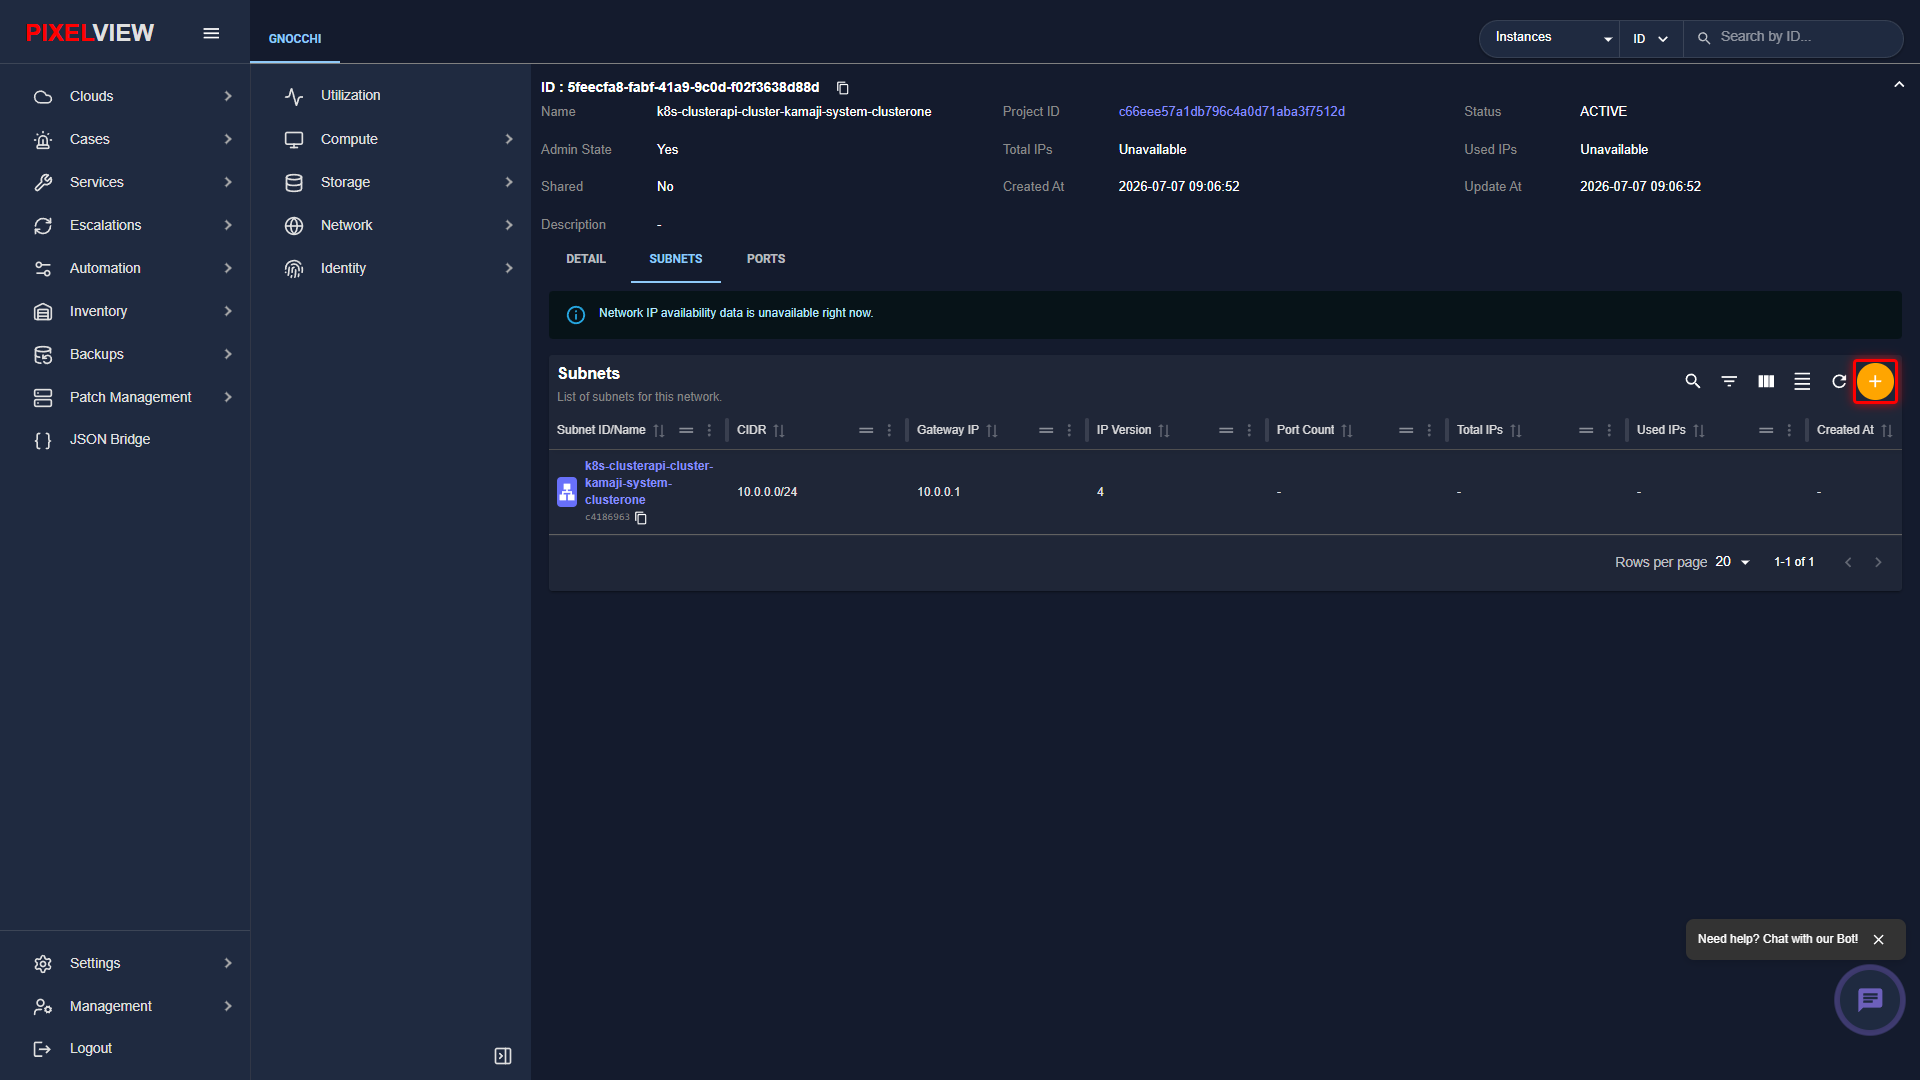
* On the network details page, navigate to the SUBNETS tab.
* Click the orange + (Add Subnet) button located on the subnets table toolbar:
- The Create Subnet modal dialog opens:
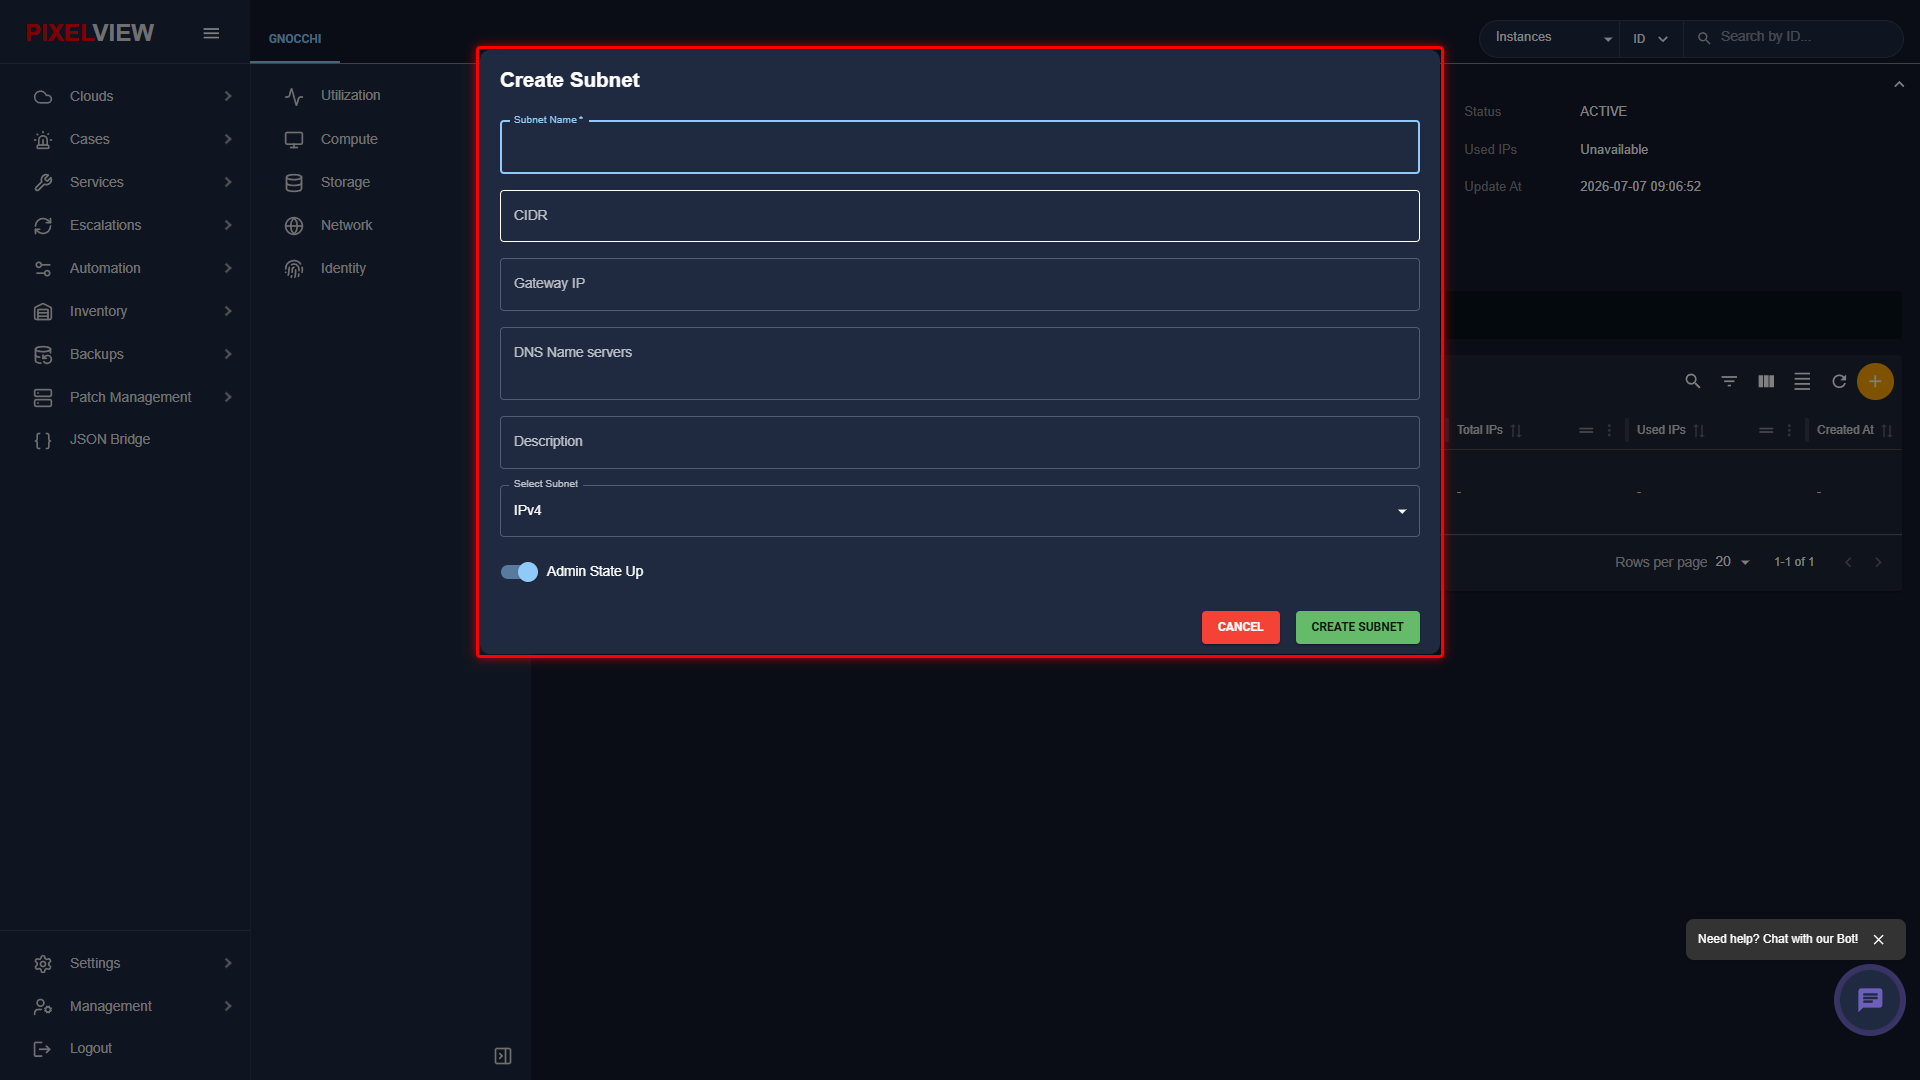
| Parameter | Type | Description |
|---|---|---|
| Subnet Name | Required Text | Label identifying the subnet (e.g., app-subnet-1, dmz-v4). |
| CIDR | Required Text | IP address range formatted in CIDR block notation (e.g., 10.0.10.0/24, 192.168.1.0/24). |
| Gateway IP | Optional Text | Specific default router gateway IP for workloads (defaults to .1 if omitted). |
| DNS Name servers | Optional Text | Comma-separated list of resolver IPs (e.g., 8.8.8.8, 1.1.1.1). |
| Description | Optional Text | Contextual notes regarding routing scope or security zone. |
| Select Subnet | Dropdown | IP version specification (IPv4 or IPv6). |
| Admin State Up | Toggle Switch | Administrative flag enabling or disabling packet forwarding across this subnet. |
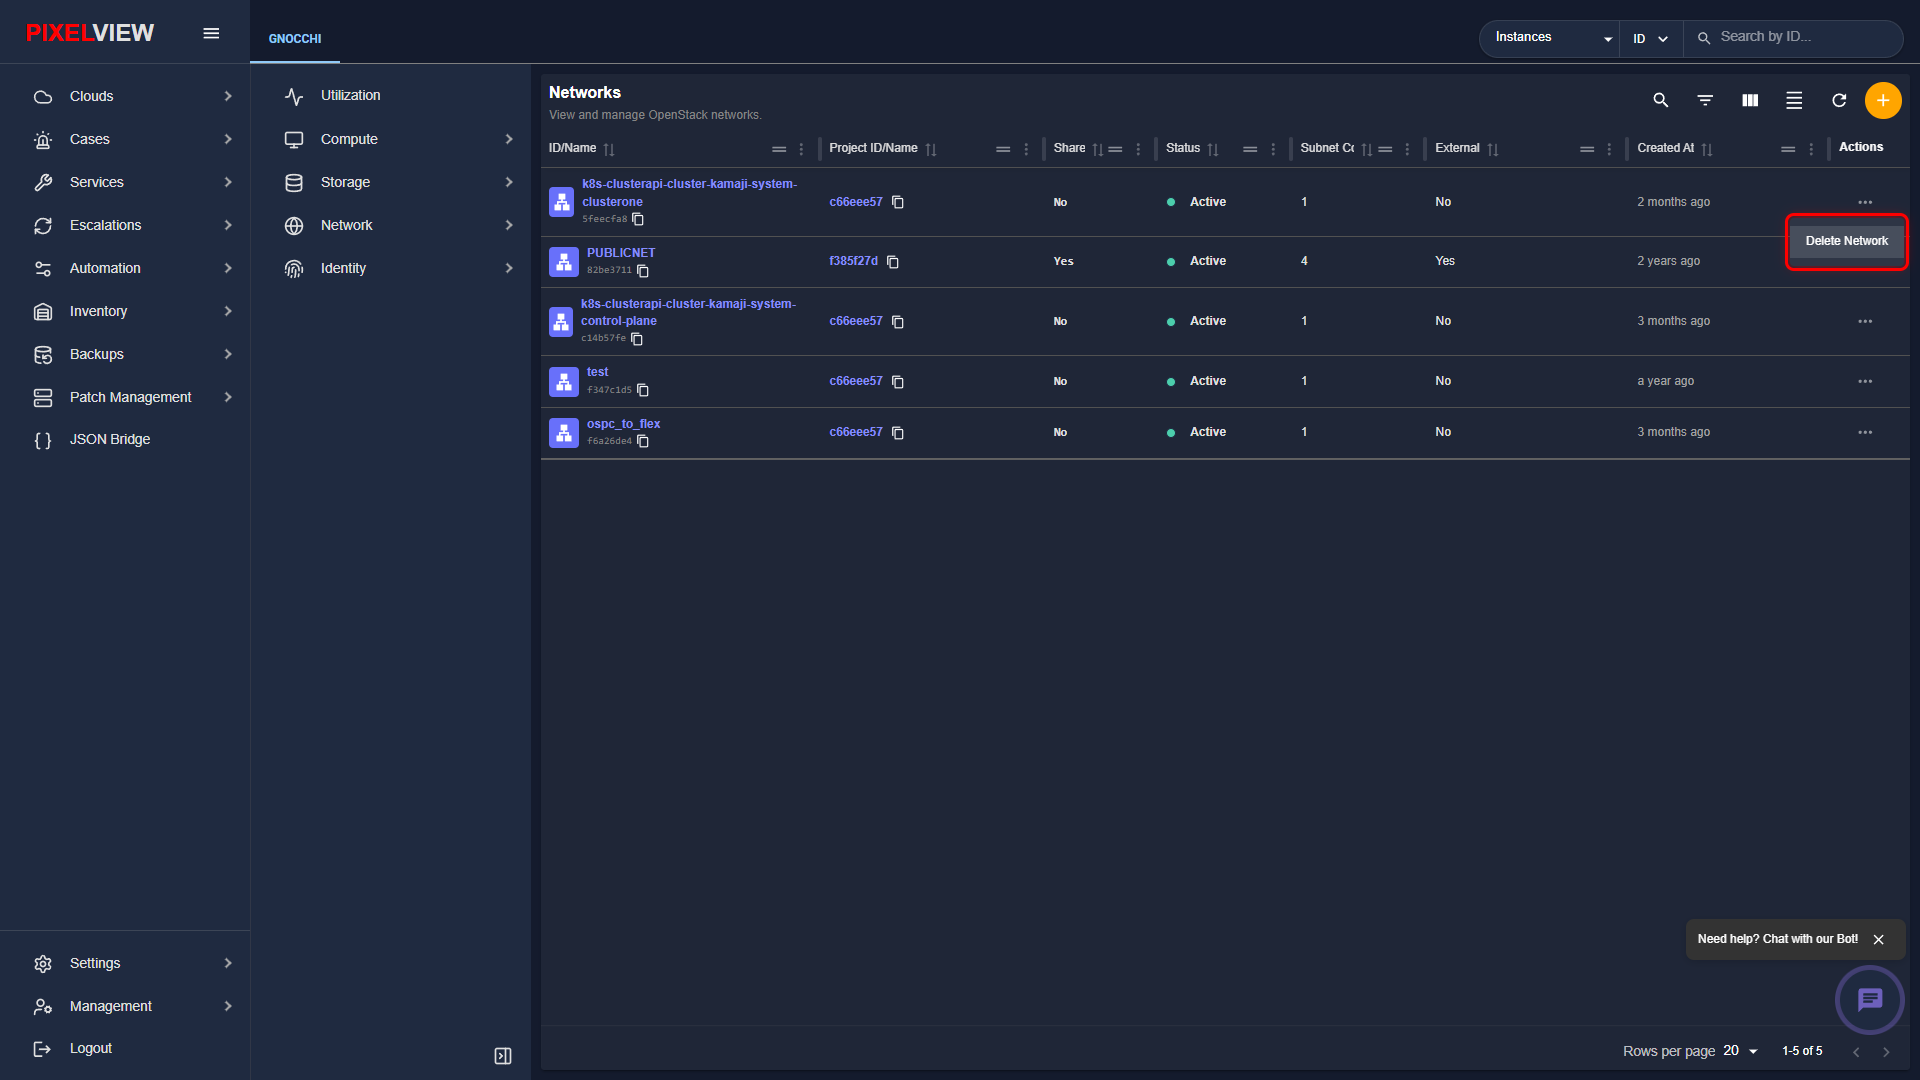
Networks Contextual Row Actions
In the Networks table, clicking the three-dot (...) button exposes row-level network actions:
Interactive Visual Network Topology
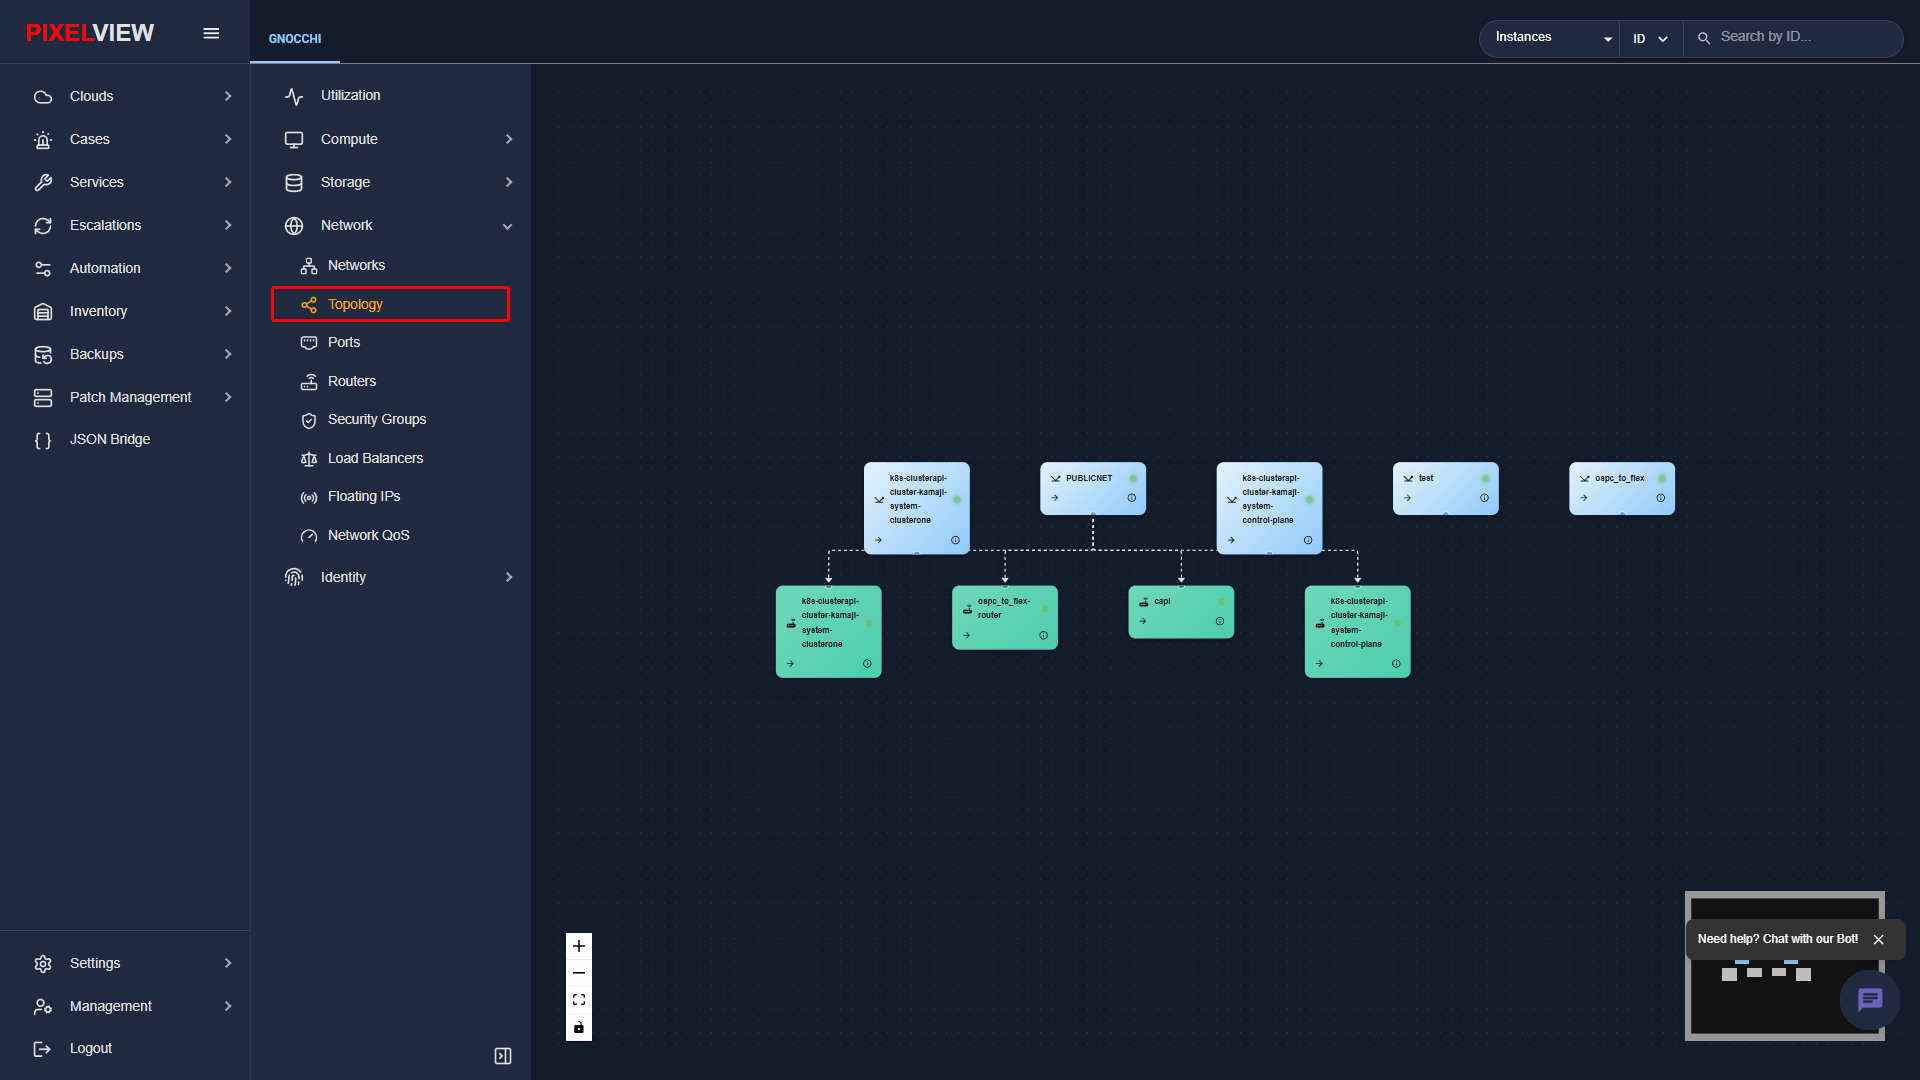
The Topology view (/openstack/:regionName/topology) delivers a dynamic, interactive visual map representing the complete multi-tenant network fabric in real time.
Navigate to Network → Topology in the secondary sidebar:
Topology Visual Elements
- External Networks: Rendered as orange cloud nodes representing WAN gateway uplinks.
- Virtual Routers: Central routing icons depicting gateway forwarding points.
- Tenant Networks: Dedicated color-coded horizontal conduits showing isolated L2 segments.
- Compute Instances: Virtual machine nodes connected to their respective network wires with real-time status badges.
- Interactive Canvas Controls:
- Zoom In / Zoom Out: Pan and inspect complex topologies with hundreds of endpoints.
- Fit-to-Screen: Center and scale the entire regional topology in one click.
- Element Selection: Clicking any instance, router, or network node displays an instant side drawer showing live IP bindings and traffic stats.
Network Ports (Interfaces & Virtual Bindings)
The Ports inventory (/openstack/:regionName/ports) provides granular visibility and operational control over every virtual network interface (VIF) created across tenant networks, routers, compute instances, and Octavia load balancers.
Ports Table Overview
Navigate to Network → Ports in the secondary sidebar:
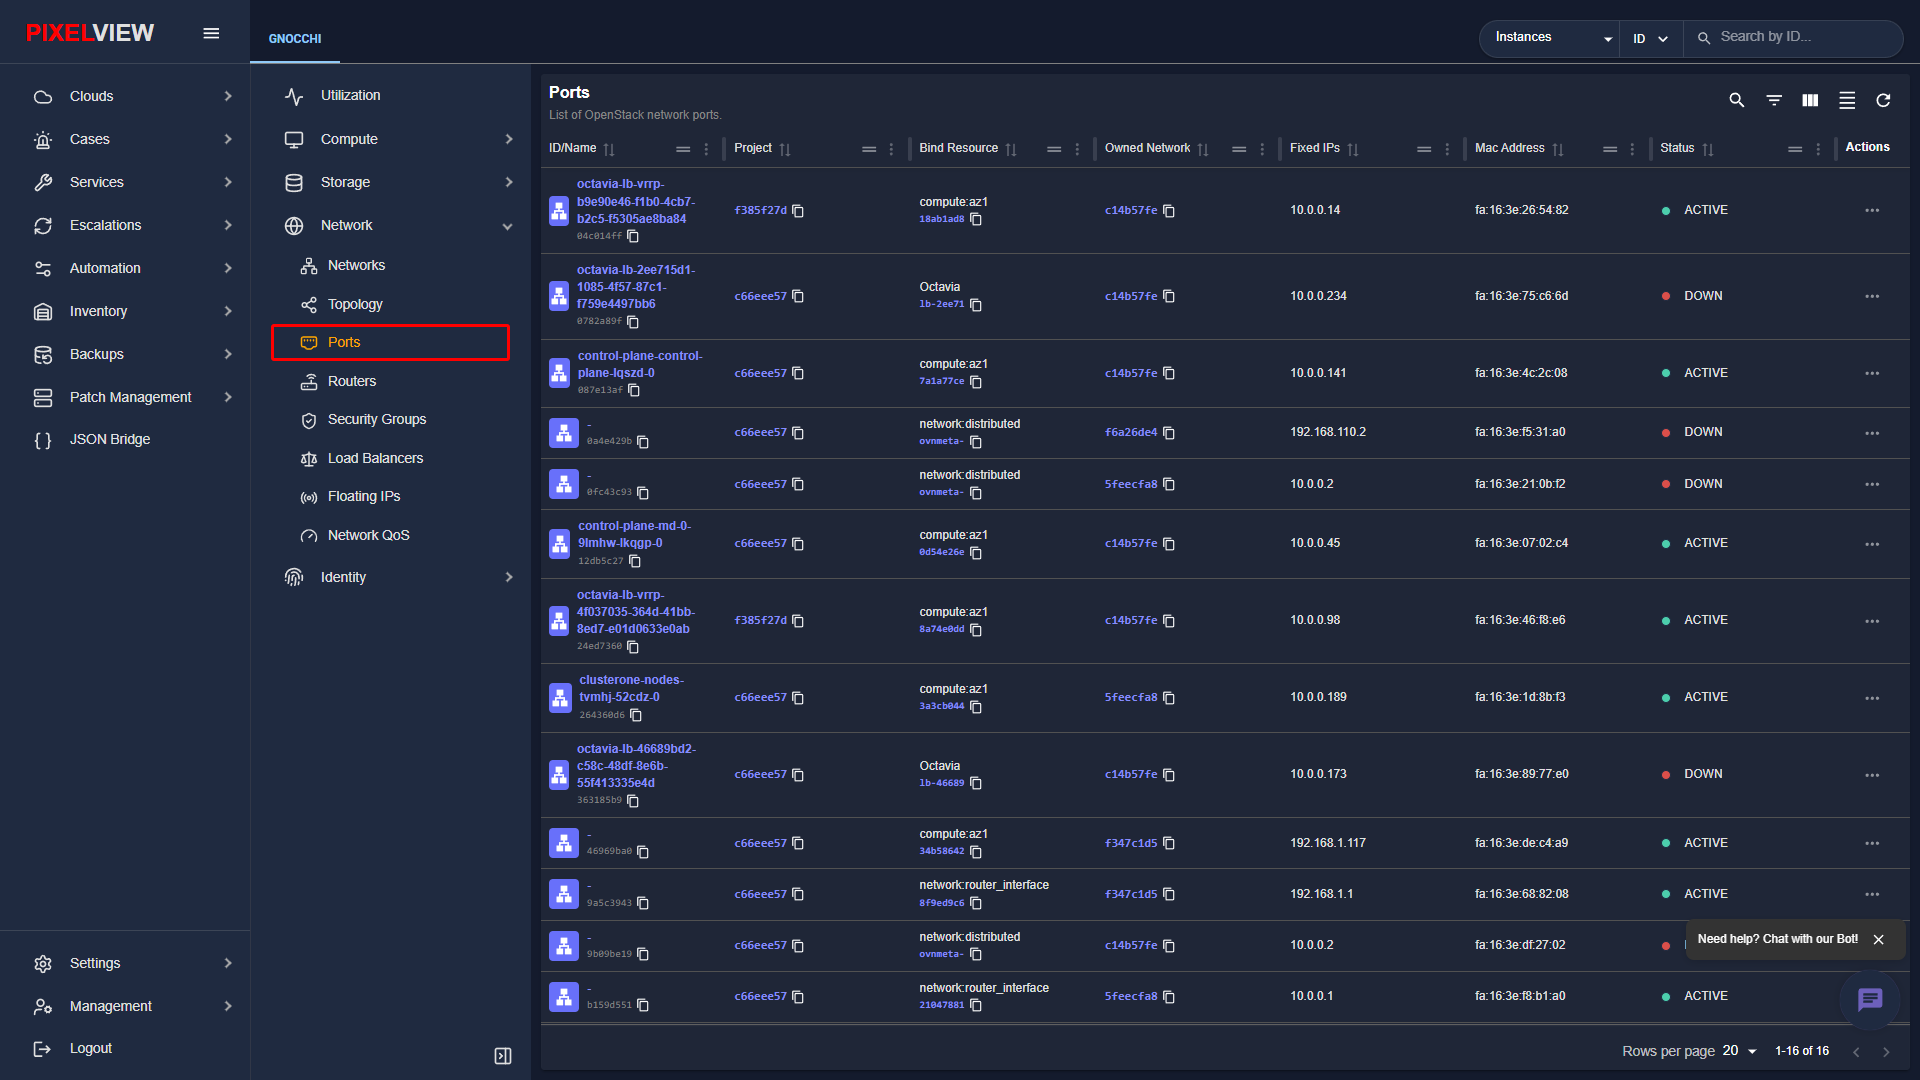
| Column | Description |
|---|---|
| ID / Name | Port identifier, optional display name, and system UUID. |
| Project | Owning project boundary UUID. |
| Bind Resource | The attached OpenStack entity consuming the interface (e.g., compute:az1 for VMs, Octavia for load balancer amphorae, or network:router_interface for router gateways). |
| Owned Network | The underlying Neutron network UUID hosting the subnet. |
| Fixed IPs | The assigned private IP address bound to the interface (e.g., 10.0.0.14, 192.168.1.117). |
| Mac Address | Unique virtual hardware MAC address assigned by Neutron (e.g., fa:16:3e:26:54:82). |
| Status | Real-time port link status: ACTIVE (connected and passing traffic) or DOWN (unbound or idle). |
| Actions | Context menu shortcuts to update port attributes, associate security groups, or delete interfaces. |
- Creation Workflow: Virtual network ports do not have a manual toolbar
+button in this view because they are automatically provisioned and managed by Nova when attaching network interfaces to virtual instances, or by Octavia when configuring load balancer VIPs.
Virtual Routers
Virtual routers provide Layer 3 packet forwarding between private tenant subnets and upstream external networks, enabling SNAT/DNAT internet routing.
Routers Table Overview
Navigate to Network → Routers in the secondary sidebar:
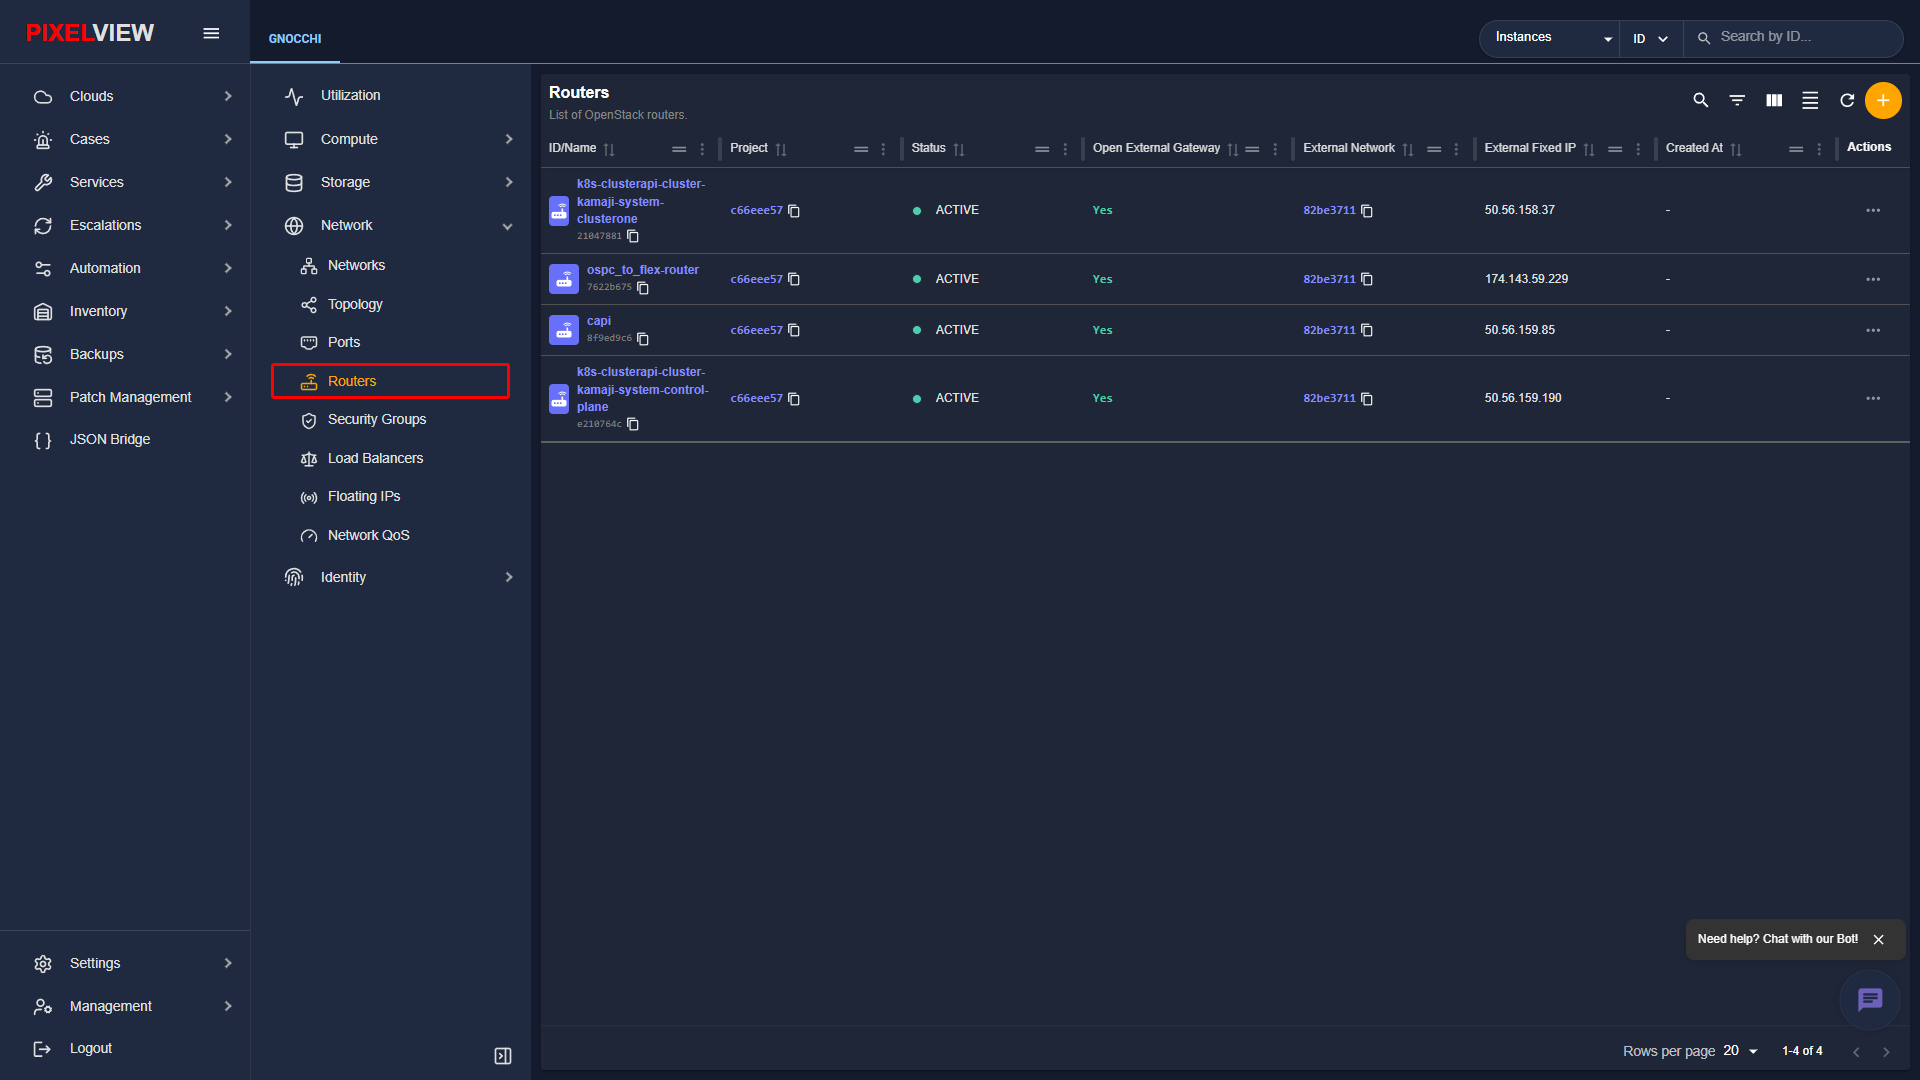
| Column | Description |
|---|---|
| ID / Name | Router name and UUID. |
| Status | Operational state: ACTIVE or DOWN. |
| External Network | Upstream external gateway network providing WAN connectivity. |
| SNAT | Indicates if Source Network Address Translation is enabled. |
| Admin State | Administrative state (UP/DOWN). |
| Actions | Shortcuts to Add Interface, Manage Static Routes, or Delete Router. |
Creating a Router
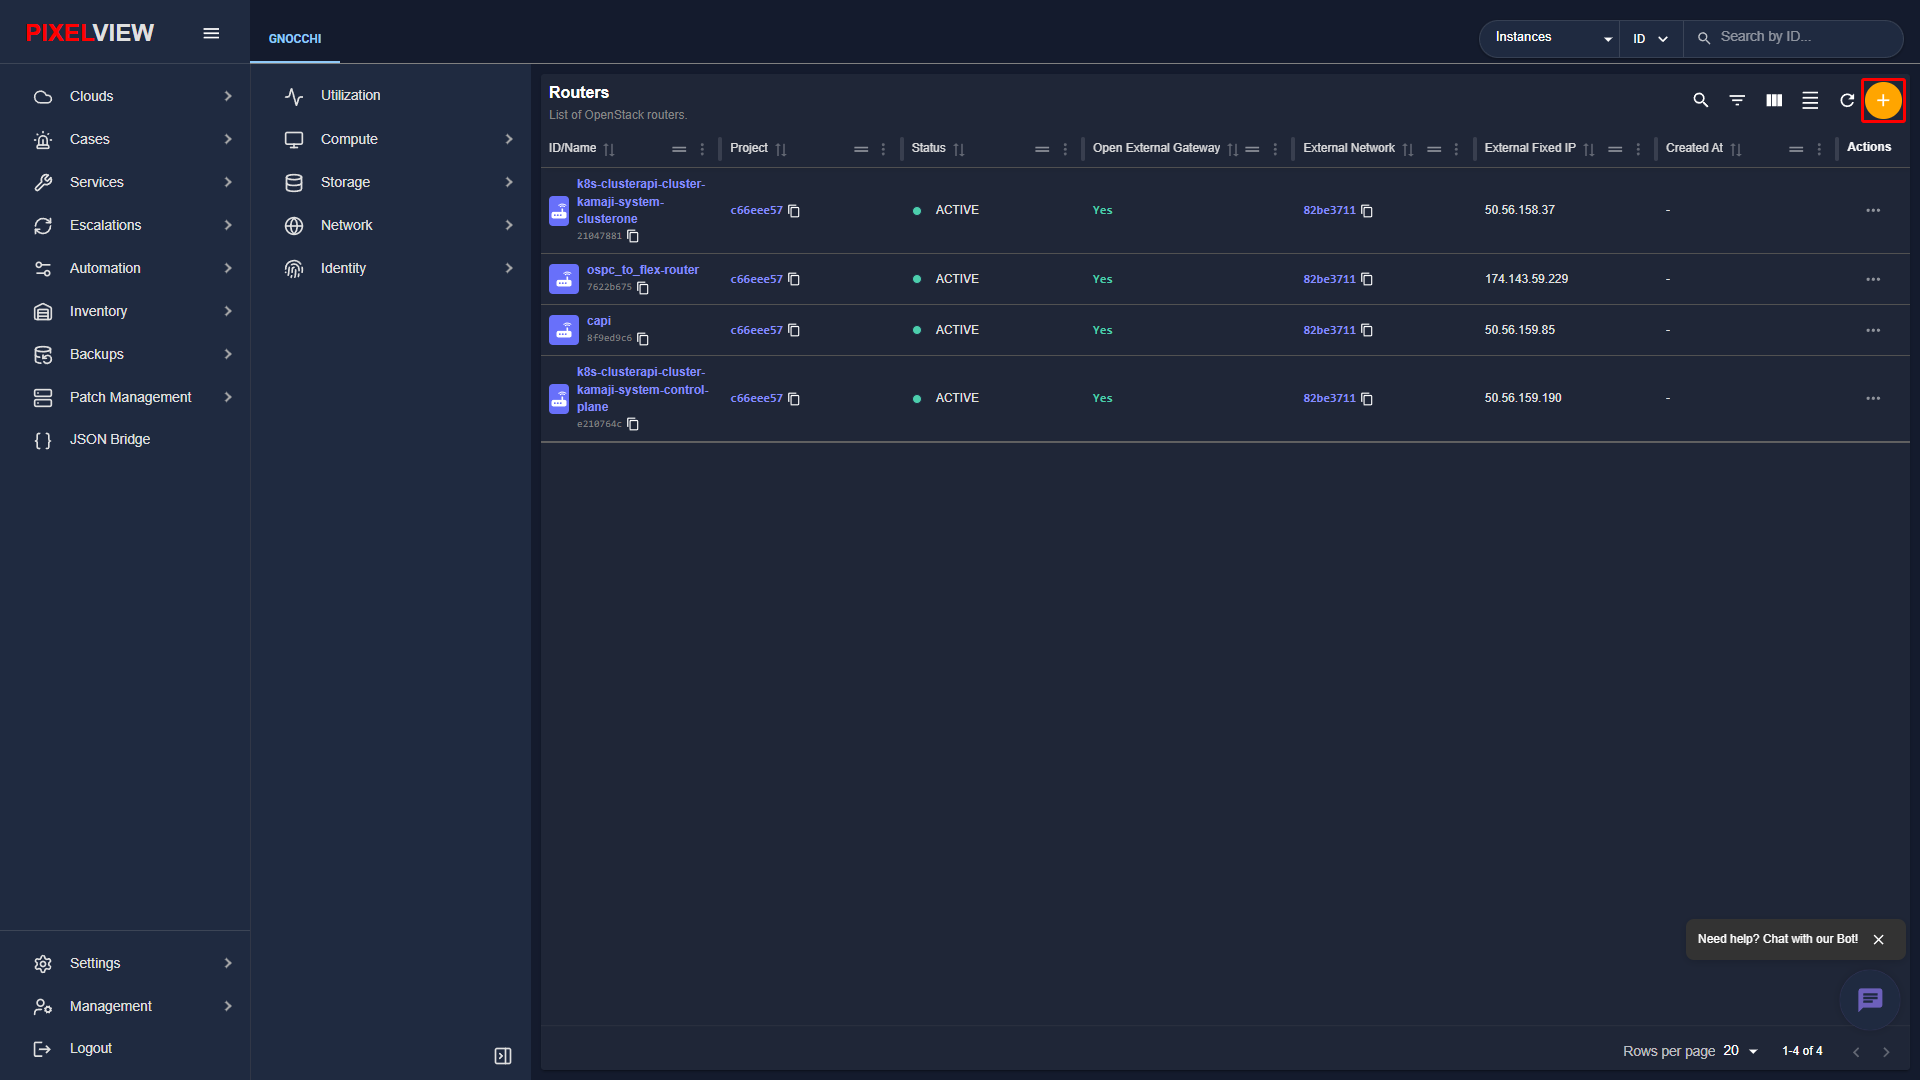
- Click the orange
+(Create Router) button in the top-right toolbar:
- The Create Router modal dialog opens:
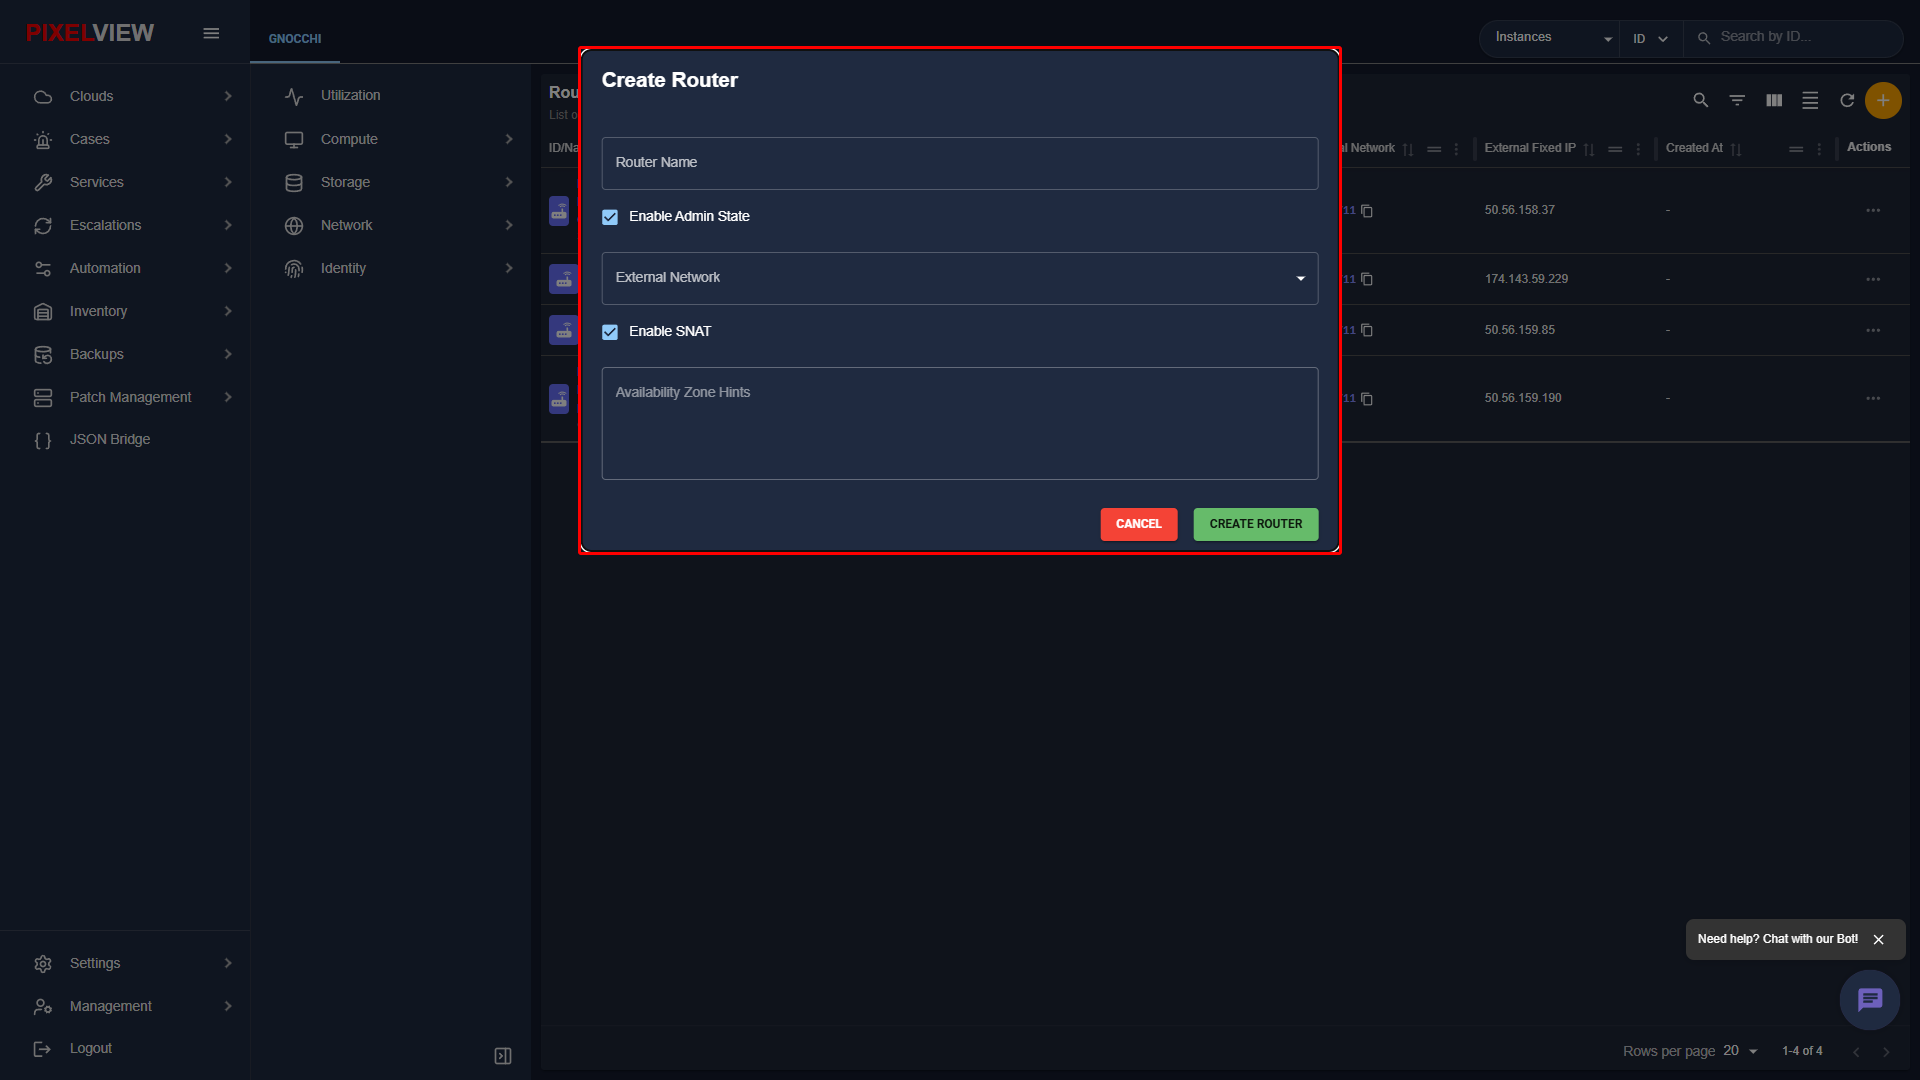
| Parameter | Description |
|---|---|
| Router Name | Display identifier for the L3 gateway router. |
| Admin State | Initial operational status (UP/DOWN). |
| External Network | Select the upstream external gateway network (e.g., PUBLICNET) to enable SNAT for outbound traffic. |
| Enable SNAT | Checkbox to automatically translate private tenant IPs to the router's external gateway IP. |
Router Details & Drill-Down
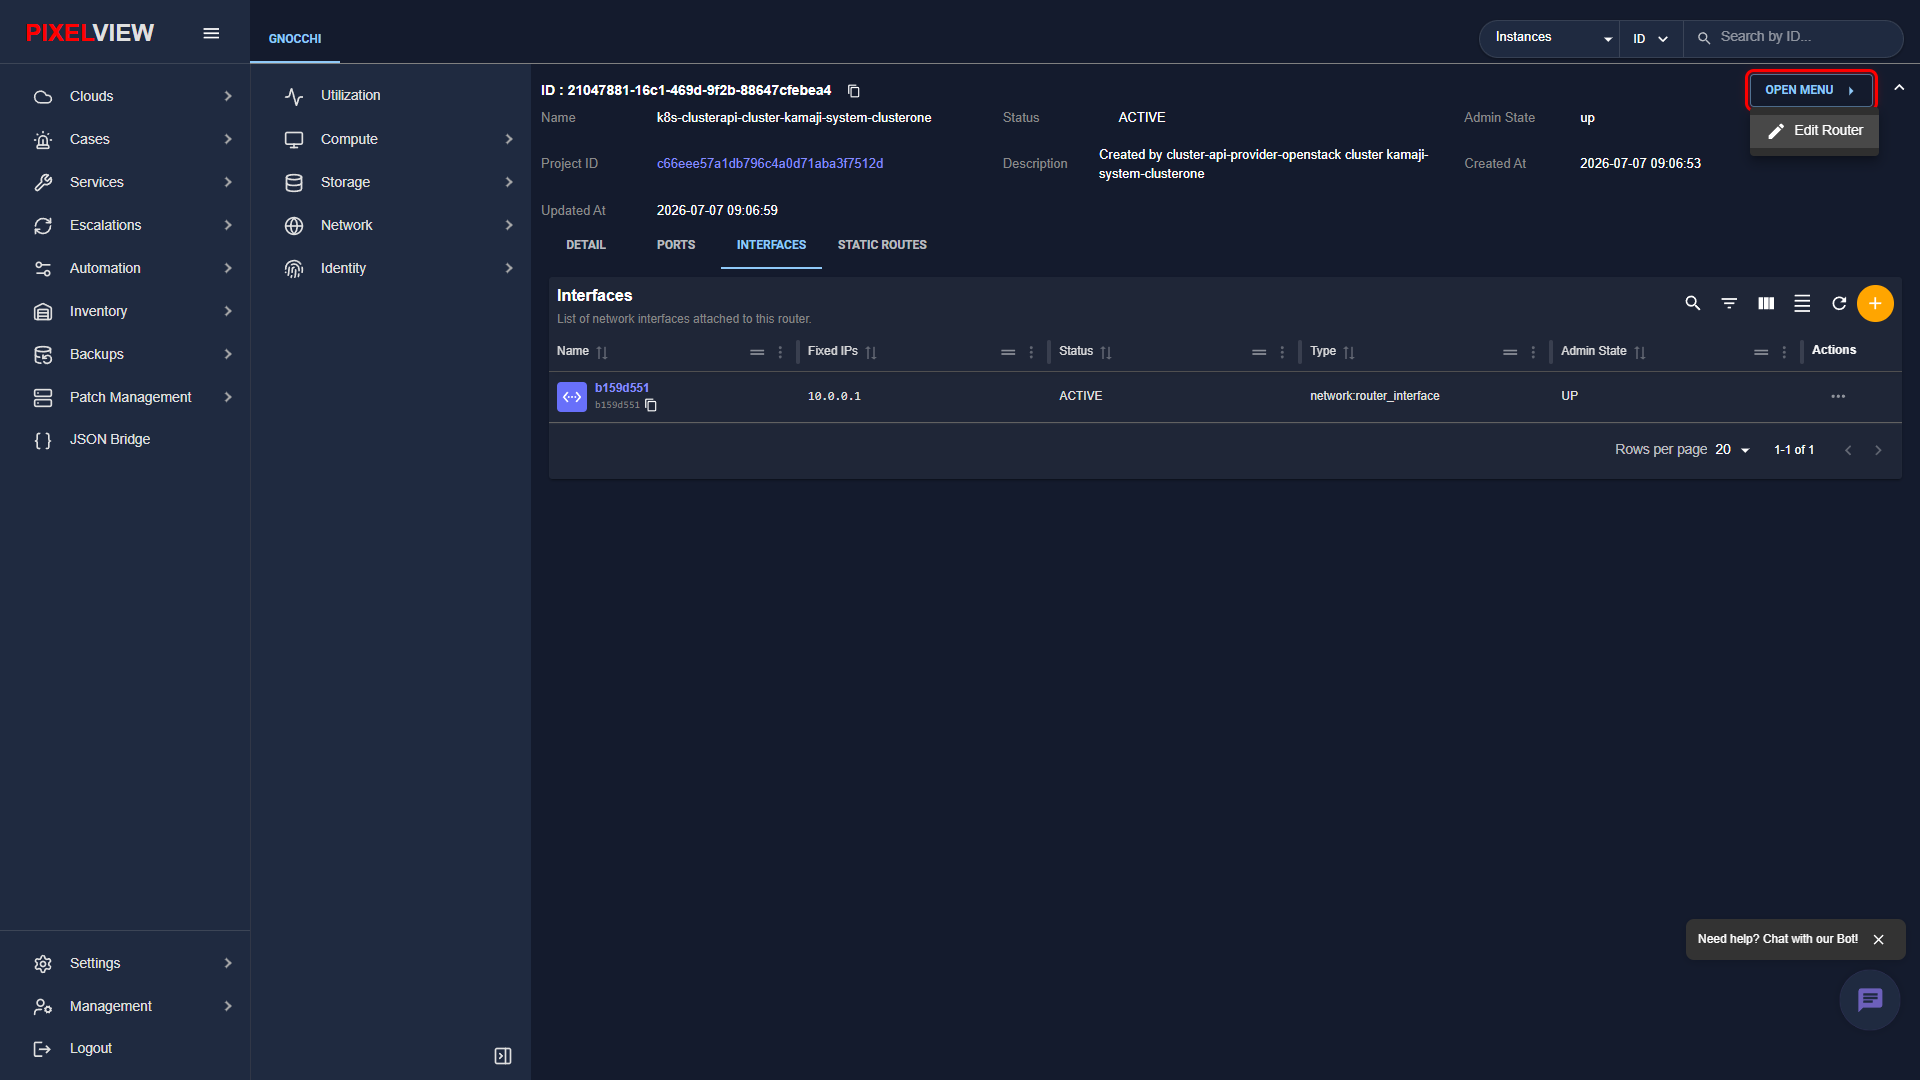
Clicking on any router name in the table navigates to the Router Details page (/openstack/:regionName/routers/:uuid):
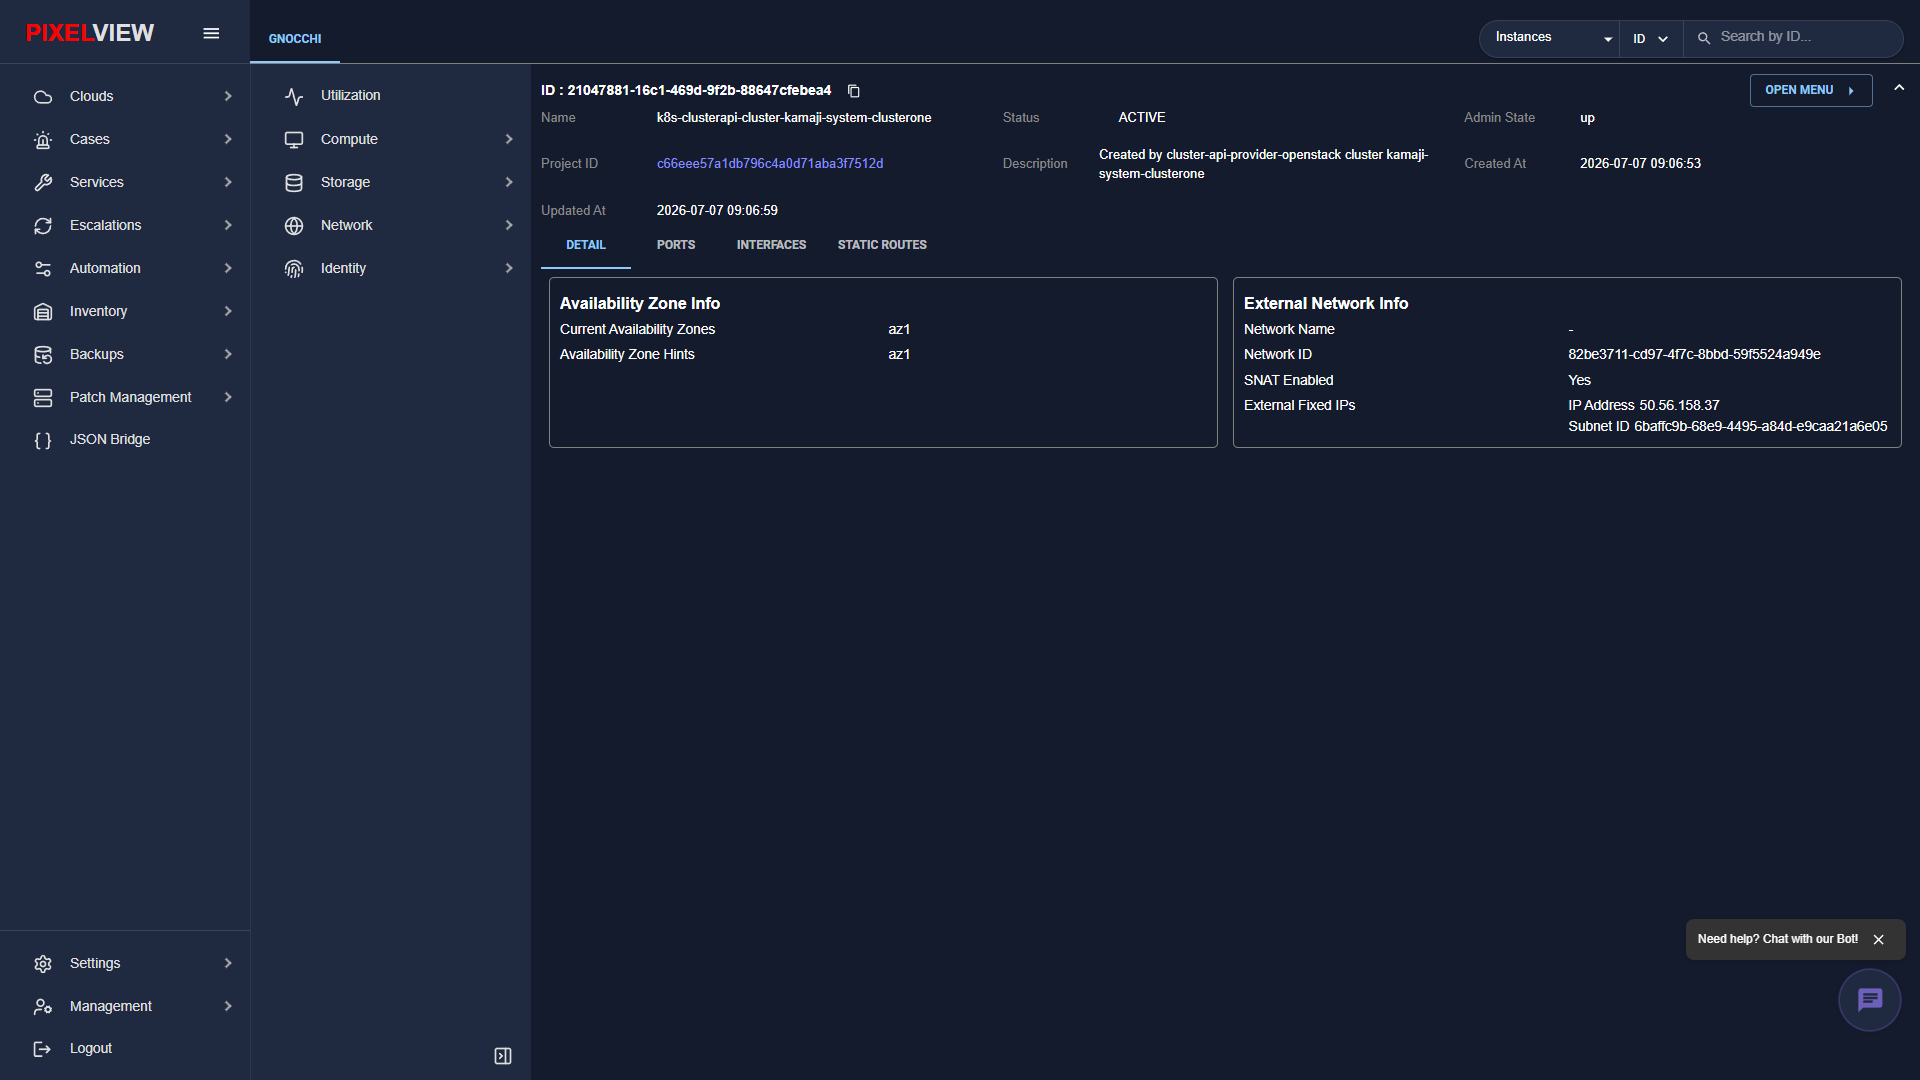
The Router Details page features multiple dedicated tabs:
- DETAIL: Displays Availability Zone parameters, External Network Gateway details, SNAT status (Yes), and assigned External Fixed IP endpoint.
- PORTS: Inventory of all virtual ports bound to this router.
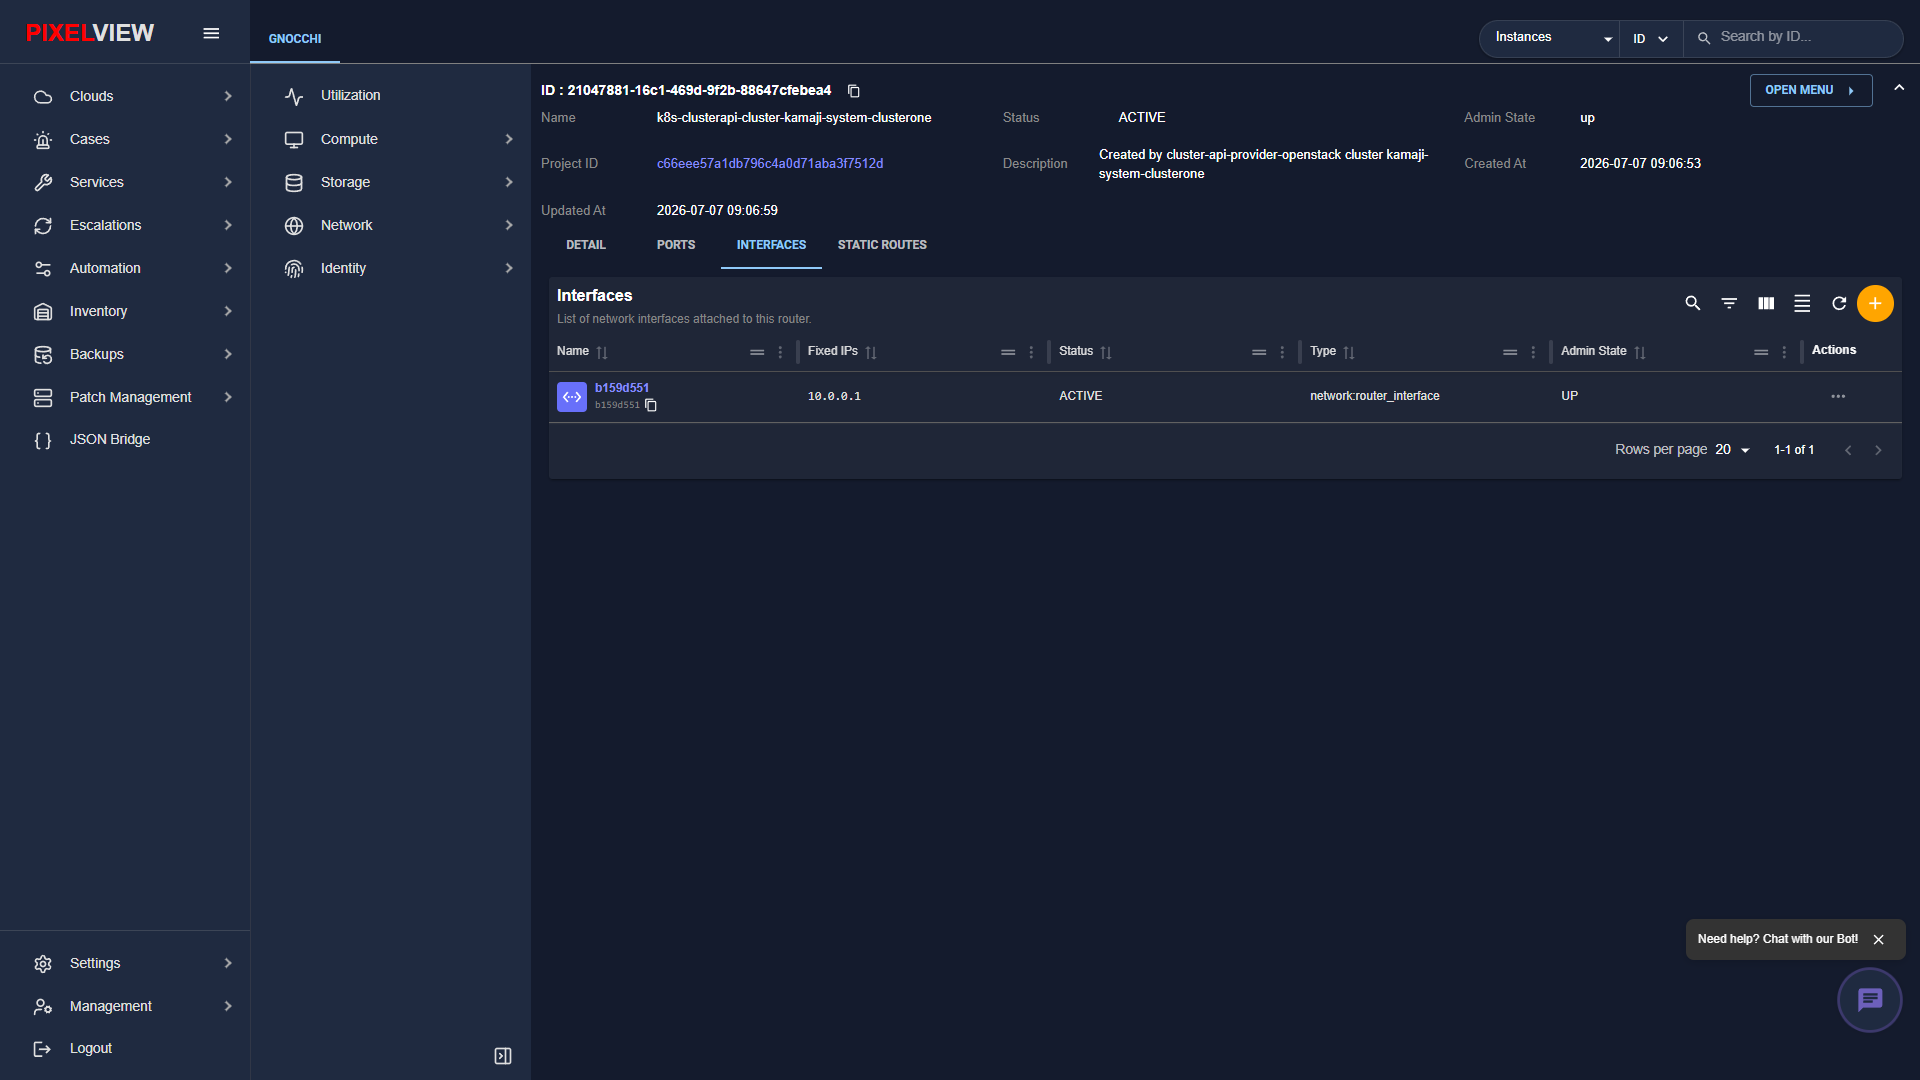
- INTERFACES: Connected internal subnet interfaces and gateway ports.
- STATIC ROUTES: User-configured explicit Layer 3 static routing tables.
Router Interfaces Tab
Clicking the INTERFACES tab displays the internal network interfaces attached to the router, showing subnet IP allocations, interface IDs, and admin states:
Attaching Interfaces to a Router
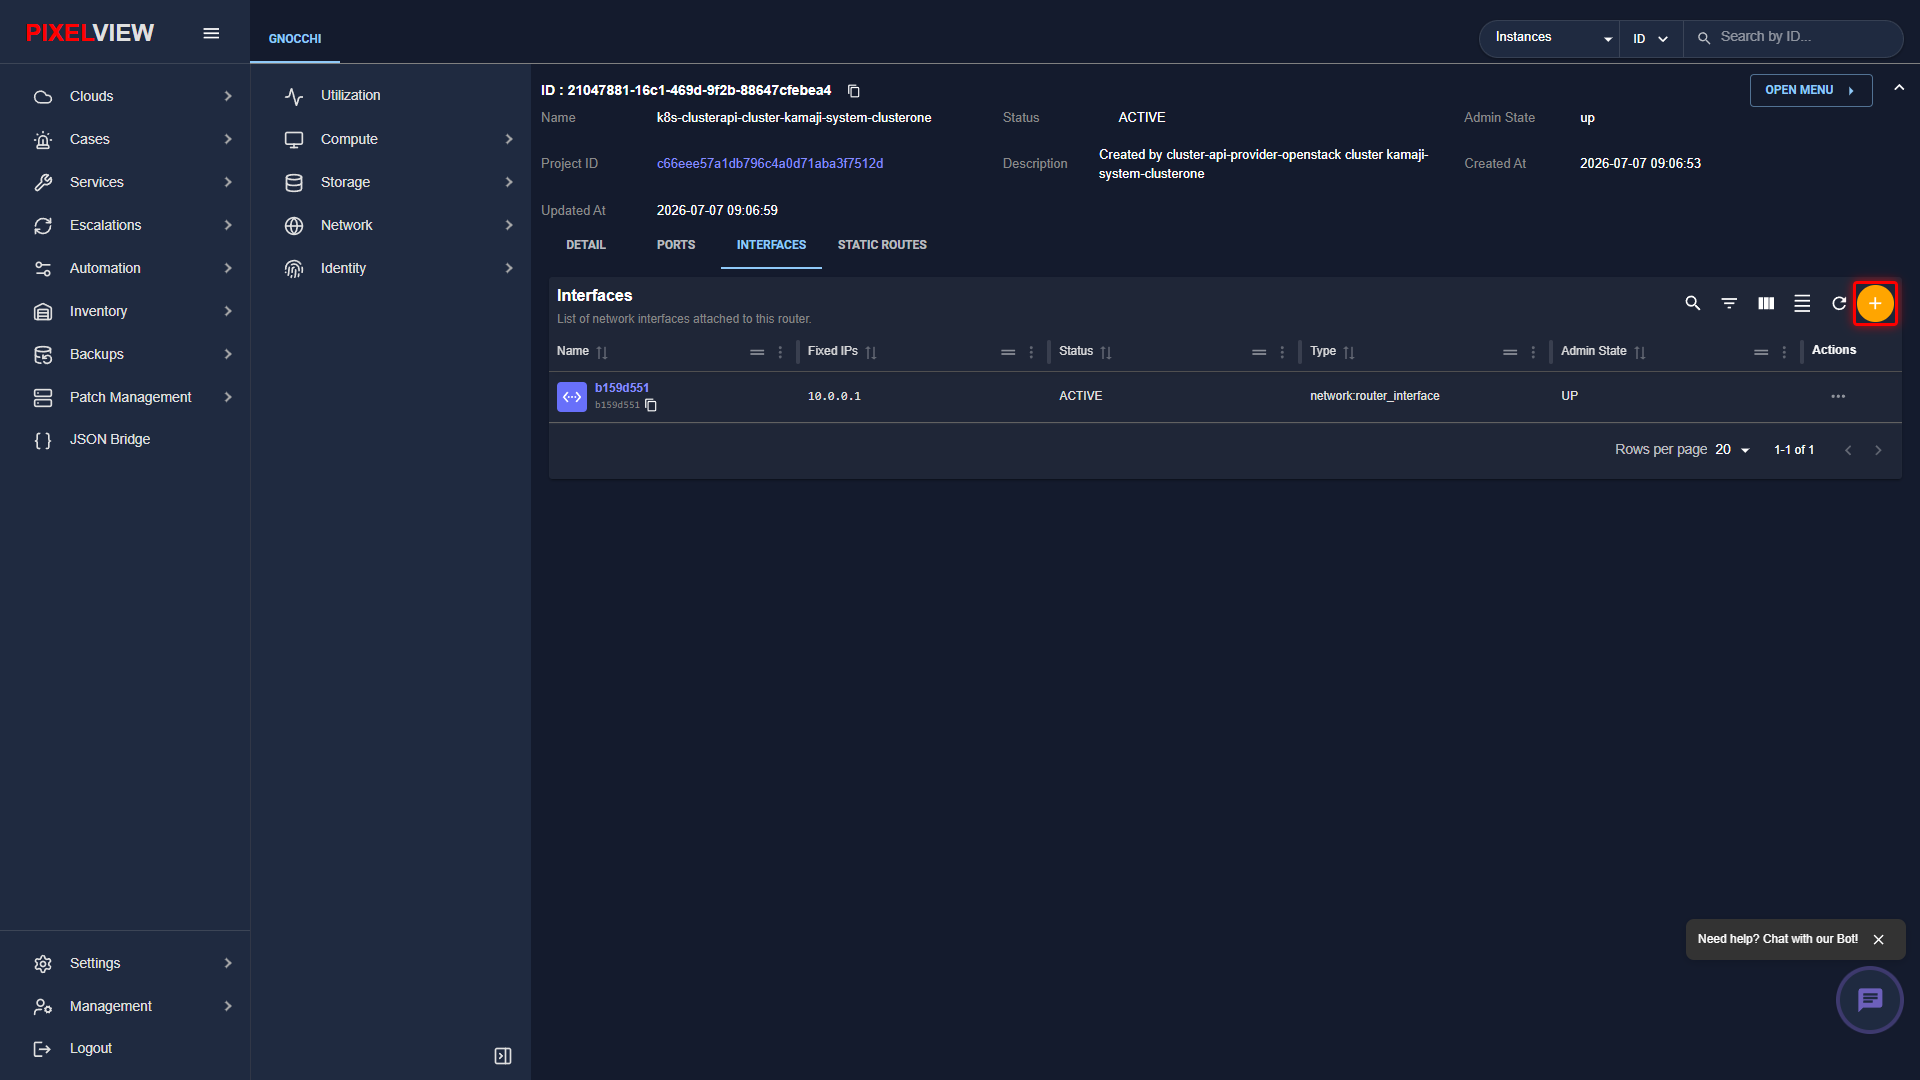
To connect an internal tenant network subnet to the virtual router:
* On the router details page, navigate to the INTERFACES tab.
* Click the orange + (Add Interface) button on the interfaces table toolbar:
- The Create Interface modal dialog opens:
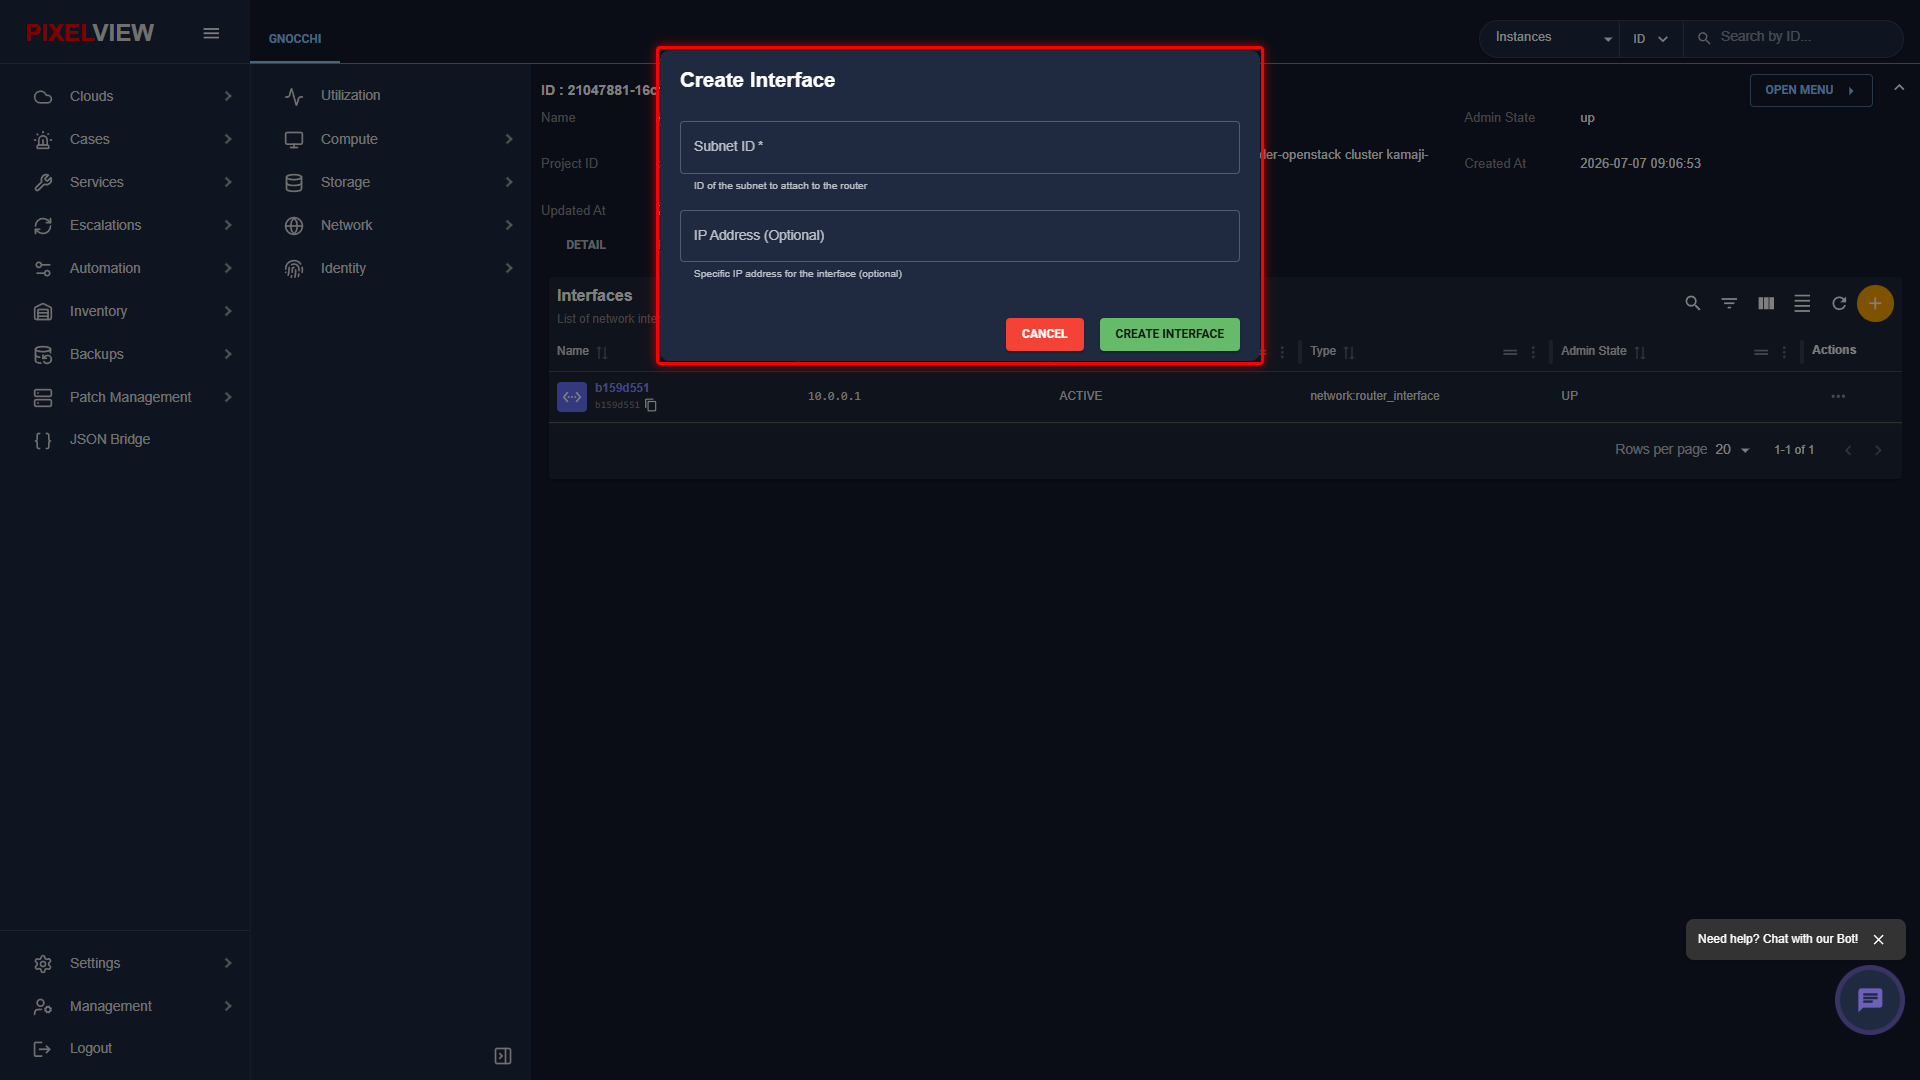
| Parameter | Type | Description |
|---|---|---|
| Subnet ID | Required Dropdown / Text | The internal tenant network subnet to connect to this router gateway. |
| IP Address (Optional) | Optional Text | Explicit IP address assignment for the router interface on the subnet (defaults to subnet gateway). |
Router Operations Menu
In the top-right corner of the Router Details page, the OPEN MENU button exposes operational router tasks:
Routers Contextual Row Actions
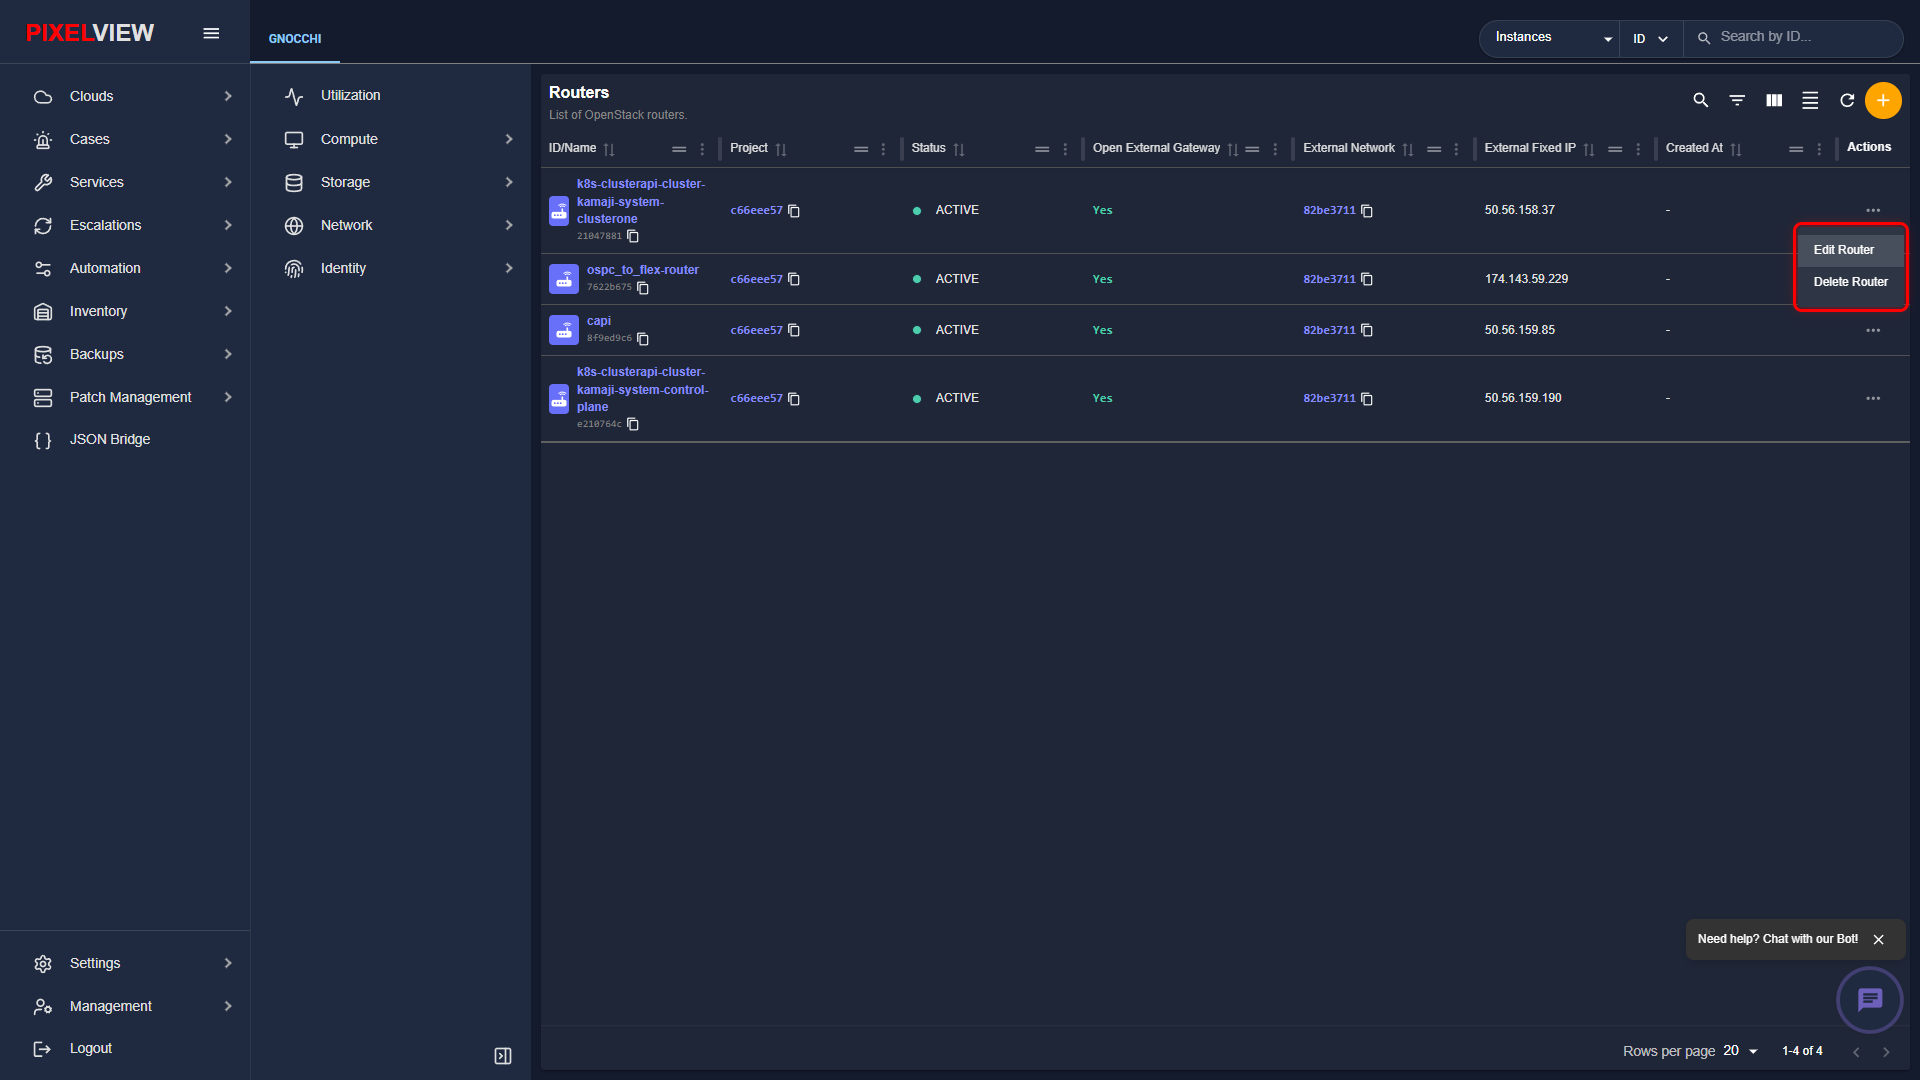
In the Routers table, clicking the three-dot (...) button on any router row opens the contextual row actions menu:
Editing a Router
Selecting Edit Router from the row actions menu or the router details menu opens the router configuration modal:
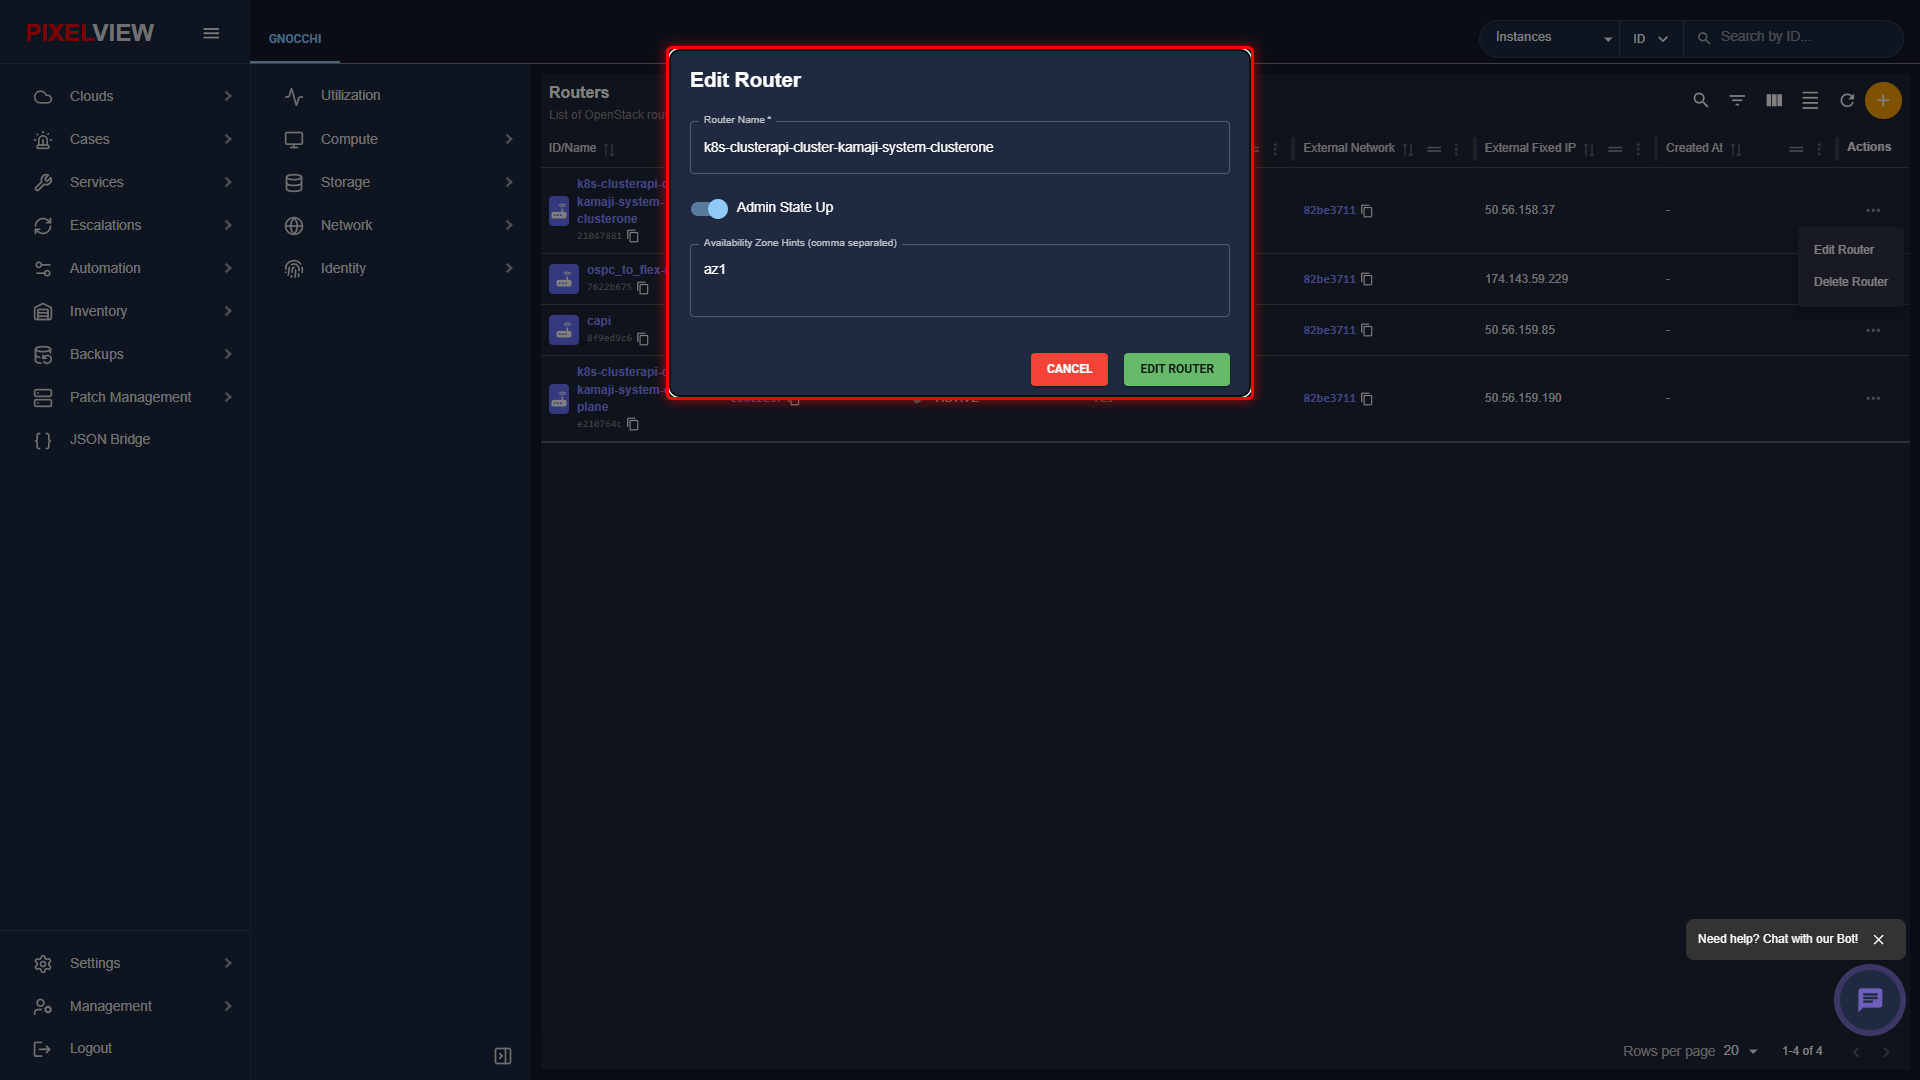
| Parameter | Type | Description |
|---|---|---|
| Router Name | Required Text | Updated administrative identifier for the virtual router. |
| Admin State Up | Toggle Switch | Administrative status controlling whether the virtual router processes transit packets (Up / Down). |
| Availability Zone Hints | Optional Text | Comma-separated availability zones for localized high-availability router placement (e.g., az1). |
Security Groups (Distributed Firewalls)
Security groups act as virtual distributed firewalls applied at the port level to govern ingress and egress traffic for compute instances.
Security Groups Table Overview
Navigate to Network → Security Groups in the secondary sidebar:
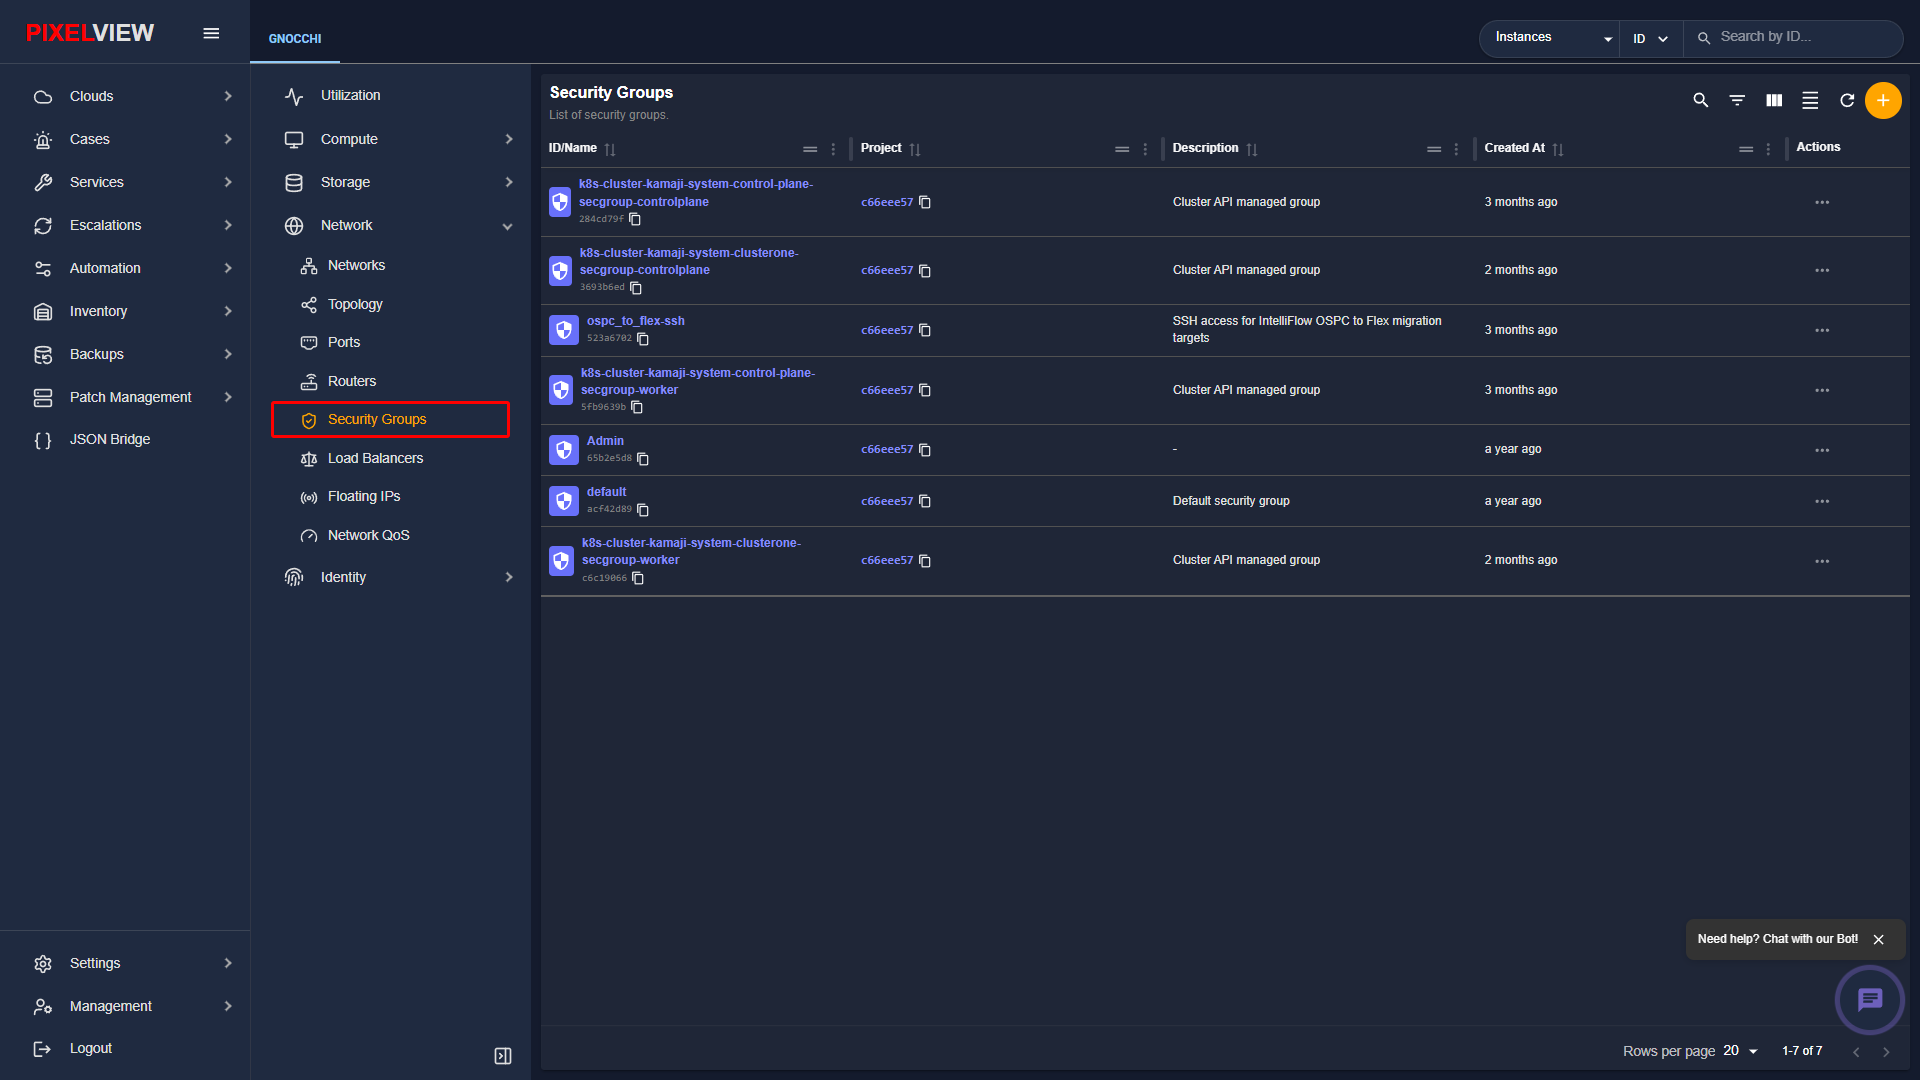
| Column | Description |
|---|---|
| ID / Name | Security group display name (e.g., default, k8s-cluster-sg) and UUID. |
| Description | Operational notes describing the rule baseline and permitted traffic. |
| Rules Count | Total number of active ingress and egress filtering rules configured. |
| Actions | Context shortcuts to Manage Rules, Edit, or Delete. |
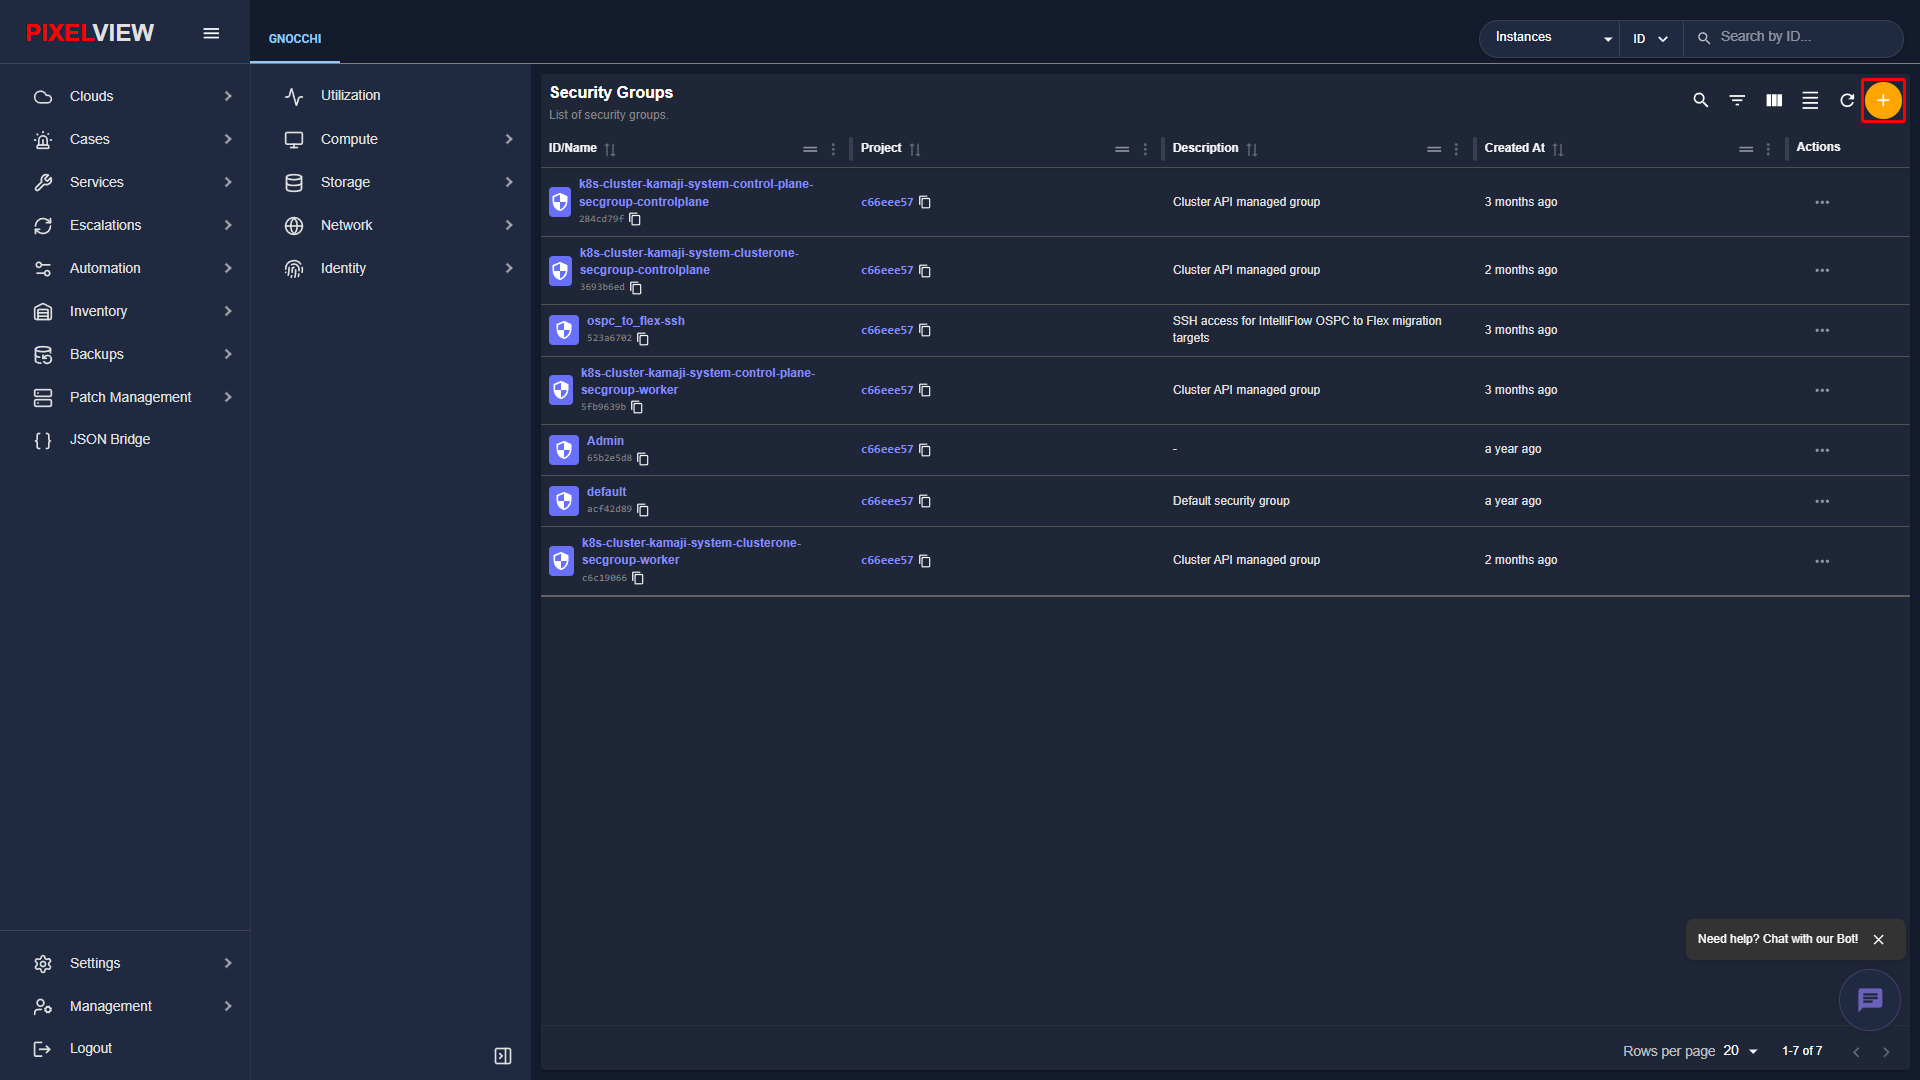
Creating a Security Group
- Click the orange
+button in the top-right toolbar:
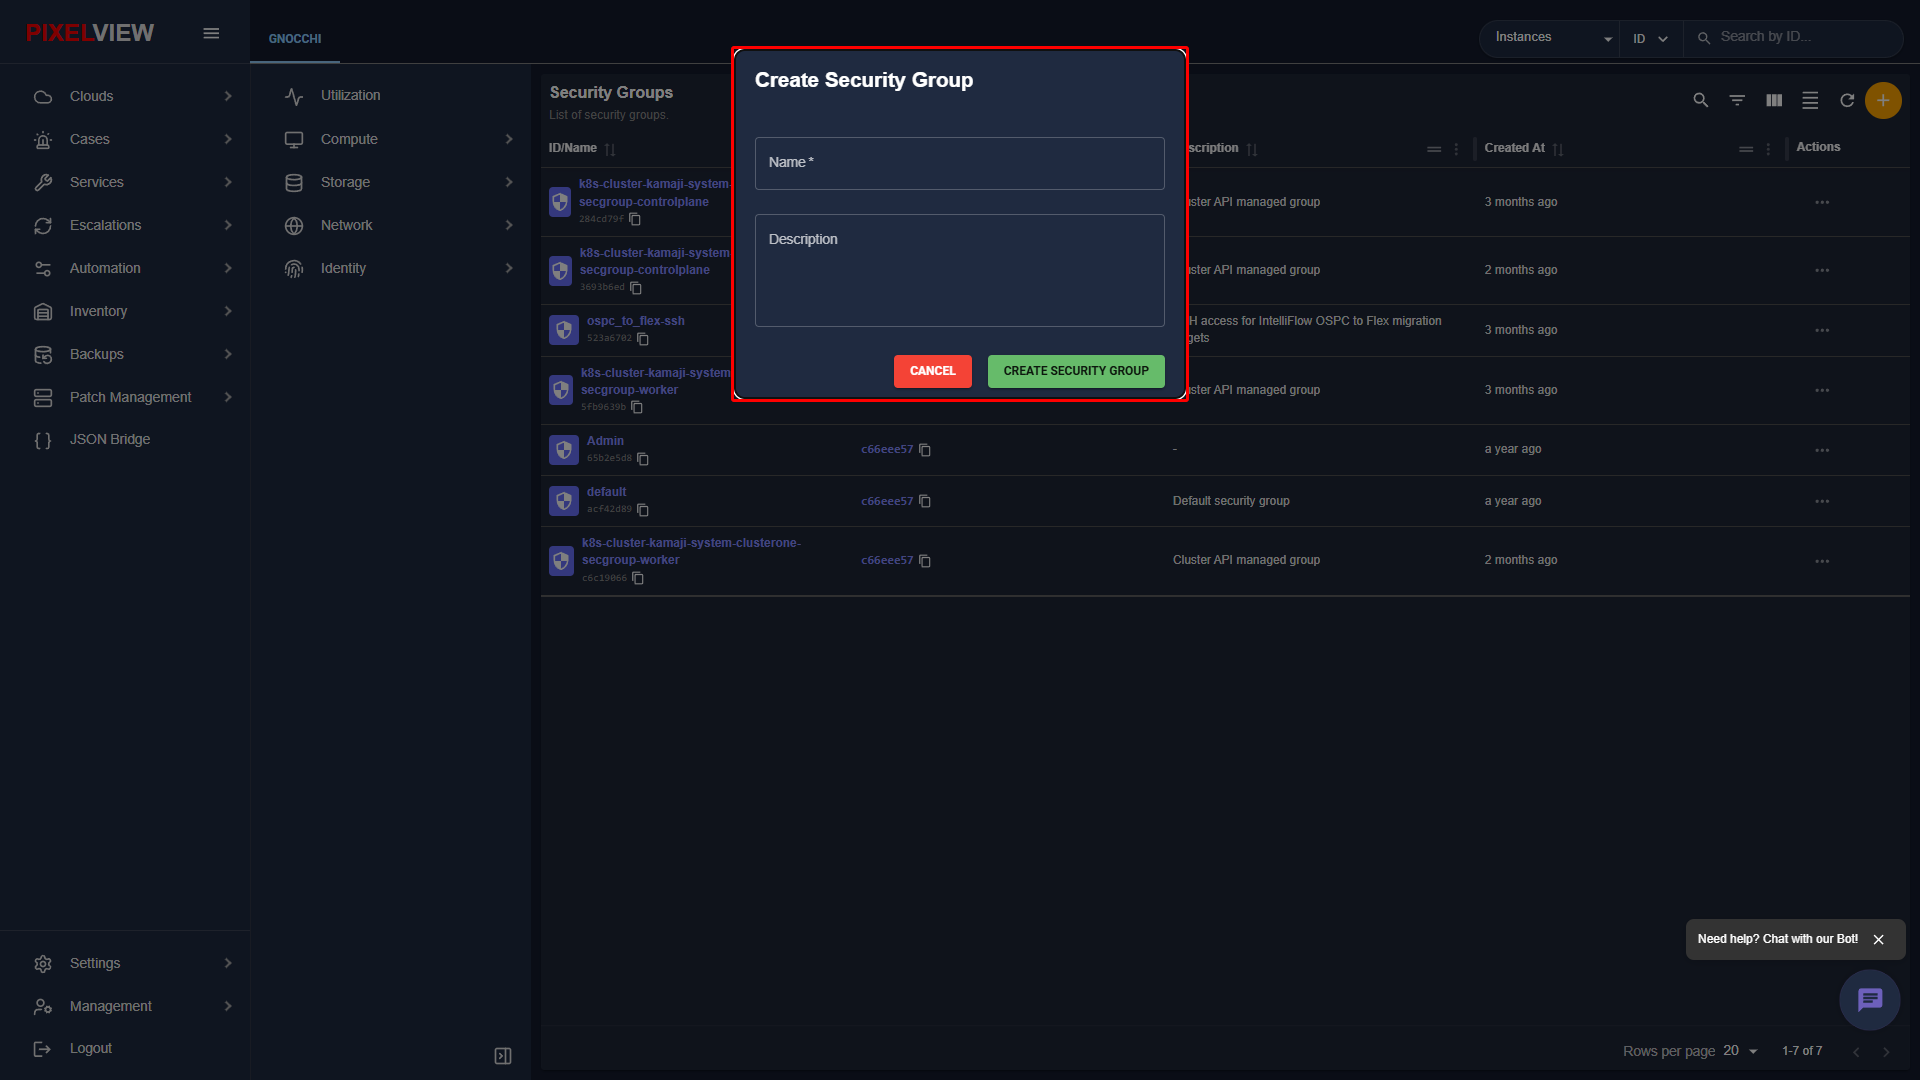
- The Create Security Group modal dialog opens:
Security Group Details & Rules Management
Clicking on any security group name navigates to the Security Group Details page (/openstack/:regionName/security-groups/:uuid), displaying the full active firewall rules table:
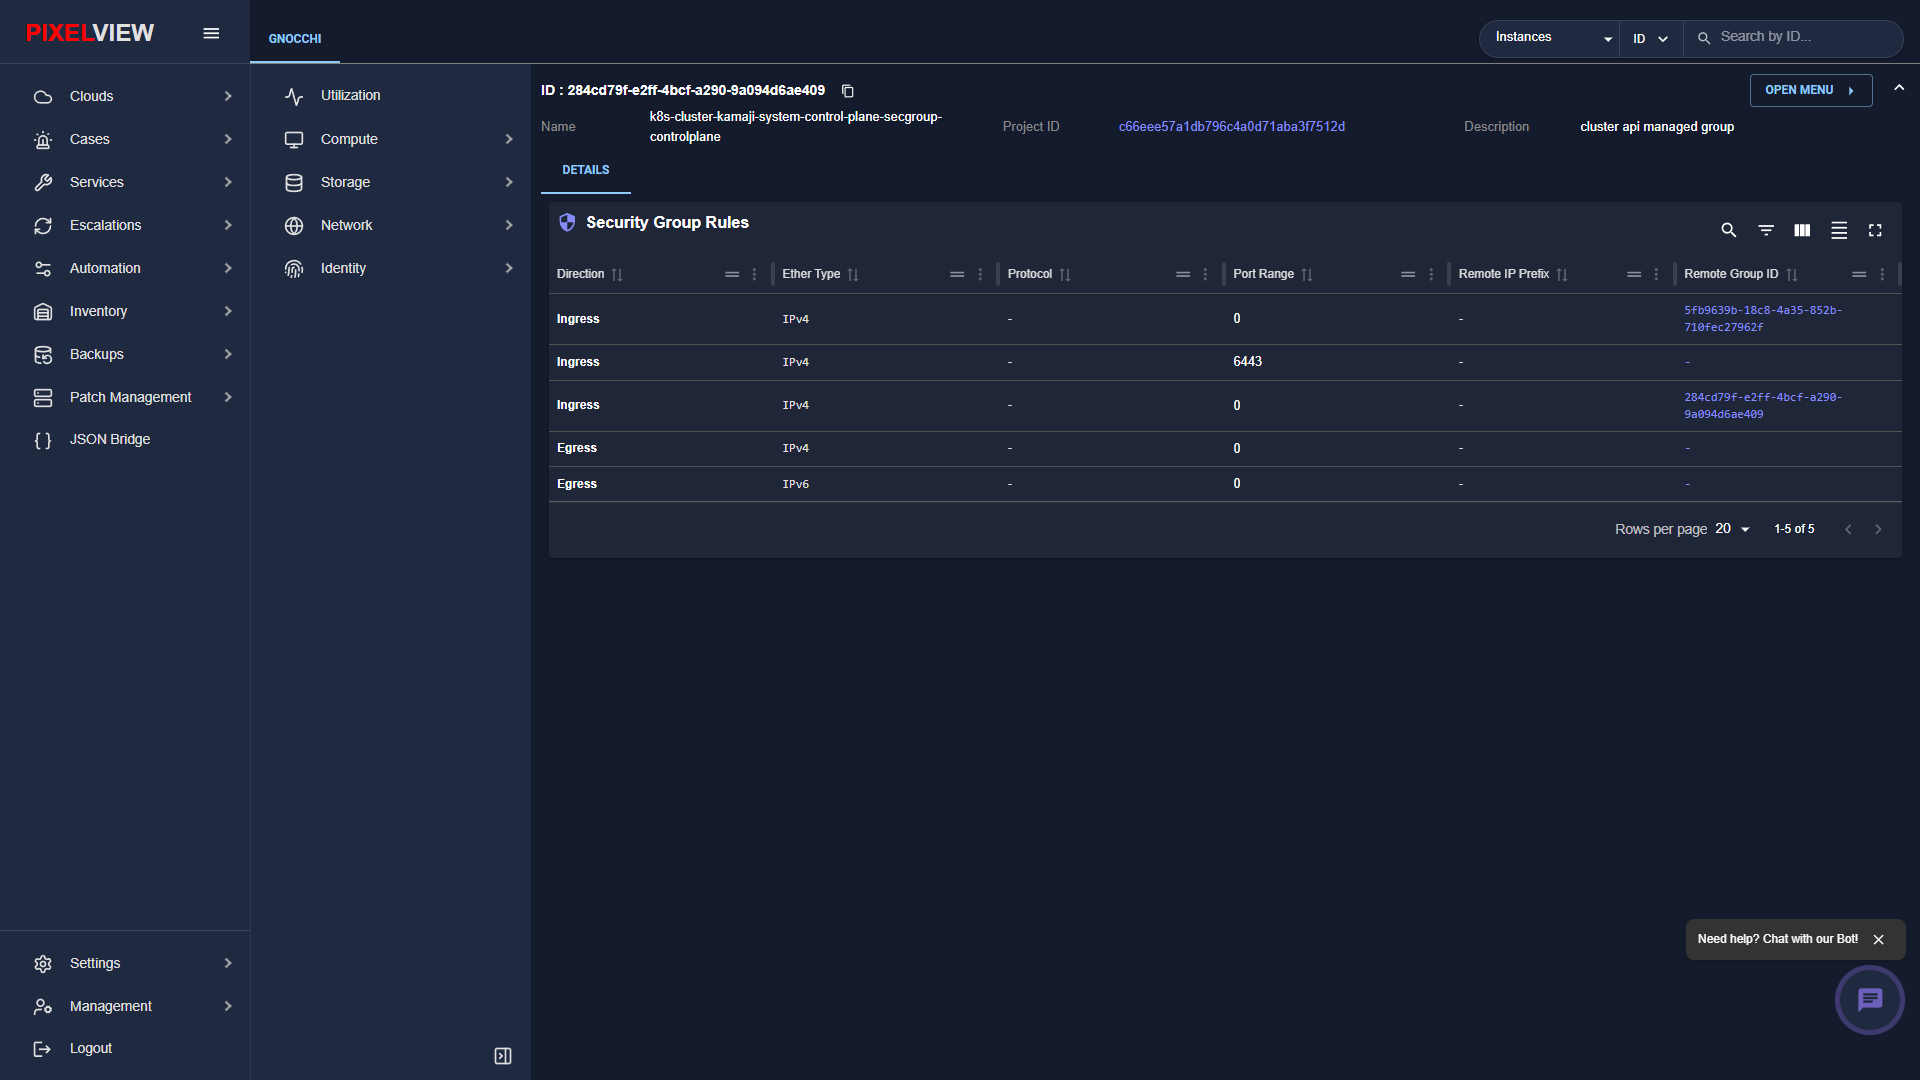
| Rule Field | Options | Description |
|---|---|---|
| Direction | Ingress, Egress |
Specifies inbound or outbound packet filtering. |
| Ether Type | IPv4, IPv6 |
Network protocol family. |
| Protocol | TCP, UDP, ICMP, Any |
Transport layer protocol filter. |
| Port Range | Single Port or Range | Target destination port(s) (e.g., 22 for SSH, 80/443 for Web, 6443 for Kubernetes API). |
| Remote IP Prefix | CIDR Range | Restrict traffic to specific source/destination CIDR blocks (e.g., 0.0.0.0/0, 10.0.0.0/16). |
| Remote Group ID | Security Group UUID | Permit traffic originating from or destined to member instances of another security group. |
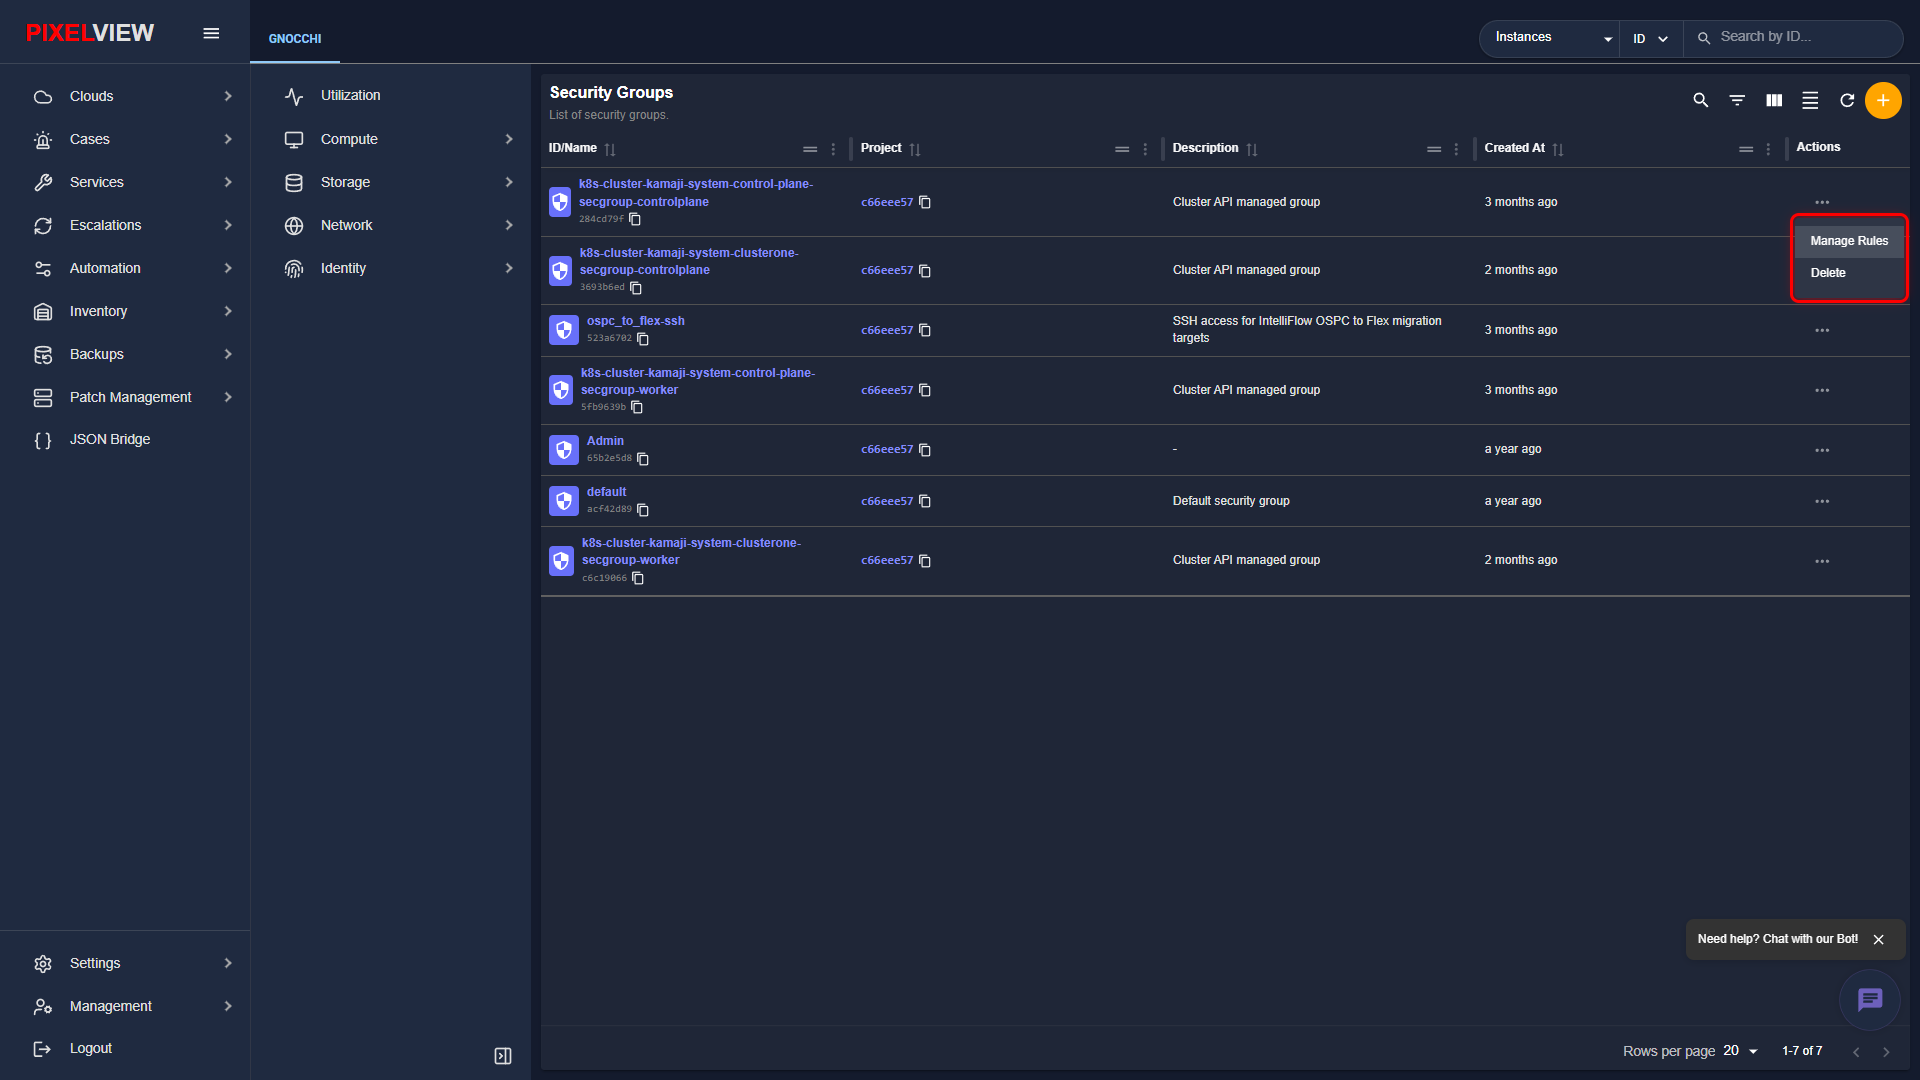
Security Groups Contextual Row Actions
From the main table, clicking the three-dot (...) button on any security group row opens the contextual row actions menu:
Load Balancers (Octavia)
PixelView provides full enterprise lifecycle management for Octavia load balancers, distributing application traffic across redundant backend compute instances.
Load Balancers Table Overview
Navigate to Network → Load Balancers in the secondary sidebar:
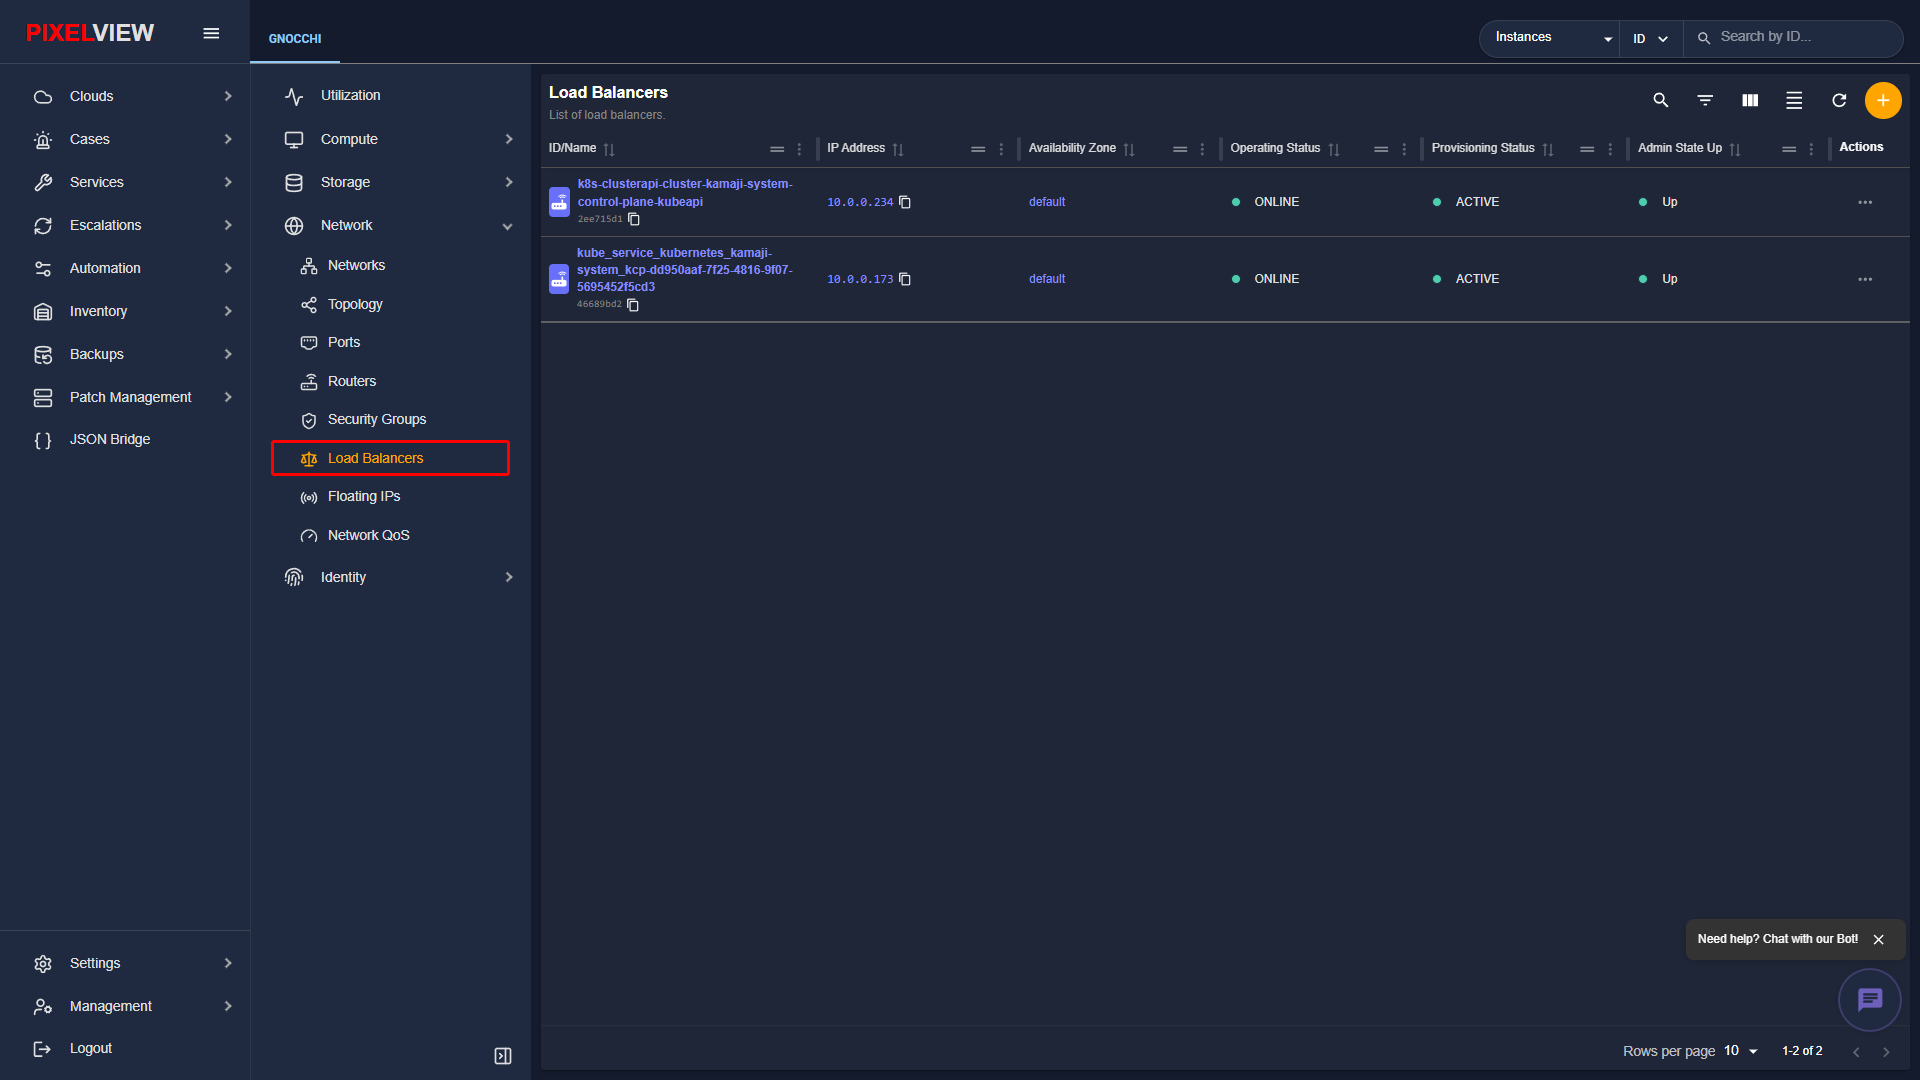
| Column | Description |
|---|---|
| ID / Name | Load balancer name and system UUID. |
| Operating Status | Real-time health status: ONLINE, OFFLINE, or DEGRADED. |
| Provisioning Status | Octavia orchestration state: ACTIVE, PENDING_CREATE, or PENDING_UPDATE. |
| VIP Address | Virtual IP endpoint exposed to clients. |
| Provider | Underlying driver (amphora or ovn). |
| Actions | Shortcuts to Manage Listeners, Configure Pools & Members, Attach Health Monitors, or Delete. |
Creating a Load Balancer
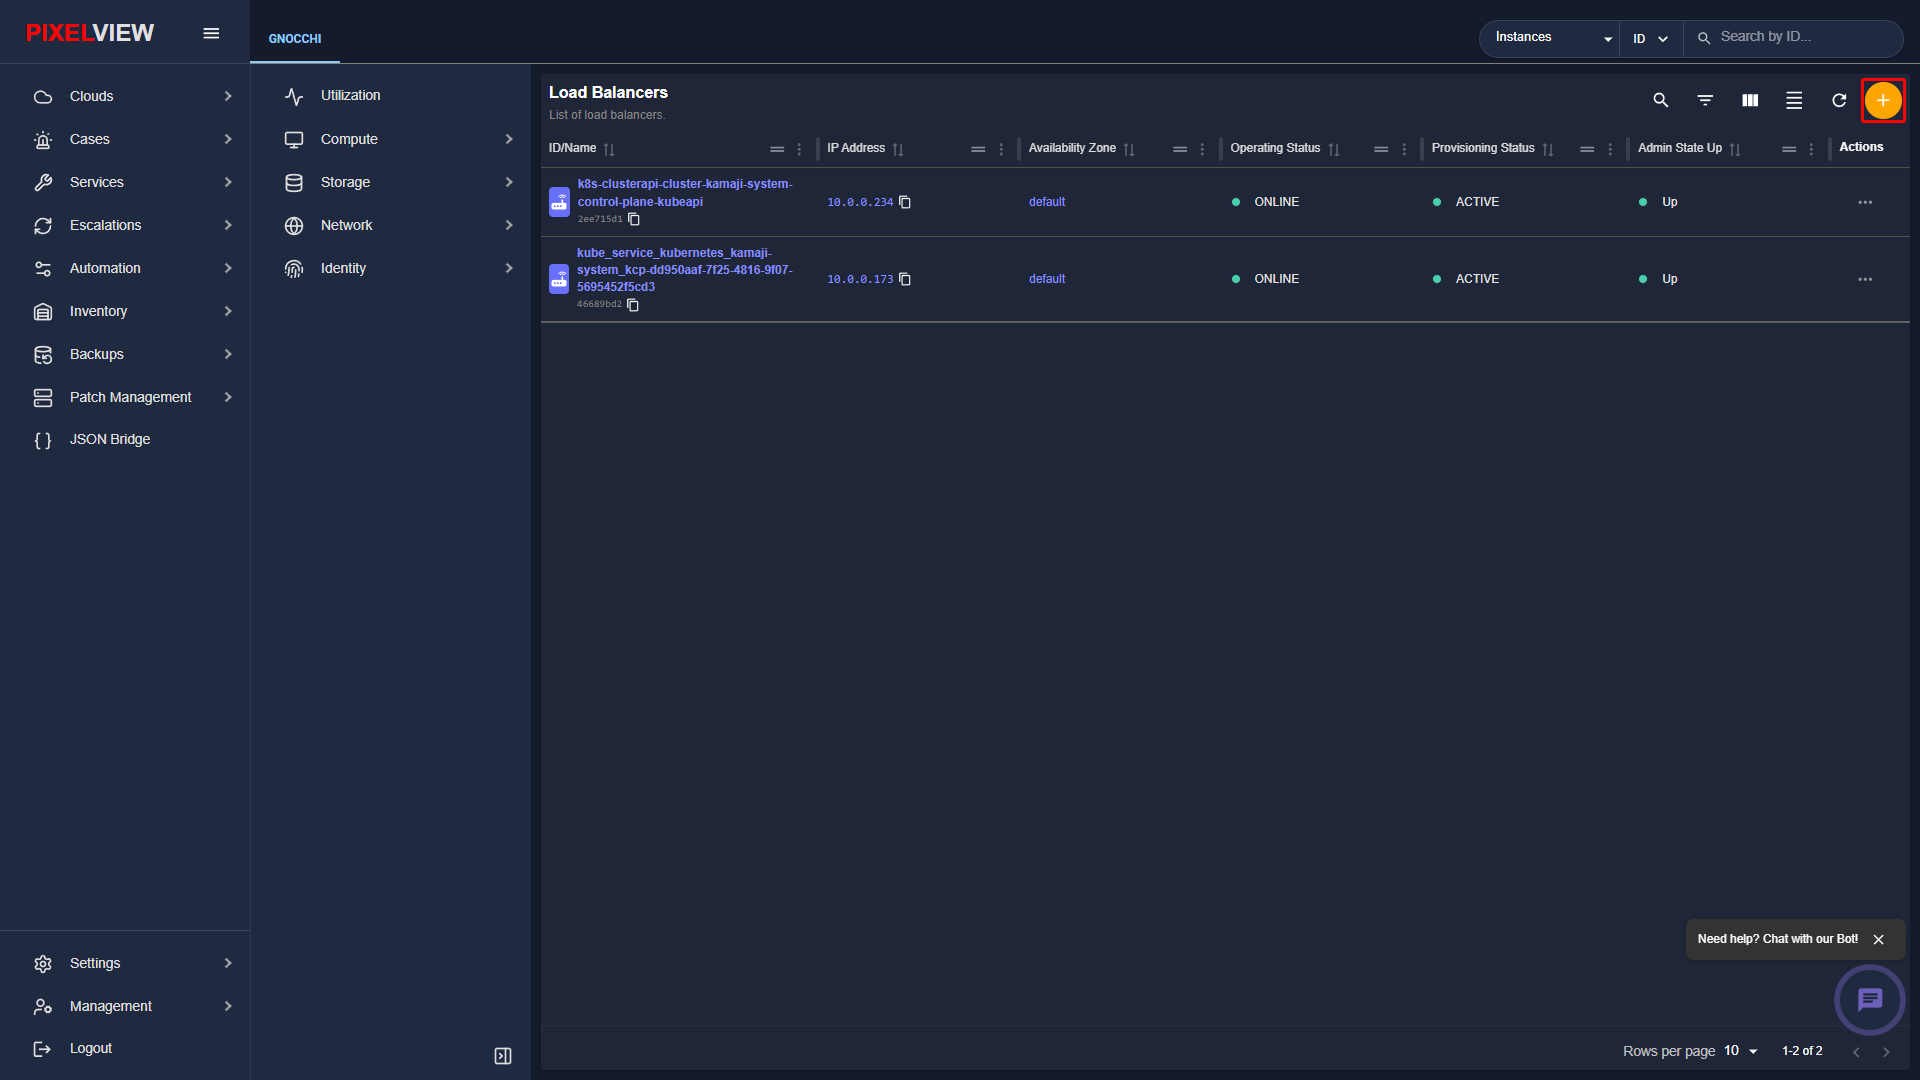
- Click the orange
+button in the top-right toolbar:
- The Create Load Balancer modal dialog opens:
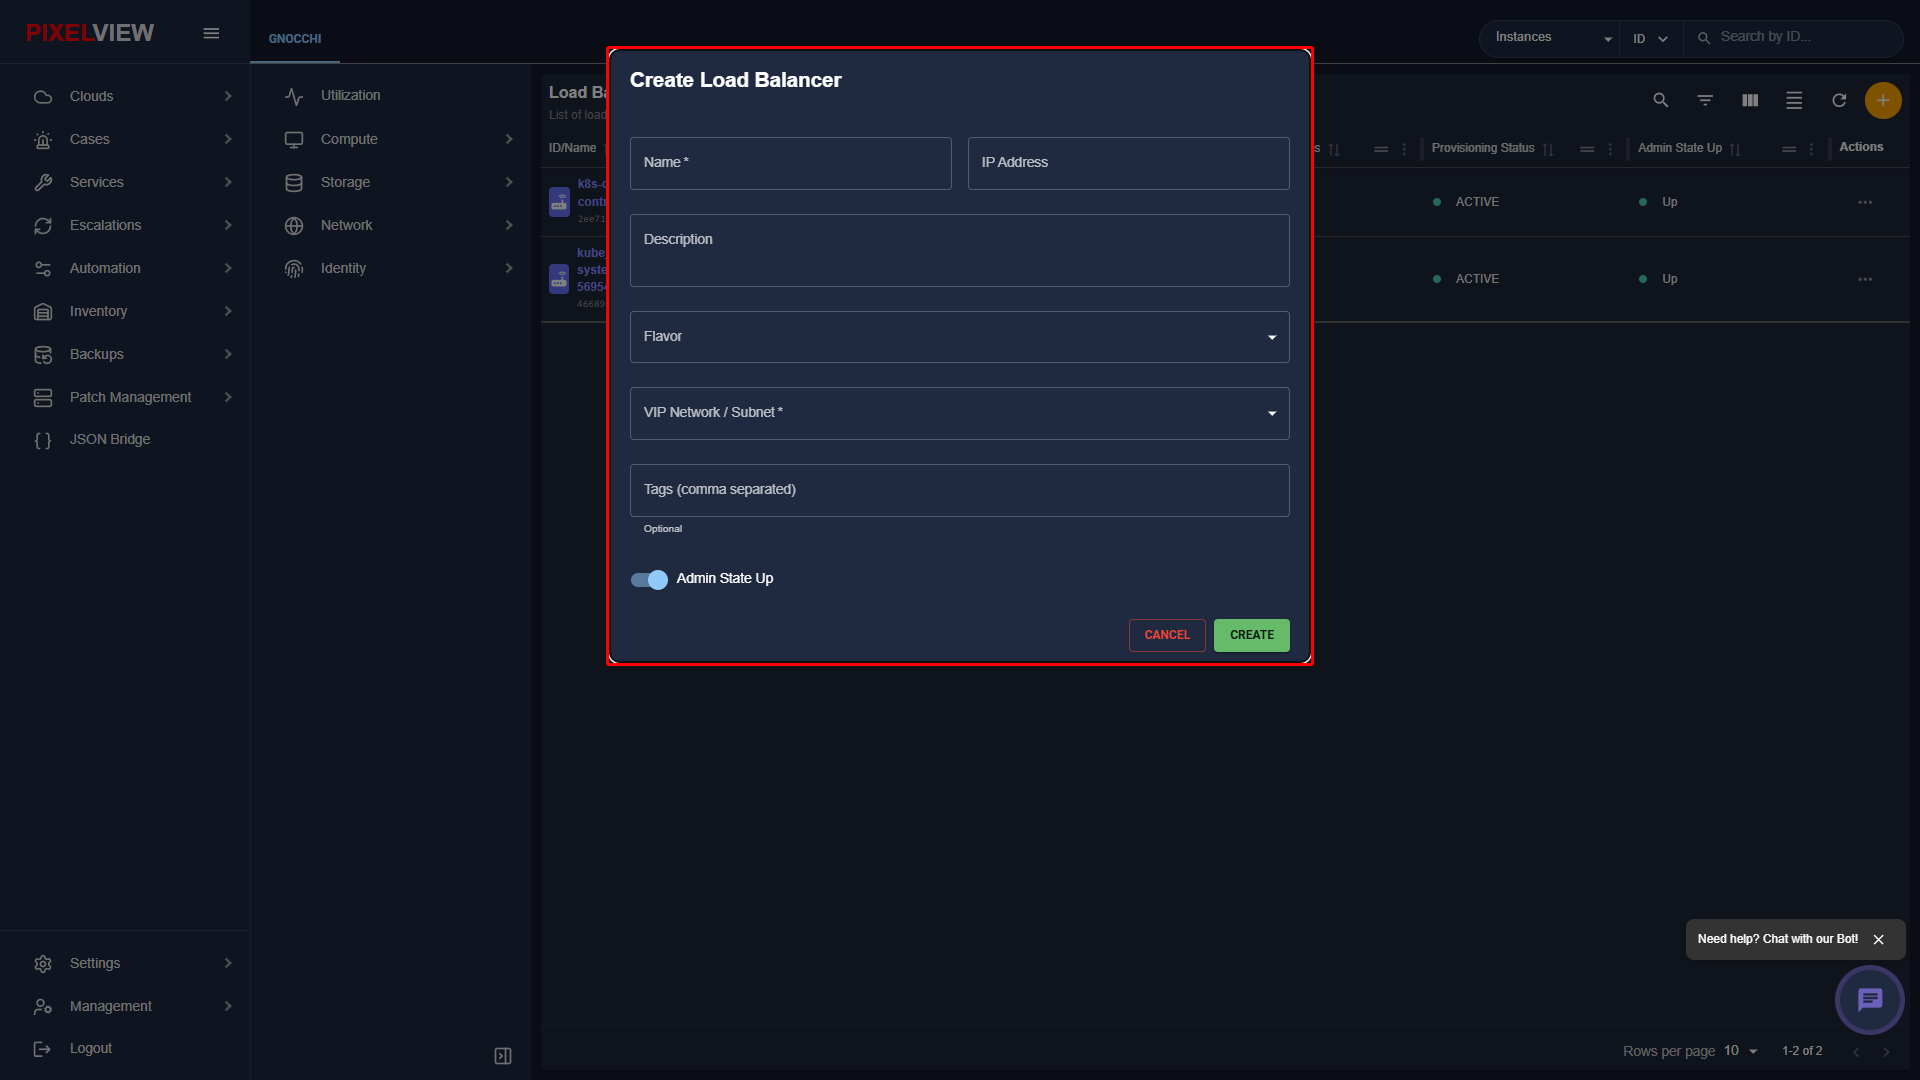
| Configuration Section | Parameters | Description |
|---|---|---|
| Load Balancer Details | Name, Description, Admin State | Display naming and operational state. |
| Virtual IP (VIP) | VIP Subnet, IP Address | Choose the tenant subnet to allocate the VIP address from. Optionally specify a fixed IP. |
| Listener Configuration | Protocol, Port, Connection Limit | Define frontend listening parameters (HTTP/80, HTTPS/443, TCP/6443). |
| Backend Pool | Algorithm, Members | Select load distribution algorithm (ROUND_ROBIN, LEAST_CONNECTIONS, SOURCE_IP) and add member instance IPs with weights. |
| Health Monitor | Type, Interval, Timeout, Max Retries | Configure automated health checks (HTTP, TCP, PING) to remove unhealthy instances automatically. |
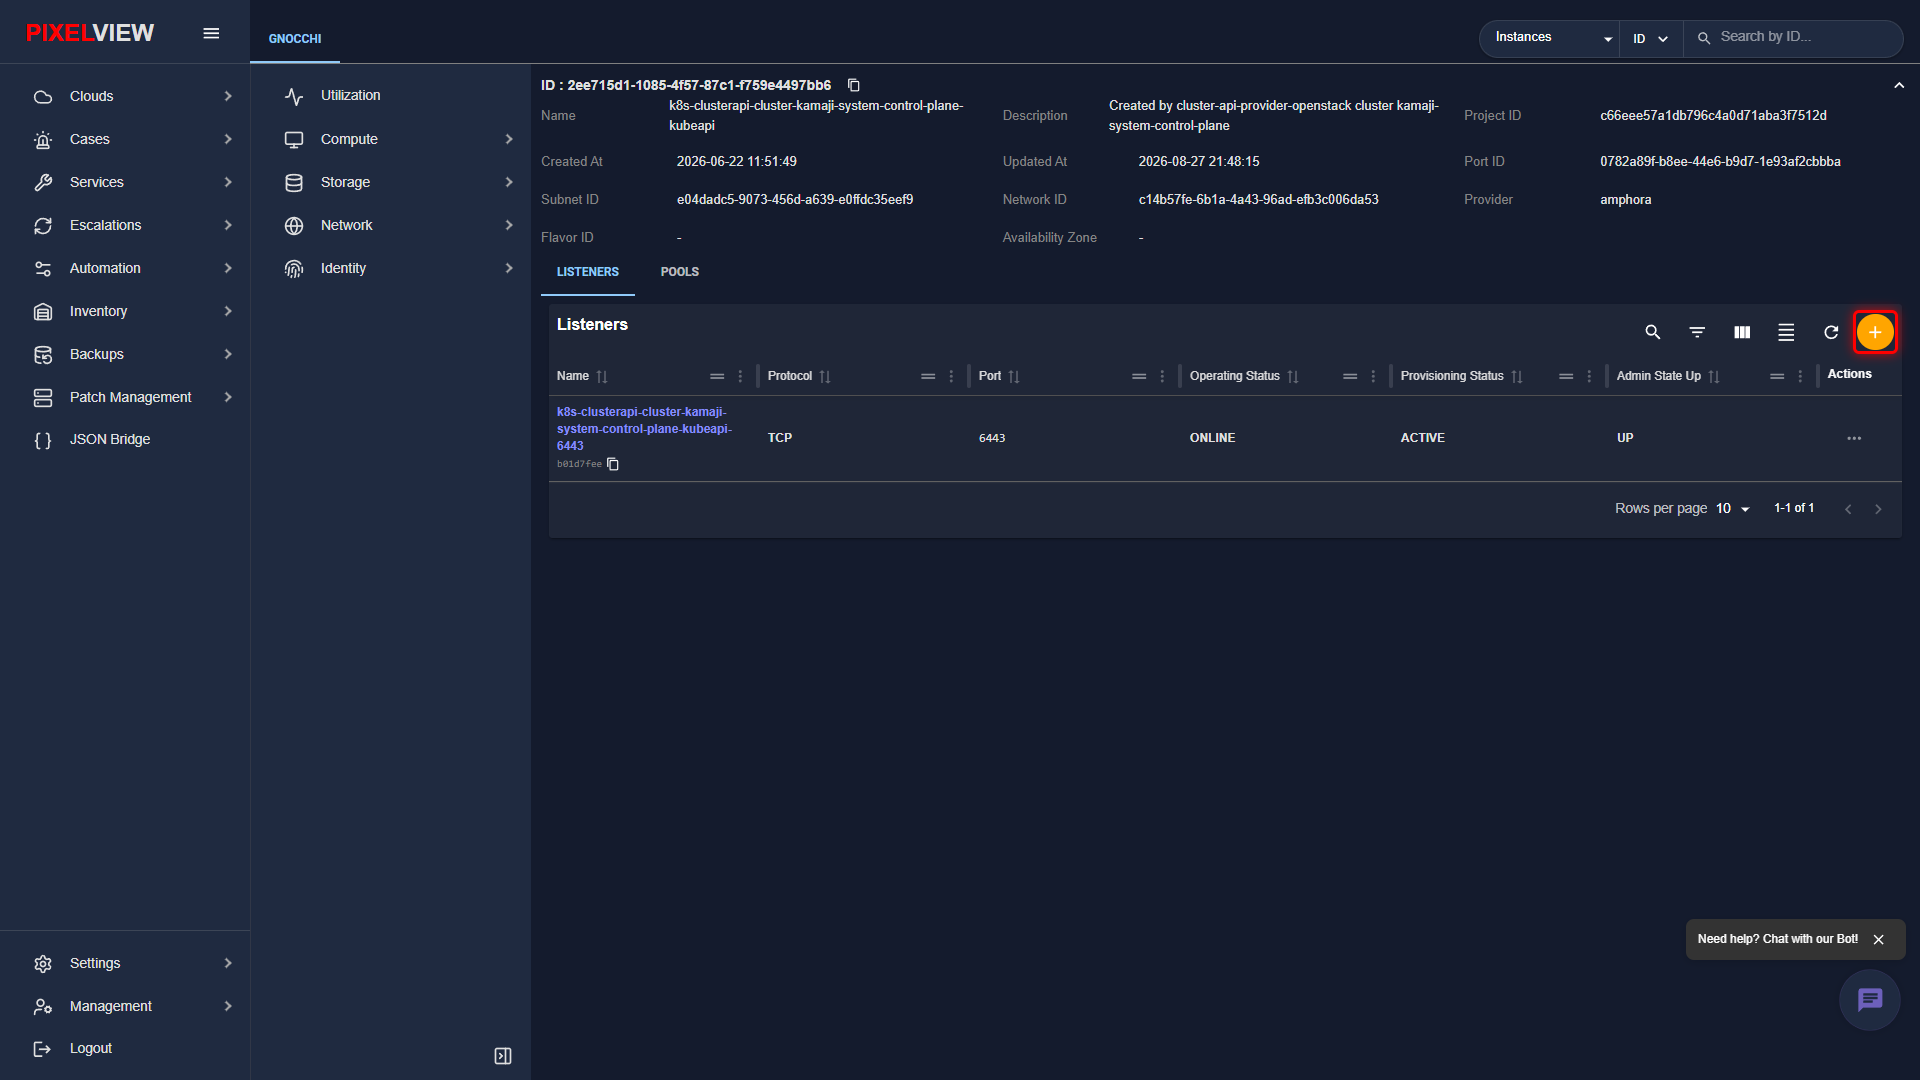
Load Balancer Details & Listeners
Clicking on any load balancer name navigates to the Load Balancer Details page (/openstack/:regionName/load-balancers/:uuid):
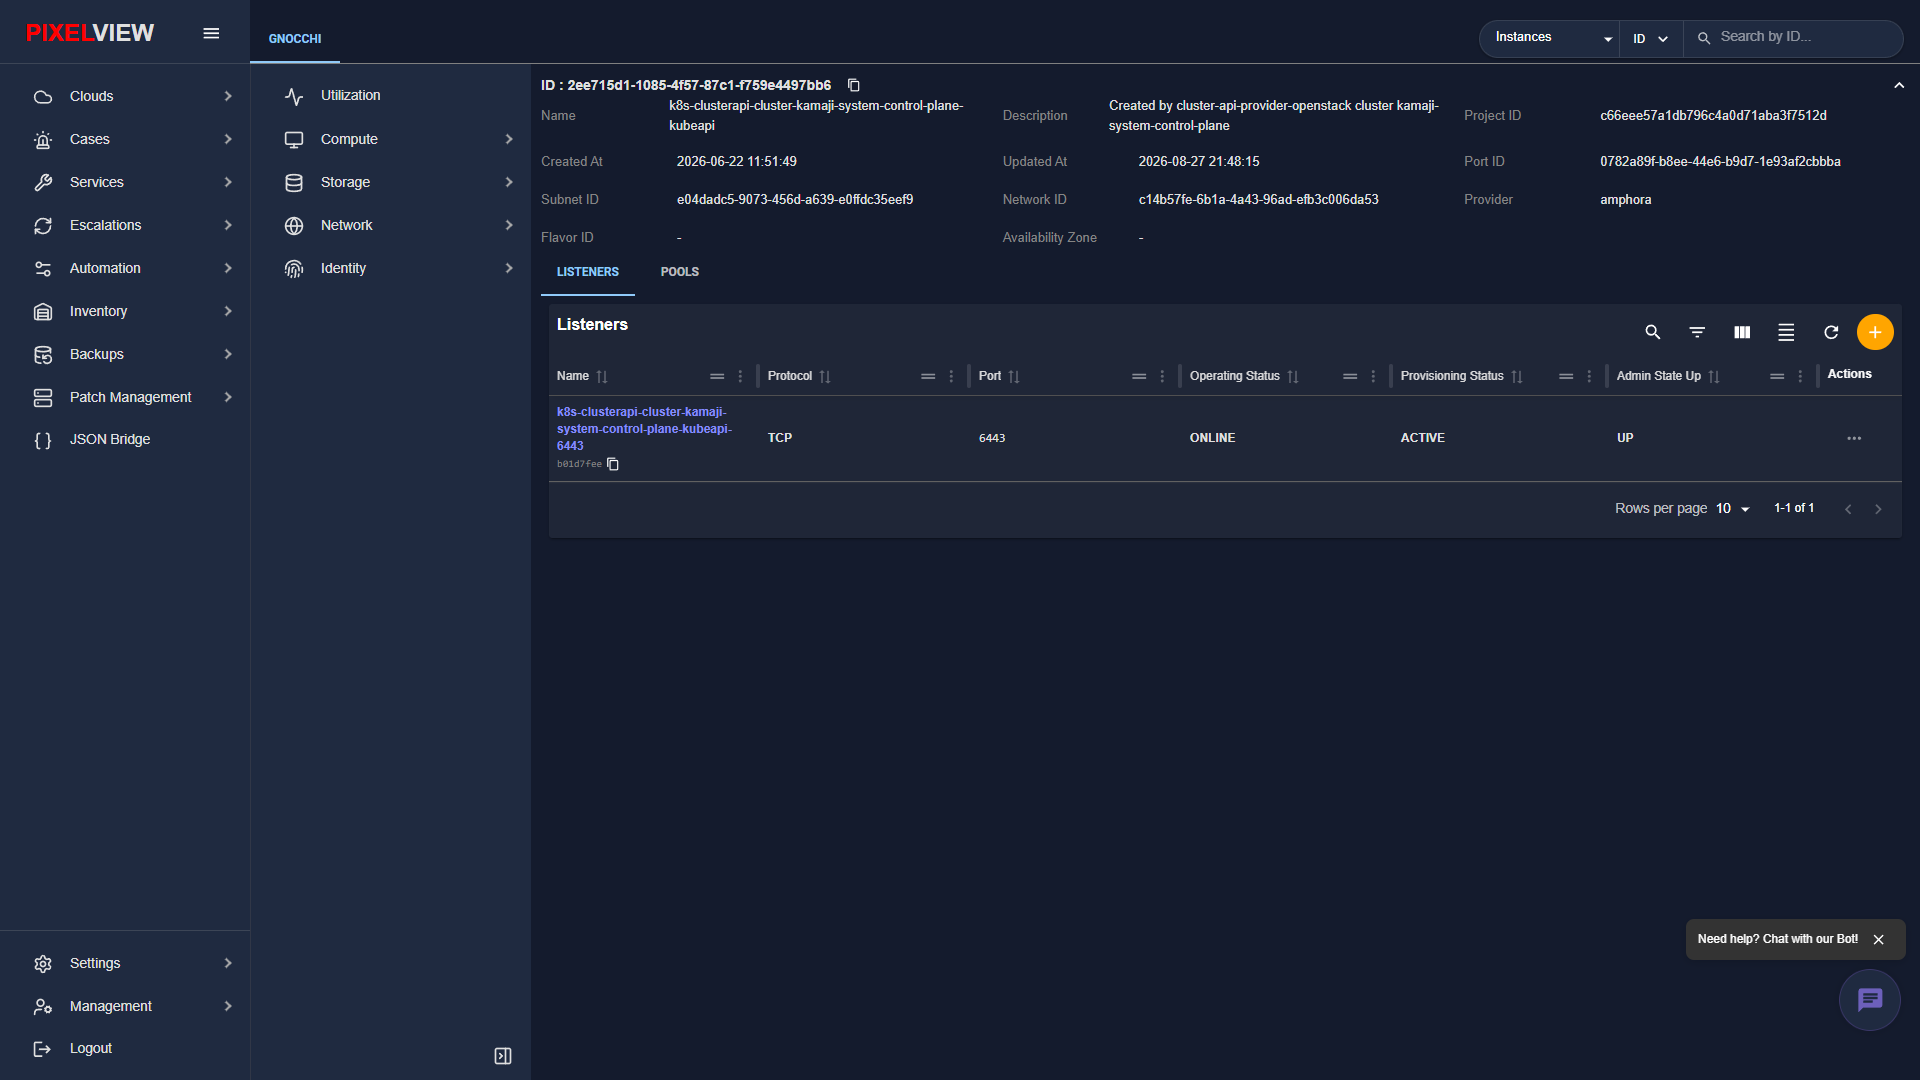
The Listeners tab provides comprehensive operational monitoring:
* Name & Protocol: Listener identifier and protocol (TCP, HTTP, HTTPS).
* Port: Target listening port (e.g., 6443 for Kubernetes API, 80, 443).
* Operating Status: Live health status badge (ONLINE, OFFLINE).
* Provisioning Status: Orchestration state (ACTIVE).
* Admin State Up: Administrative operational state (UP).
Adding a Listener
- Click the orange
+button in the Listeners tab toolbar:
- The Create Listener modal opens:
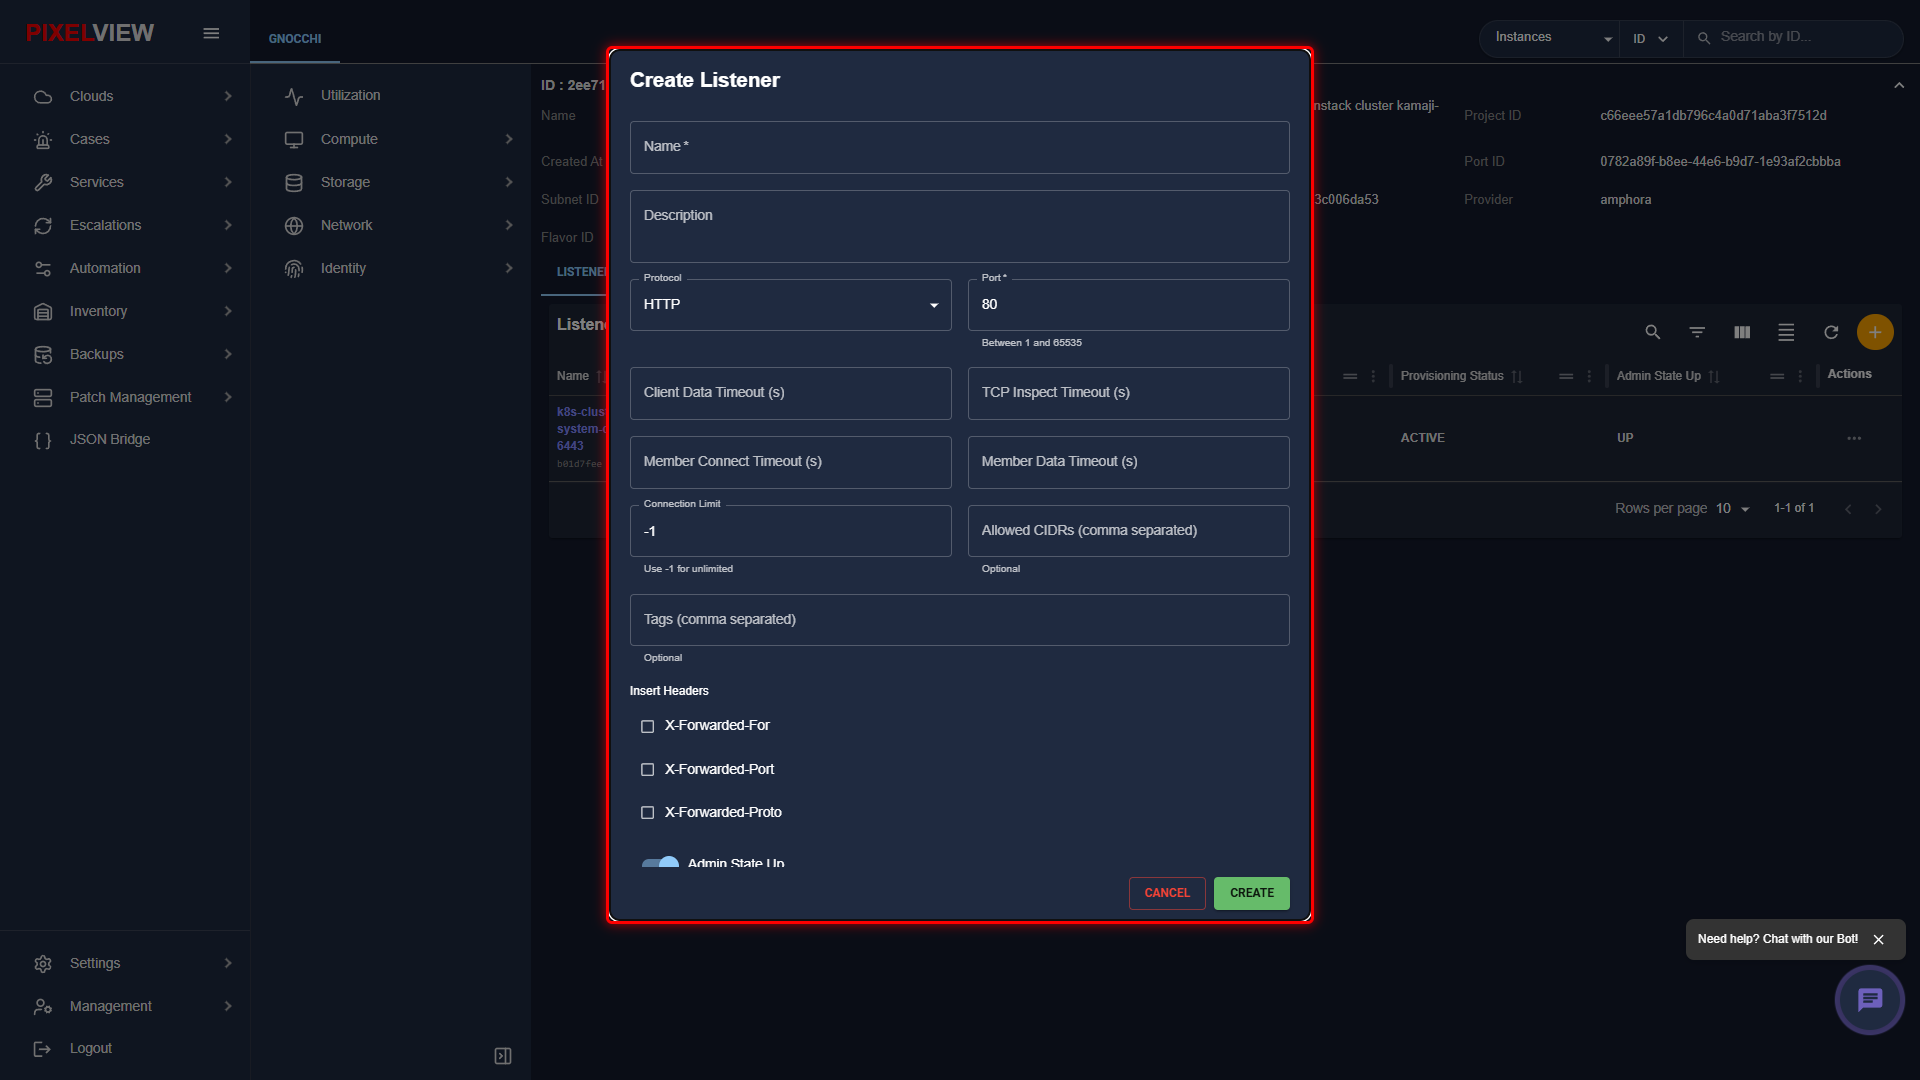
| Parameter | Type | Description |
|---|---|---|
| Name | Required Text | Descriptive identifier for the listener. |
| Description | Optional Text | Contextual notes detailing listening traffic purpose or upstream routing targets. |
| Protocol | Required Dropdown | Traffic protocol to terminate: HTTP, HTTPS, TCP, or UDP. |
| Port | Required Number | Port number between 1 and 65535 to receive traffic (e.g., 80, 443, 6443). |
| Client Data Timeout (s) | Optional Number | Maximum time in seconds frontend connections remain idle waiting for client data. |
| TCP Inspect Timeout (s) | Optional Number | Time in seconds allowed for inspecting TCP payload content. |
| Member Connect Timeout (s) | Optional Number | Maximum timeout in seconds to establish connections to backend member instances. |
| Member Data Timeout (s) | Optional Number | Inactivity timeout in seconds waiting for backend responses. |
| Connection Limit | Number | Maximum concurrent connections allowed (-1 for unlimited). |
| Allowed CIDRs | Optional Text | Comma-separated list of IP prefixes authorized to reach this listener frontend. |
| Tags | Optional Text | Comma-separated organizational labels. |
| Insert Headers | Checkboxes | Optional HTTP request header injection: X-Forwarded-For, X-Forwarded-Port, X-Forwarded-Proto. |
| Admin State Up | Toggle Switch | Administrative status enabling or disabling traffic processing. |
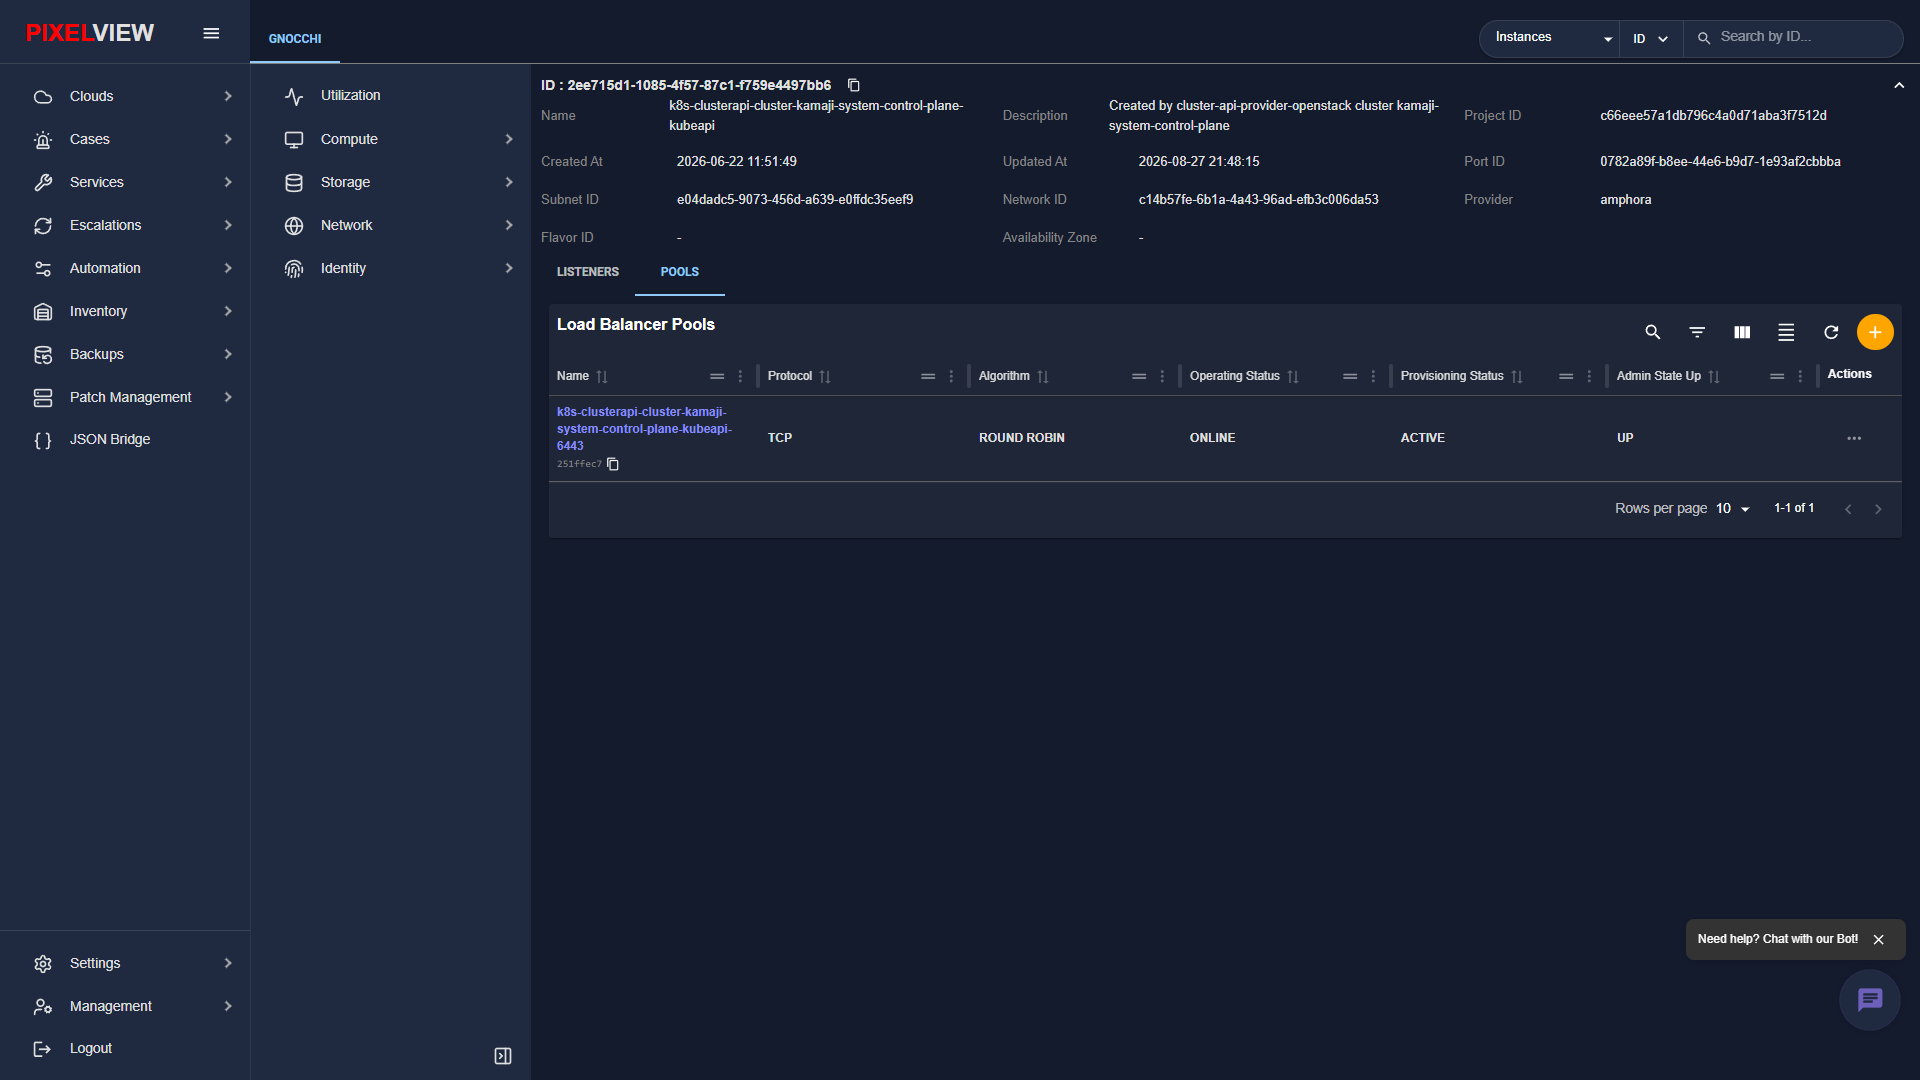
Load Balancer Pools Tab
Clicking the POOLS tab reveals backend server pools, balancing algorithms, and member health states:
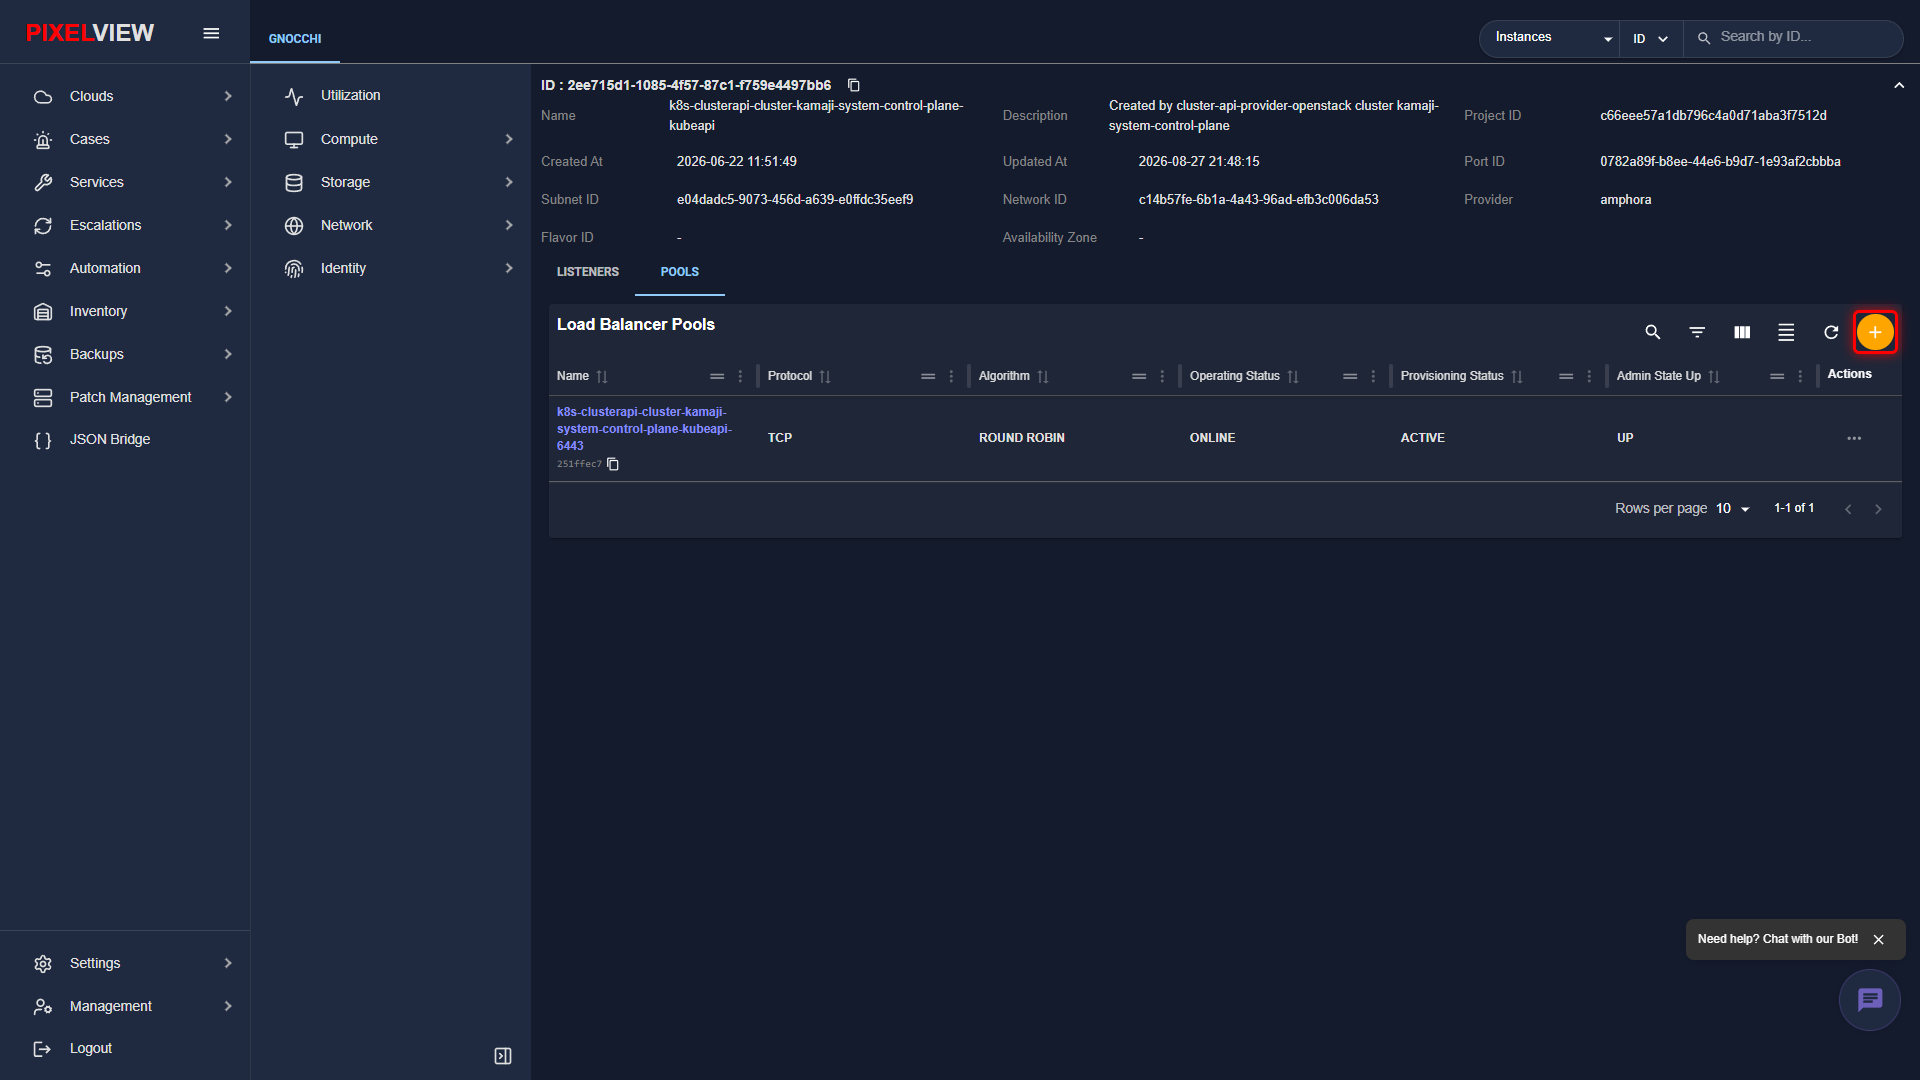
Adding a Backend Pool
- Click the orange
+button in the Pools tab toolbar:
- The Create Pool modal opens:
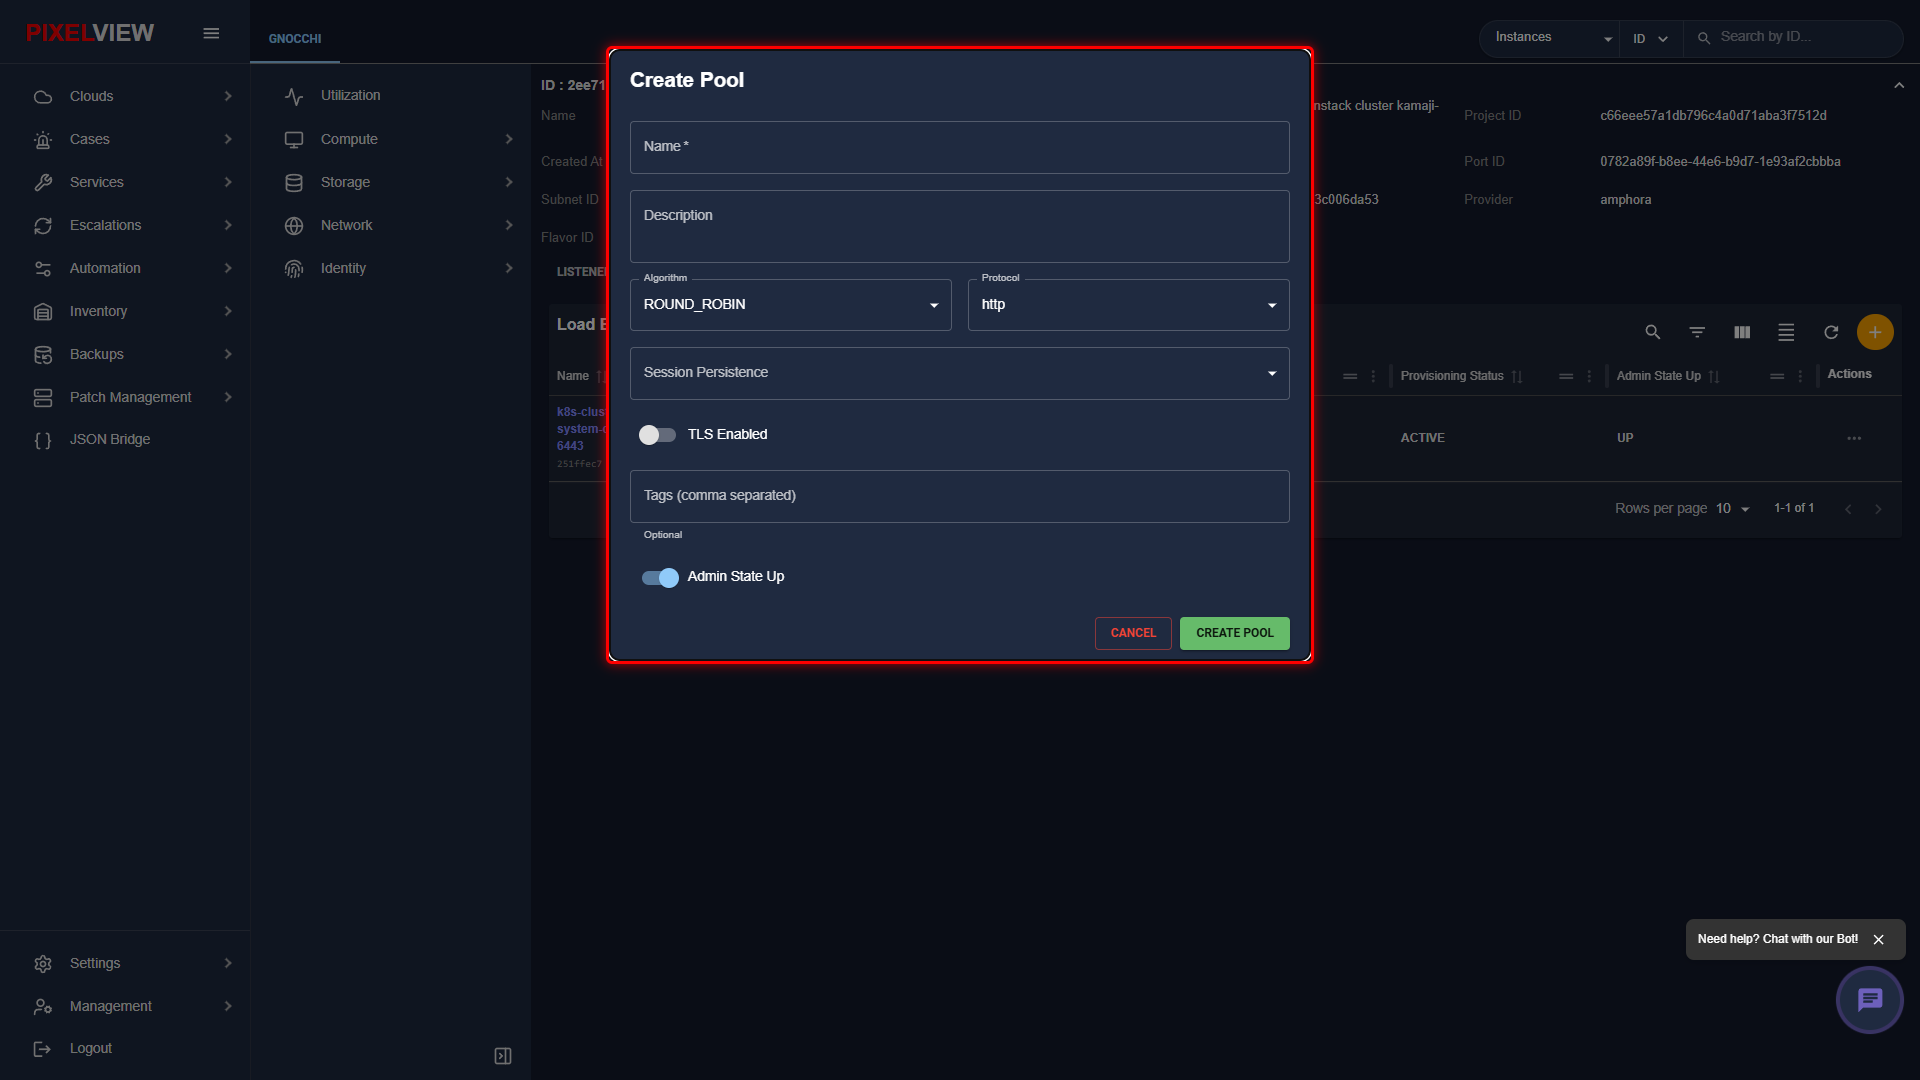
| Parameter | Type | Description |
|---|---|---|
| Name | Required Text | Identifying label for the backend server pool. |
| Description | Optional Text | Descriptive operational summary for the pool. |
| Algorithm | Required Dropdown | Traffic distribution method: ROUND_ROBIN, LEAST_CONNECTIONS, or SOURCE_IP. |
| Protocol | Required Dropdown | Communication protocol used to talk to backend pool members: http, https, tcp, udp. |
| Session Persistence | Optional Dropdown | Method used to stick client sessions to specific members (SOURCE_IP, HTTP_COOKIE, APP_COOKIE). |
| TLS Enabled | Toggle Switch | Enables backend re-encryption between the load balancer amphora and backend servers. |
| Tags | Optional Text | Comma-separated organizational tags. |
| Admin State Up | Toggle Switch | Administrative enablement state for the backend pool. |
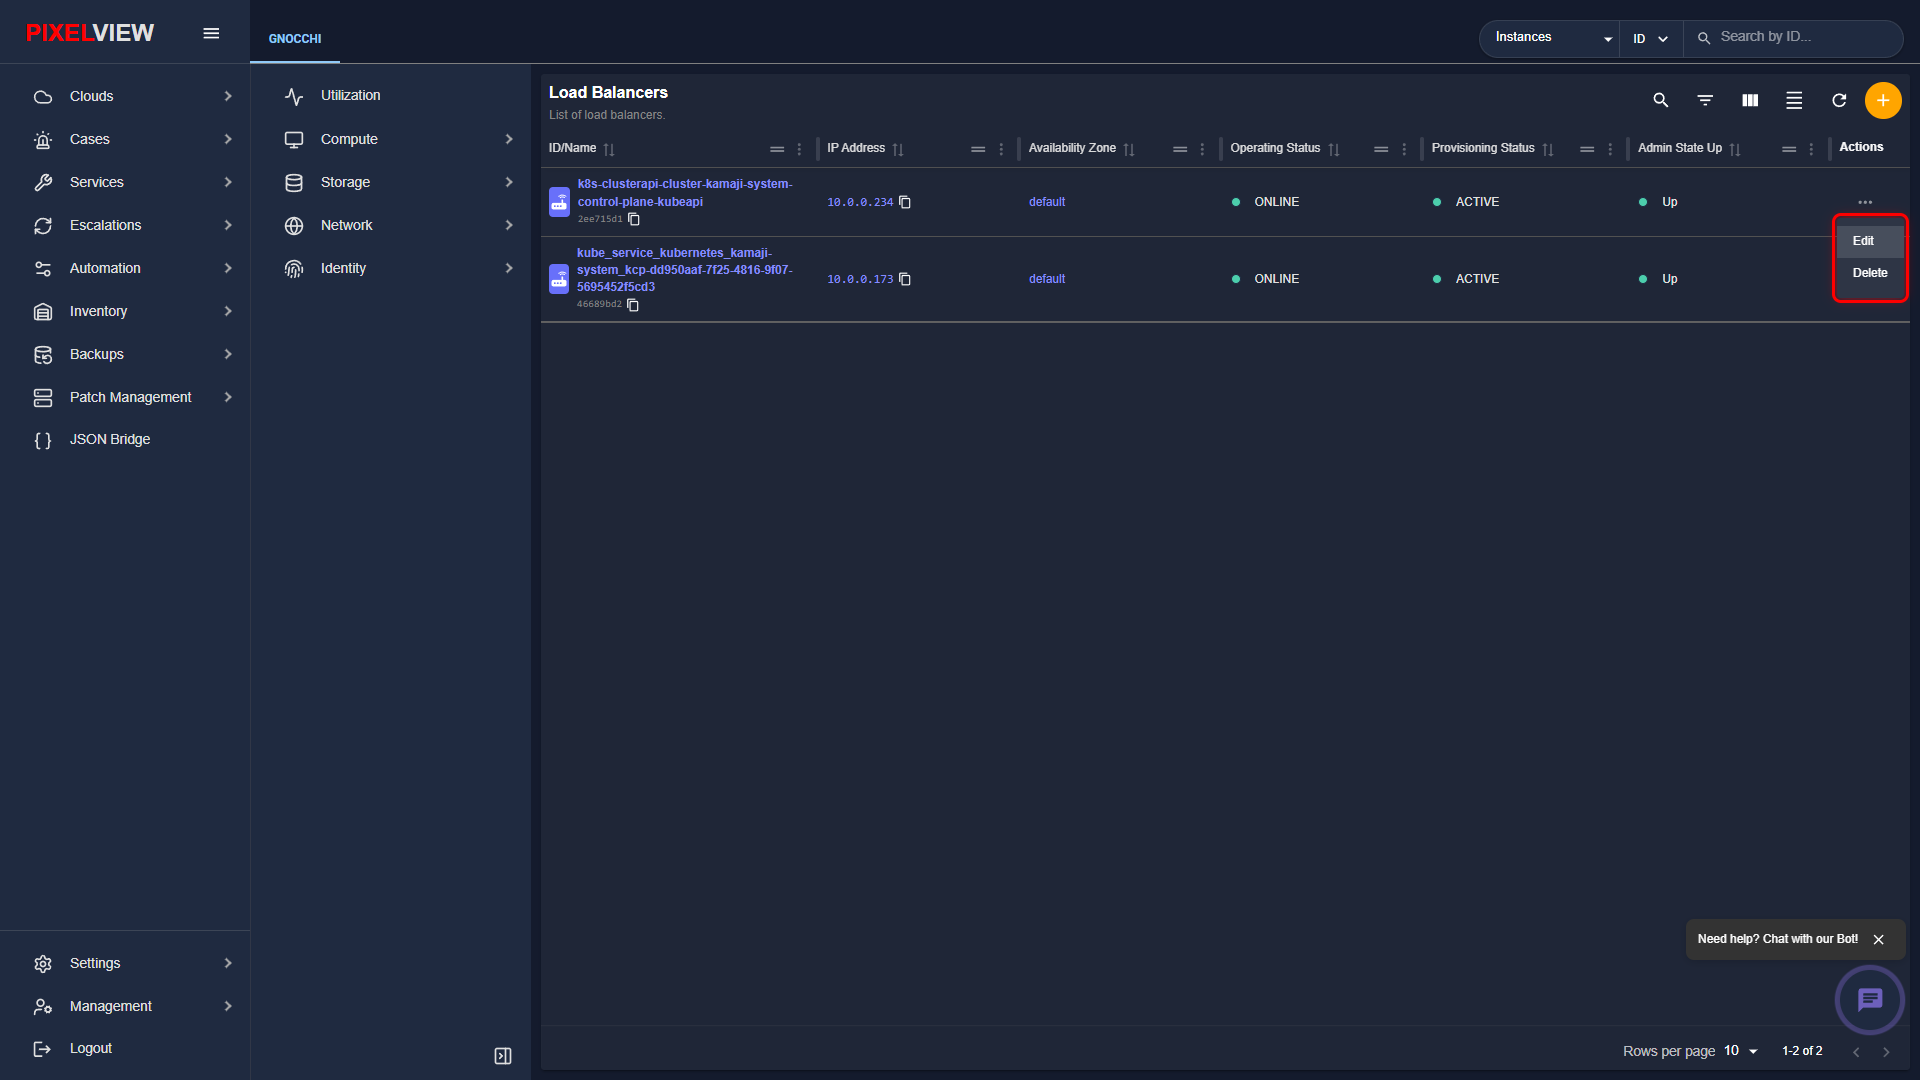
Load Balancers Contextual Row Actions
From the Load Balancers table, clicking the three-dot (...) button on any row reveals contextual management actions:
Floating IPs (Elastic Public IPs)
Floating IPs are static, publicly routable IP addresses allocated from an external pool that can be dynamically bound to any internal instance port to allow internet connectivity.
Floating IPs Table Overview
Navigate to Network → Floating IPs in the secondary sidebar:
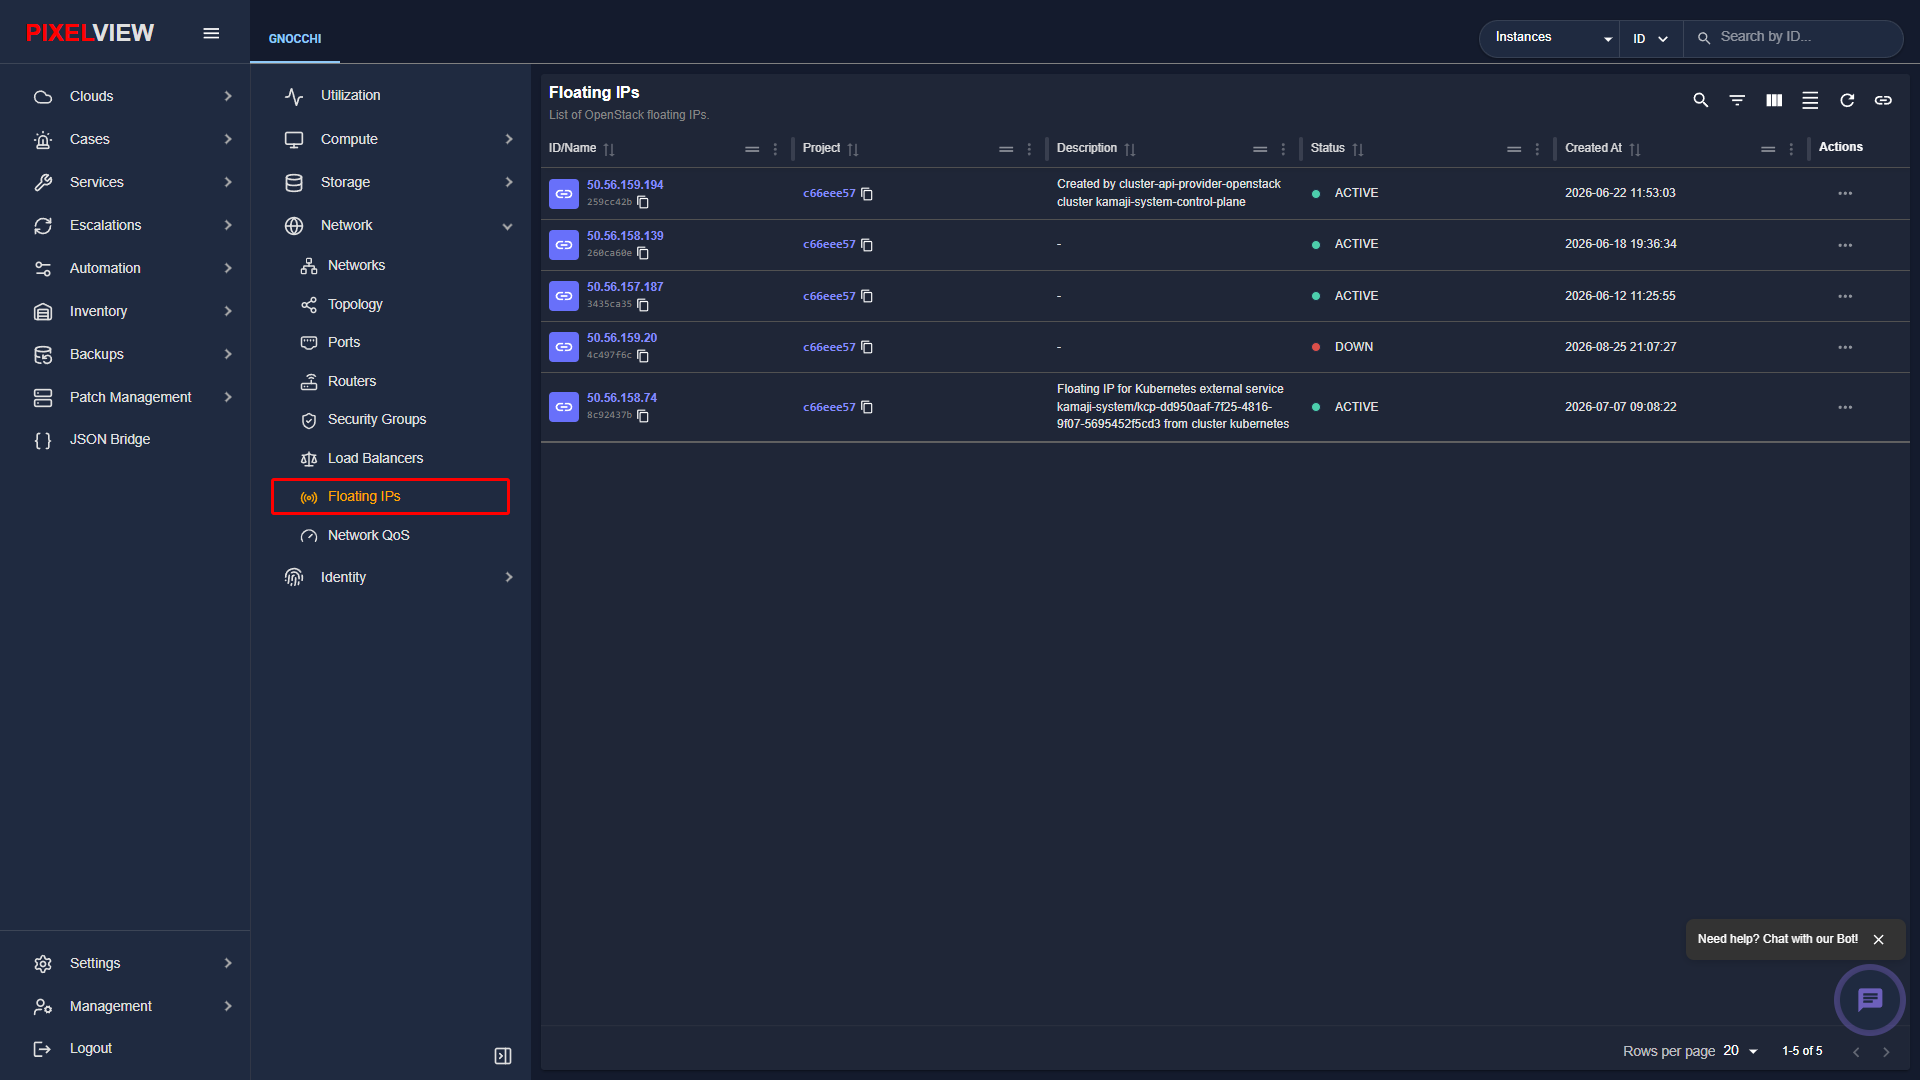
| Column | Description |
|---|---|
| ID / Name | Public IP address (e.g., 50.56.159.194, 50.56.158.139) and UUID. |
| Project | Owning project boundary. |
| Description | Operational annotation (e.g., Floating IP for Kubernetes external service). |
| Status | Allocation state: ACTIVE (mapped to a live port) or DOWN (unassociated pool address). |
| Created At | Timestamp indicating allocation date and time. |
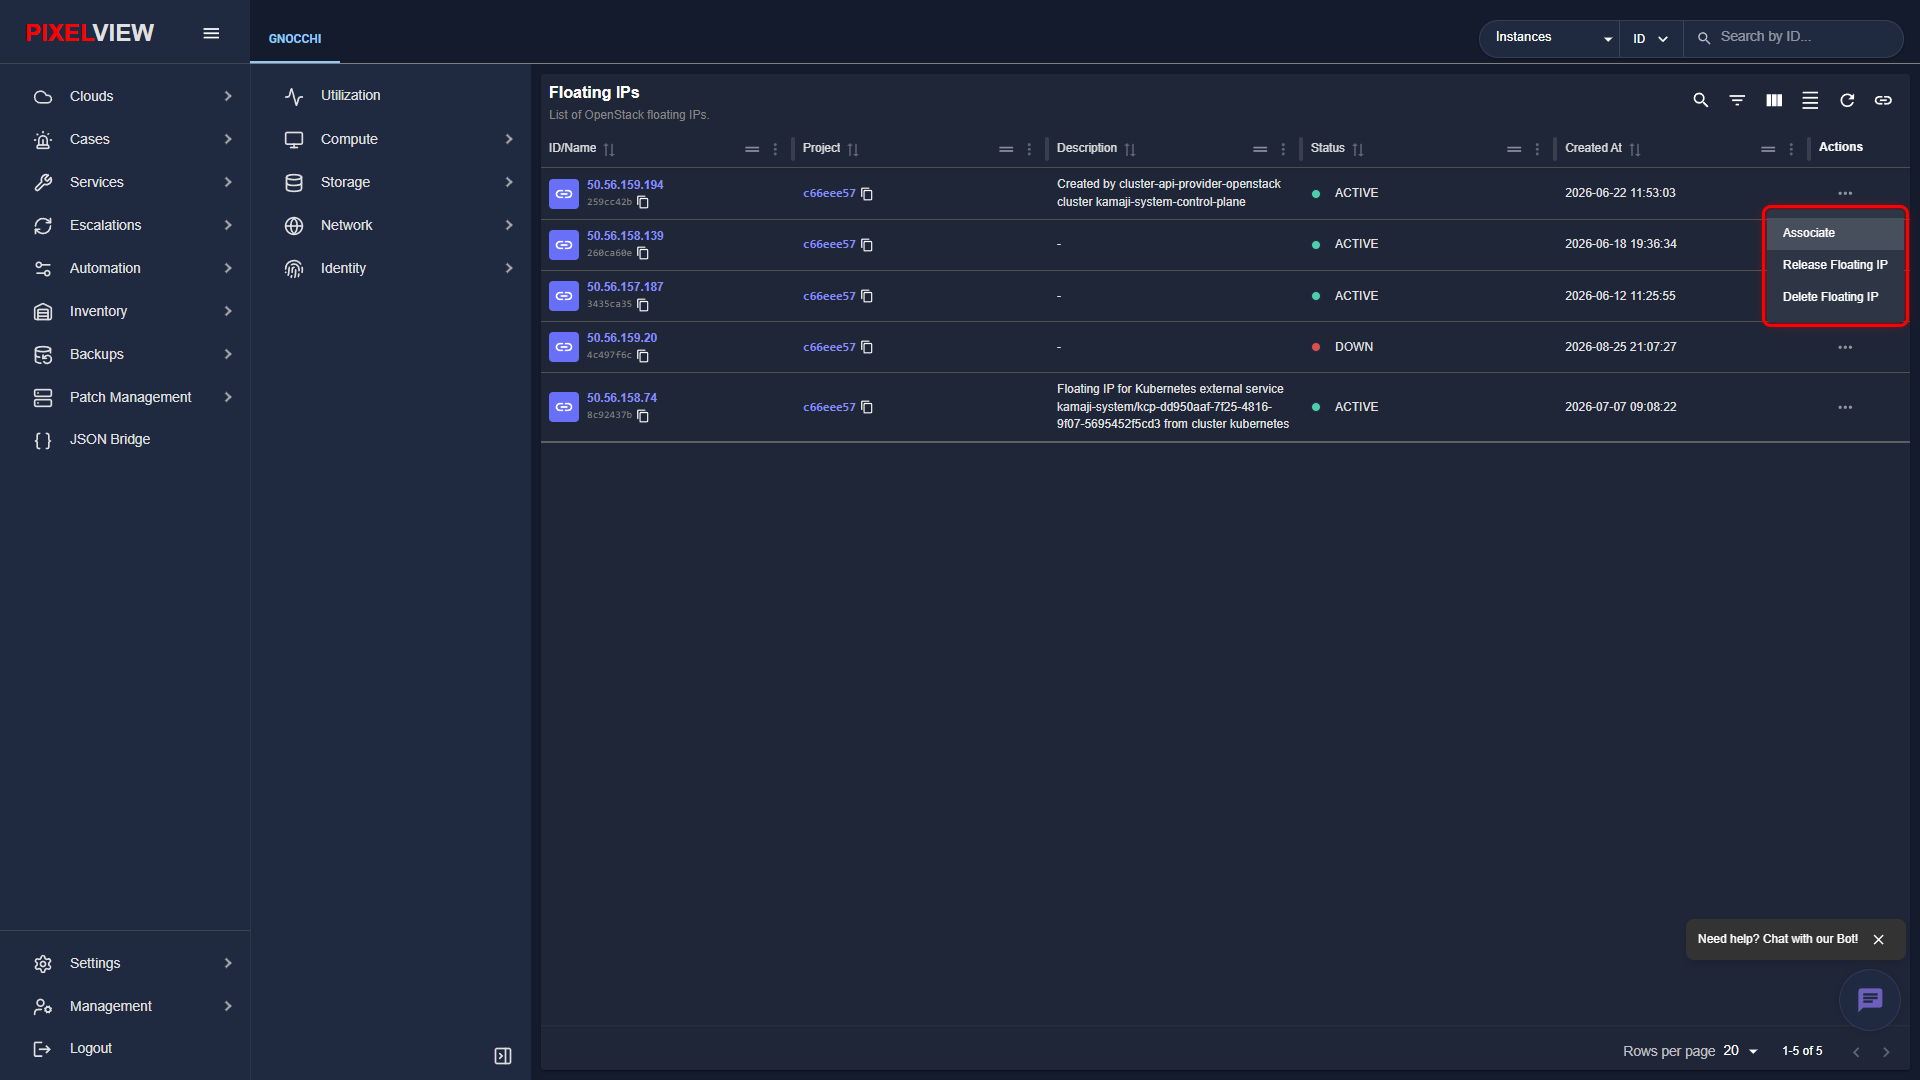
| Actions | Shortcuts to Associate to a VM interface, Disassociate, or Release back to the pool. |
Allocating a Floating IP
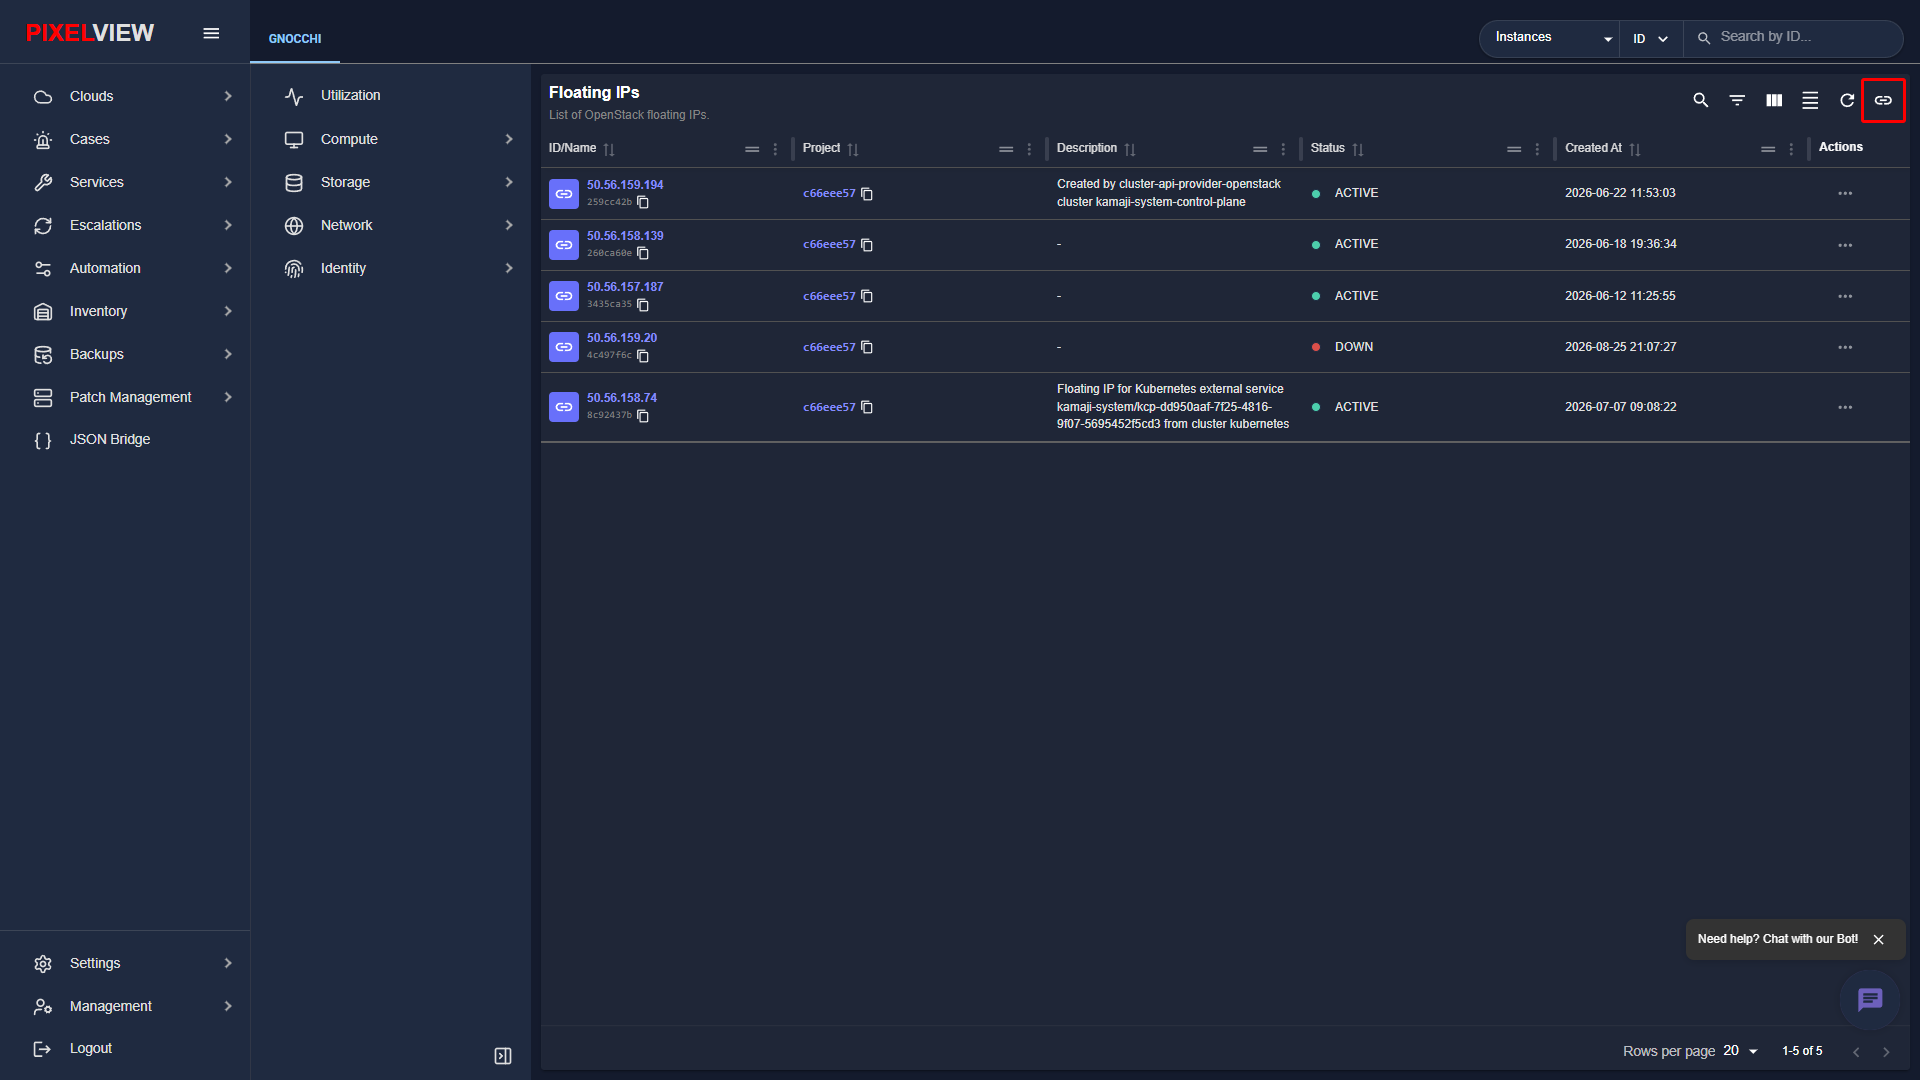
- Click the
+(Allocate Floating IP) button in the top-right toolbar:
- The Allocate Floating IP modal dialog opens:
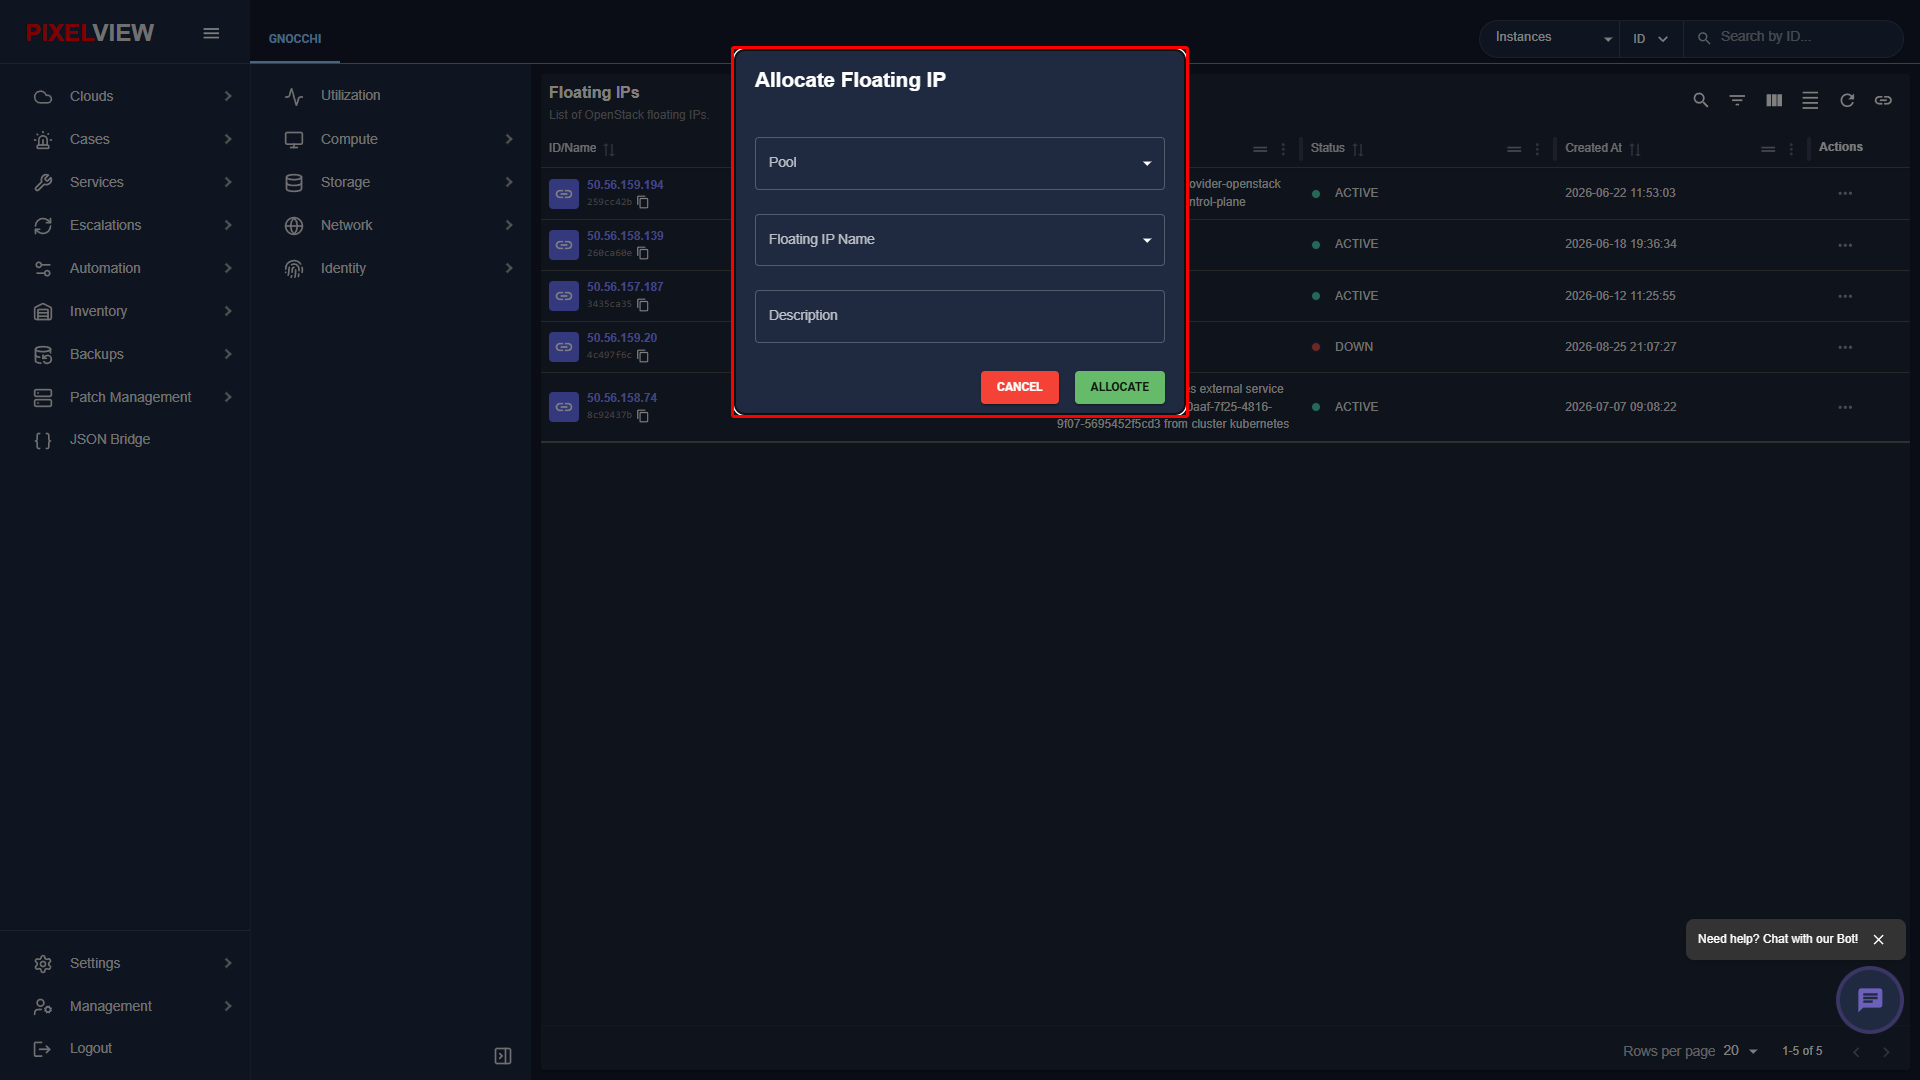
| Field | Description |
|---|---|
| Pool | Dropdown selecting the upstream public external network provider (e.g., PUBLICNET). |
| Floating IP Name | Optional DNS or descriptive alias for the IP endpoint. |
| Description | Workload reference notes. |
Floating IP Details & Drill-Down
Clicking on any floating IP address navigates to the Floating IP Details page (/openstack/:regionName/floating-ips/:uuid):
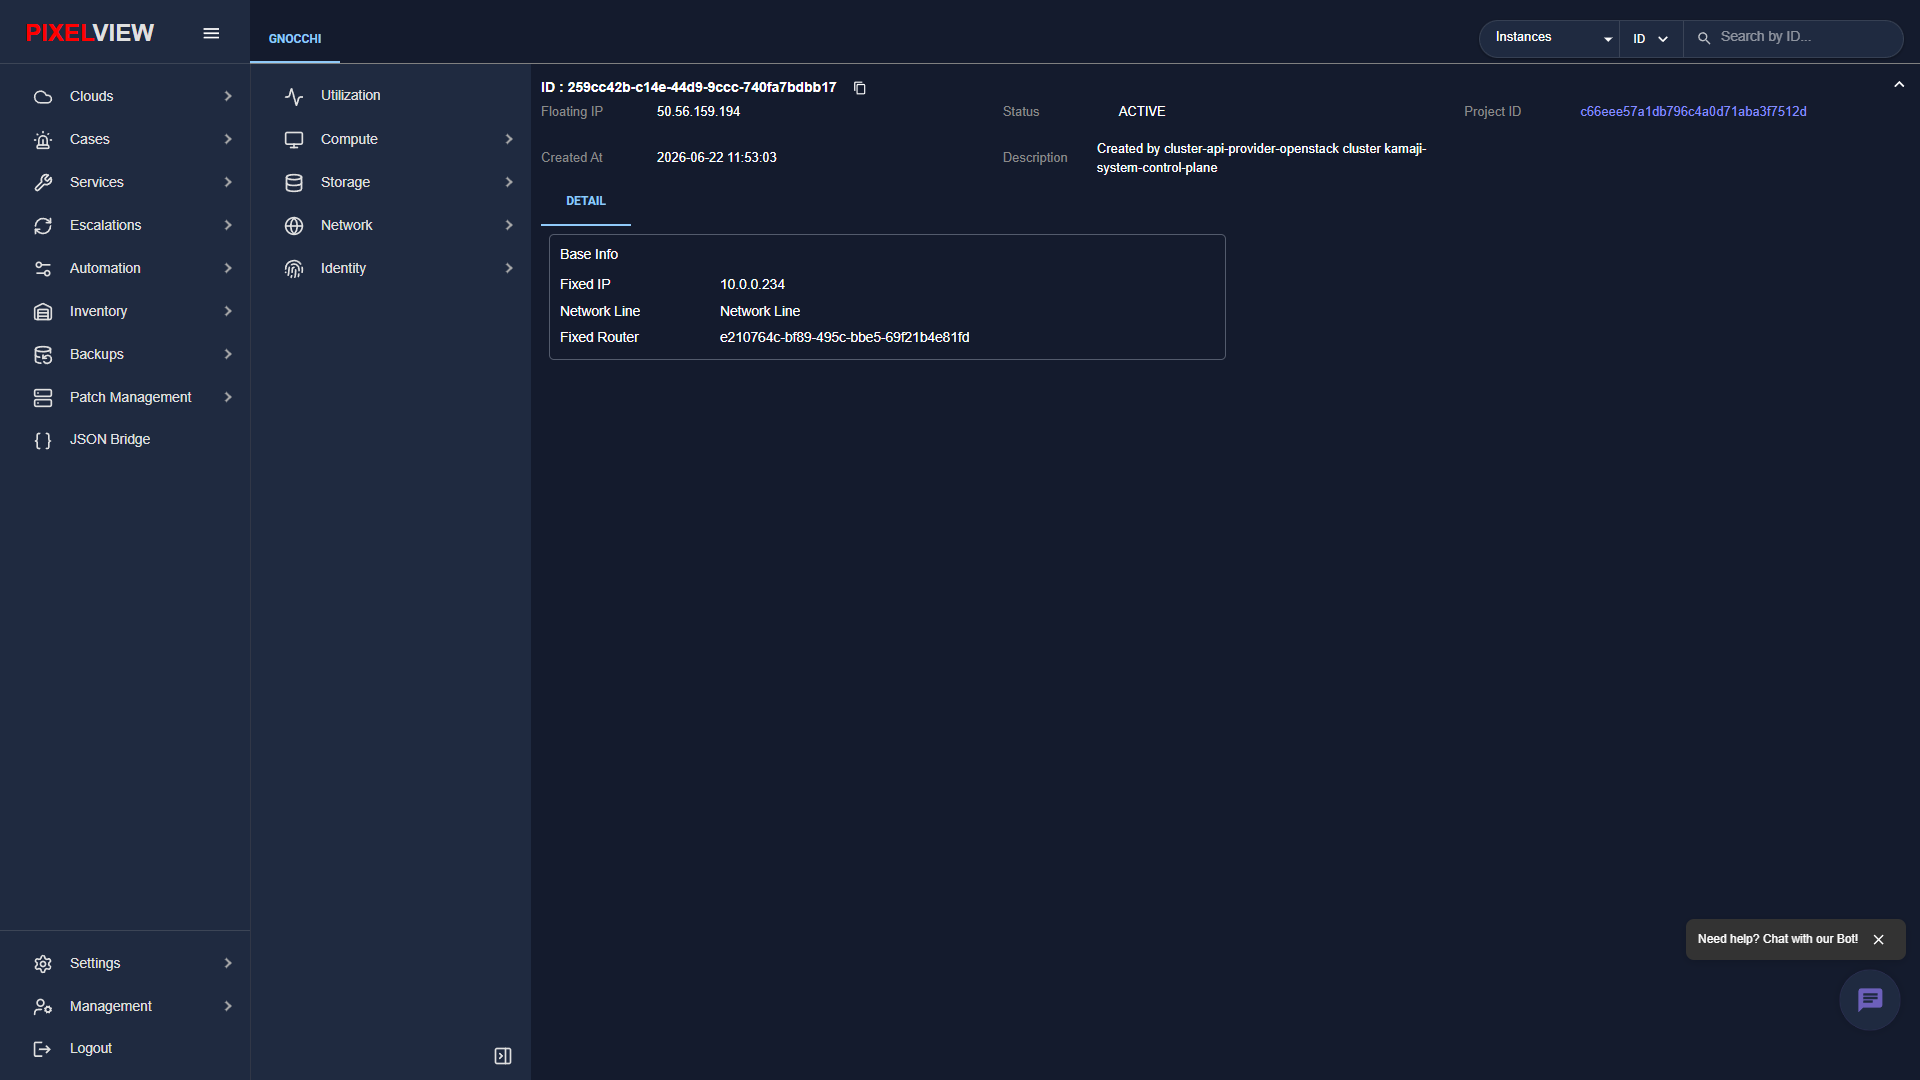
The Details view summarizes:
- Base Info: Public IP address, operational status (ACTIVE), and project ownership.
- Fixed IP: Internal private IP endpoint (10.0.0.234) currently receiving forwarded packets.
- Network Line: Associated L2 broadcast segment.
- Fixed Router: Upstream Layer 3 router UUID performing NAT translation.
Floating IPs Contextual Row Actions
In the Floating IPs table, clicking the three-dot (...) button opens the row actions menu:
Network QoS Policies (Traffic Shaping & Bandwidth Limits)
The Network QoS module (/openstack/:regionName/network-qos) provides quality-of-service governance, allowing administrators to define bandwidth enforcement rules, egress rate limits, and DSCP traffic marking across tenant ports and networks.
Network QoS Table Overview
Navigate to Network → Network QoS in the secondary sidebar:
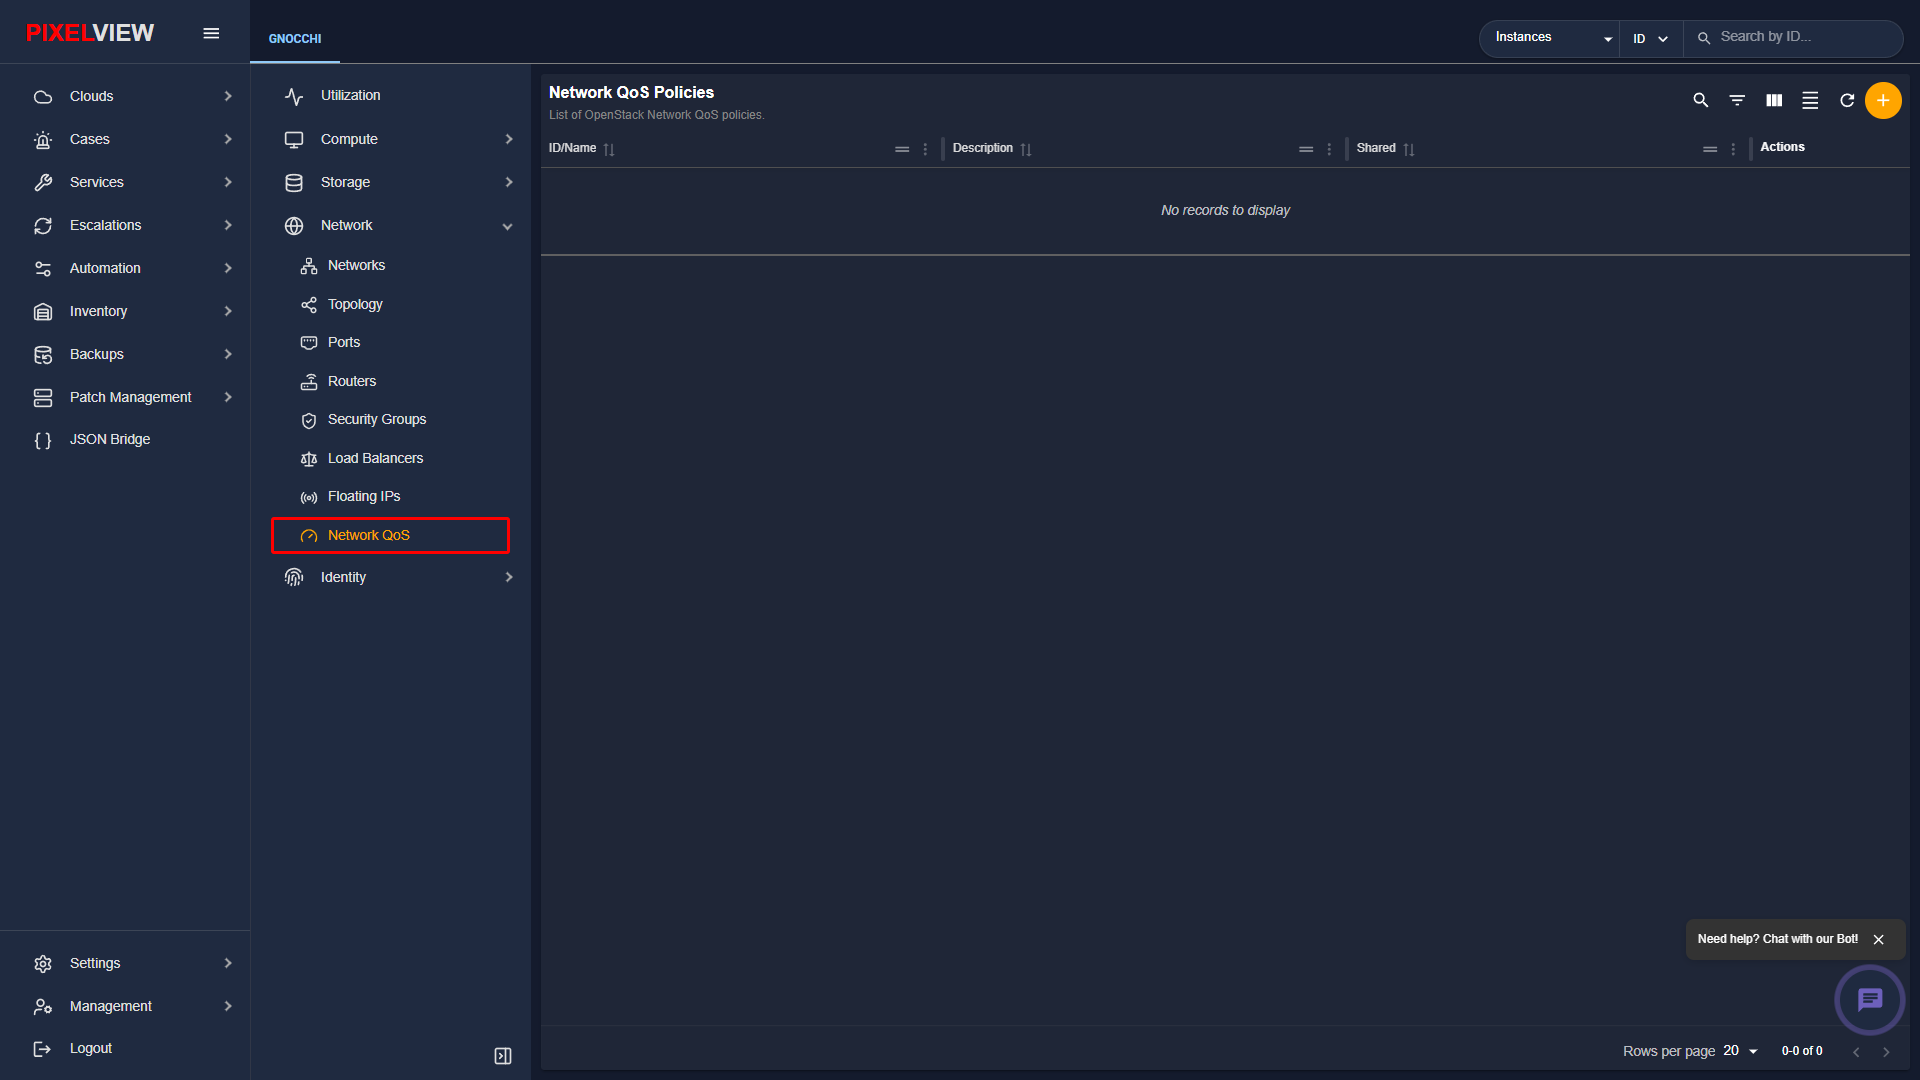
| Column | Description |
|---|---|
| ID / Name | QoS policy name and system UUID. |
| Description | Operational documentation detailing rate limit parameters and target workloads. |
| Shared | Boolean indicator showing whether the QoS policy is shareable across multiple tenant projects. |
| Actions | Options menu to edit policy rules, attach bandwidth limit rules, or delete the policy. |
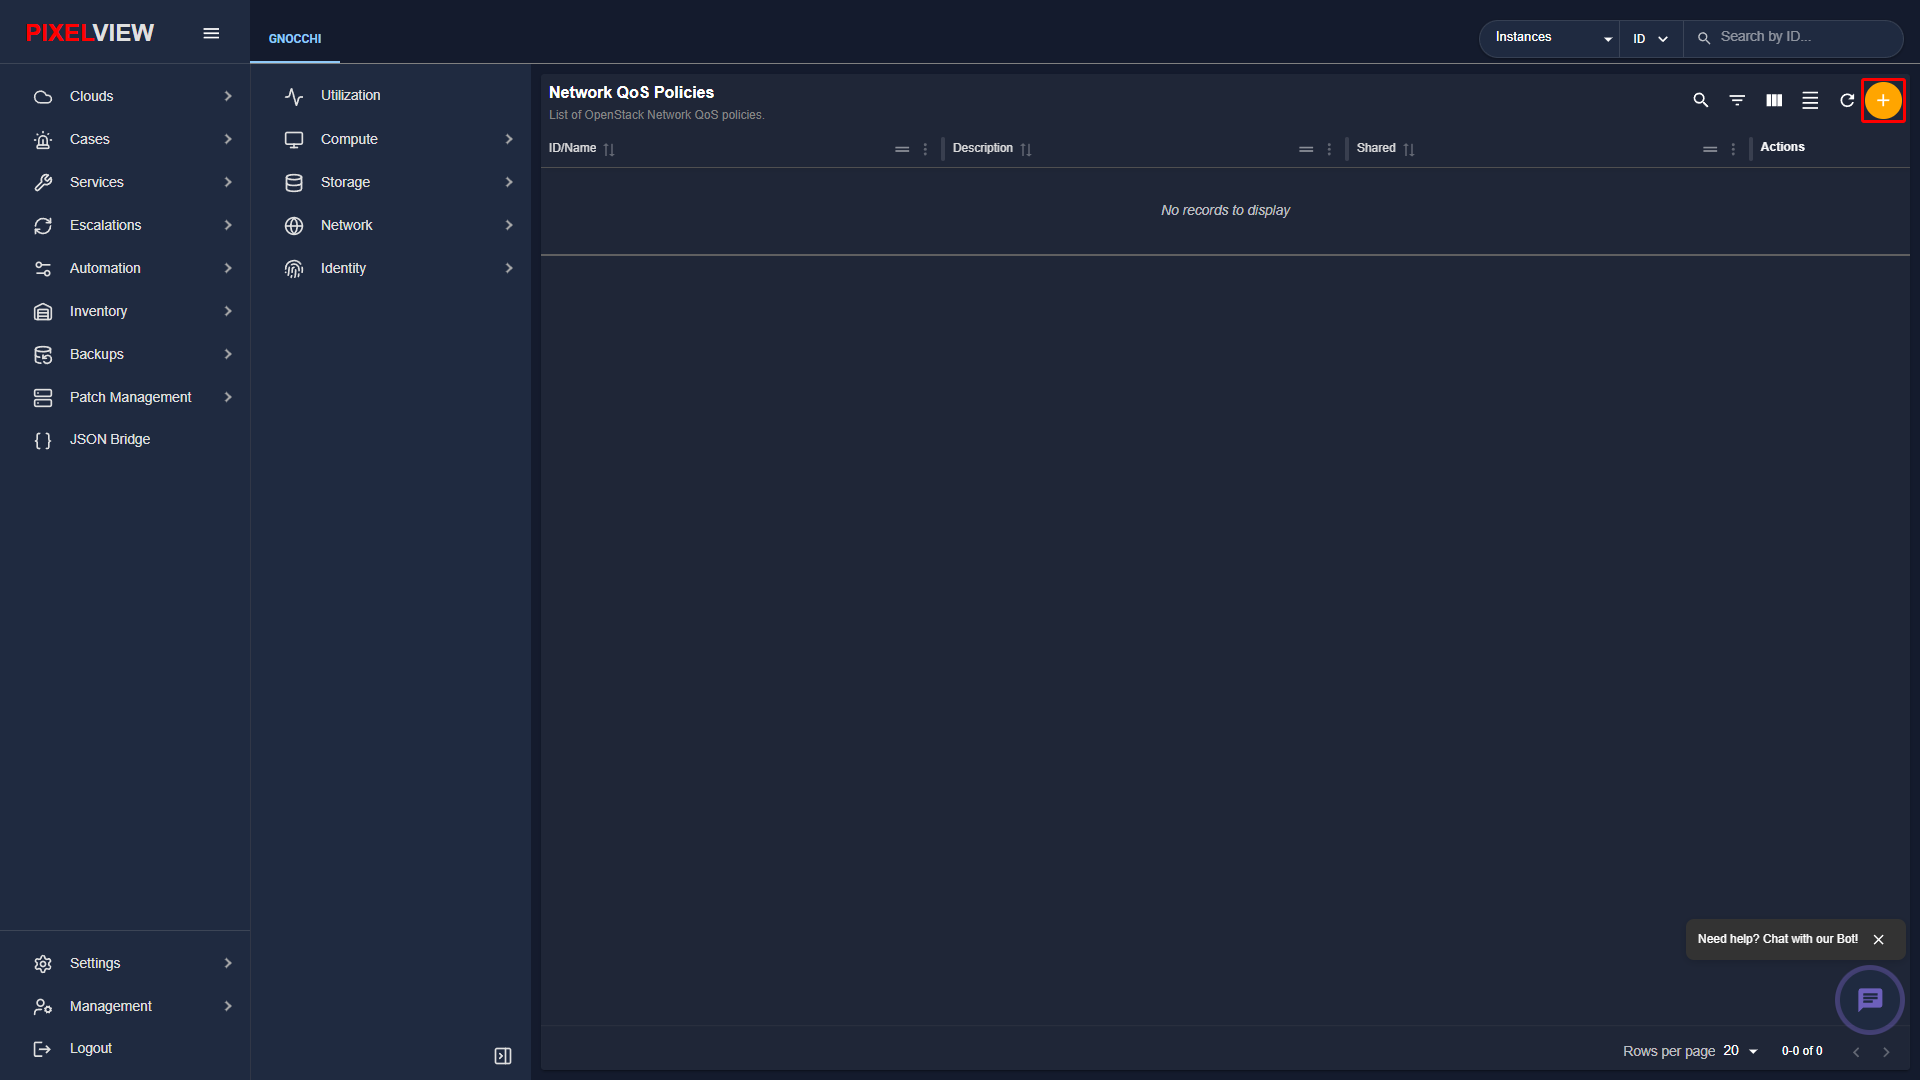
Creating a Network QoS Policy
To create a new Quality of Service policy:
* Click the orange + button in the top-right toolbar:
- The Create Network QoS Policy modal dialog opens:
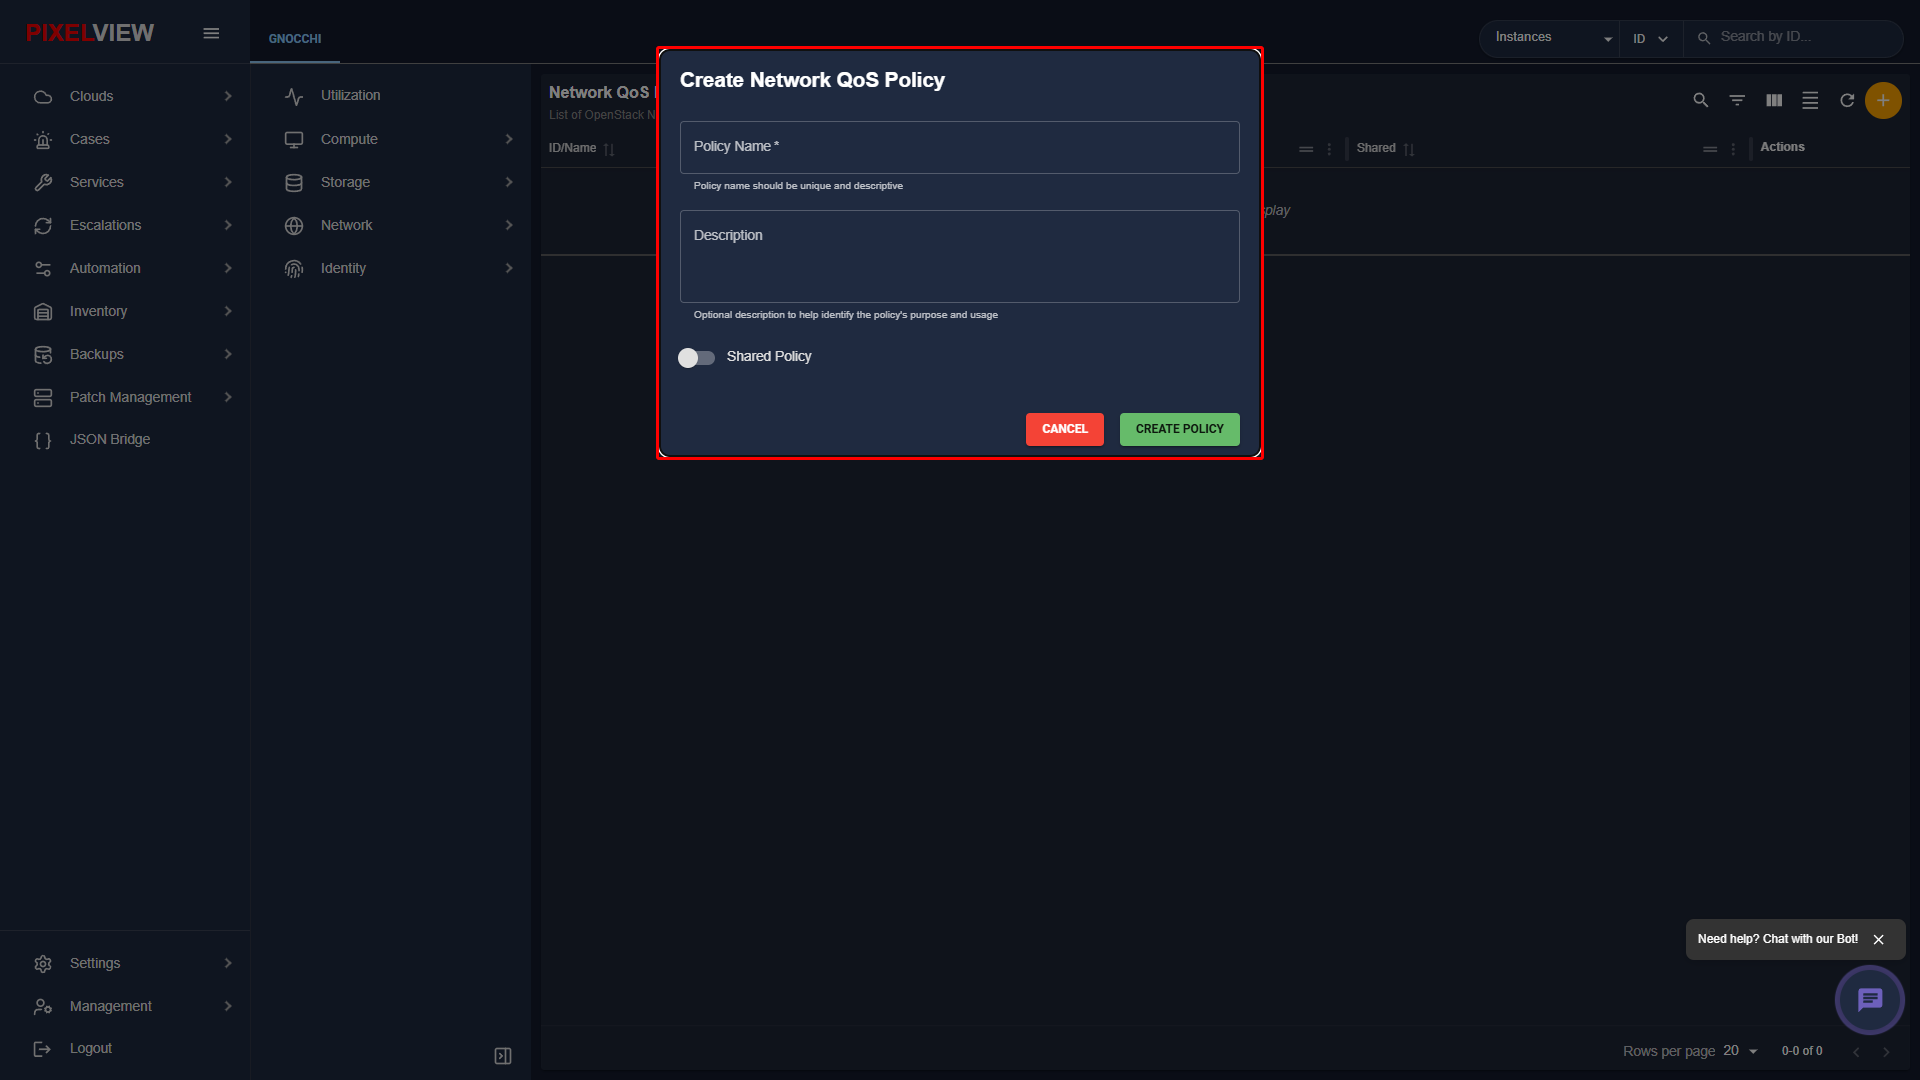
| Parameter | Type | Description |
|---|---|---|
| Policy Name | Required Text | A descriptive, unique name identifying the policy (e.g., high-priority-egress, limit-100mbps). |
| Description | Optional Text | Contextual notes detailing bandwidth constraints, DSCP markings, or burst rates. |
| Shared Policy | Toggle Switch | When enabled, permits this QoS policy to be bound to networks and ports belonging to other tenant projects within the region. |
Identity & Governance (Keystone)
The Identity submenu manages Keystone multi-tenancy, project boundaries, user directory records, access groups, and automation credentials.
Projects (Tenants)
Projects Table Overview
Navigate to Identity → Projects in the secondary sidebar:
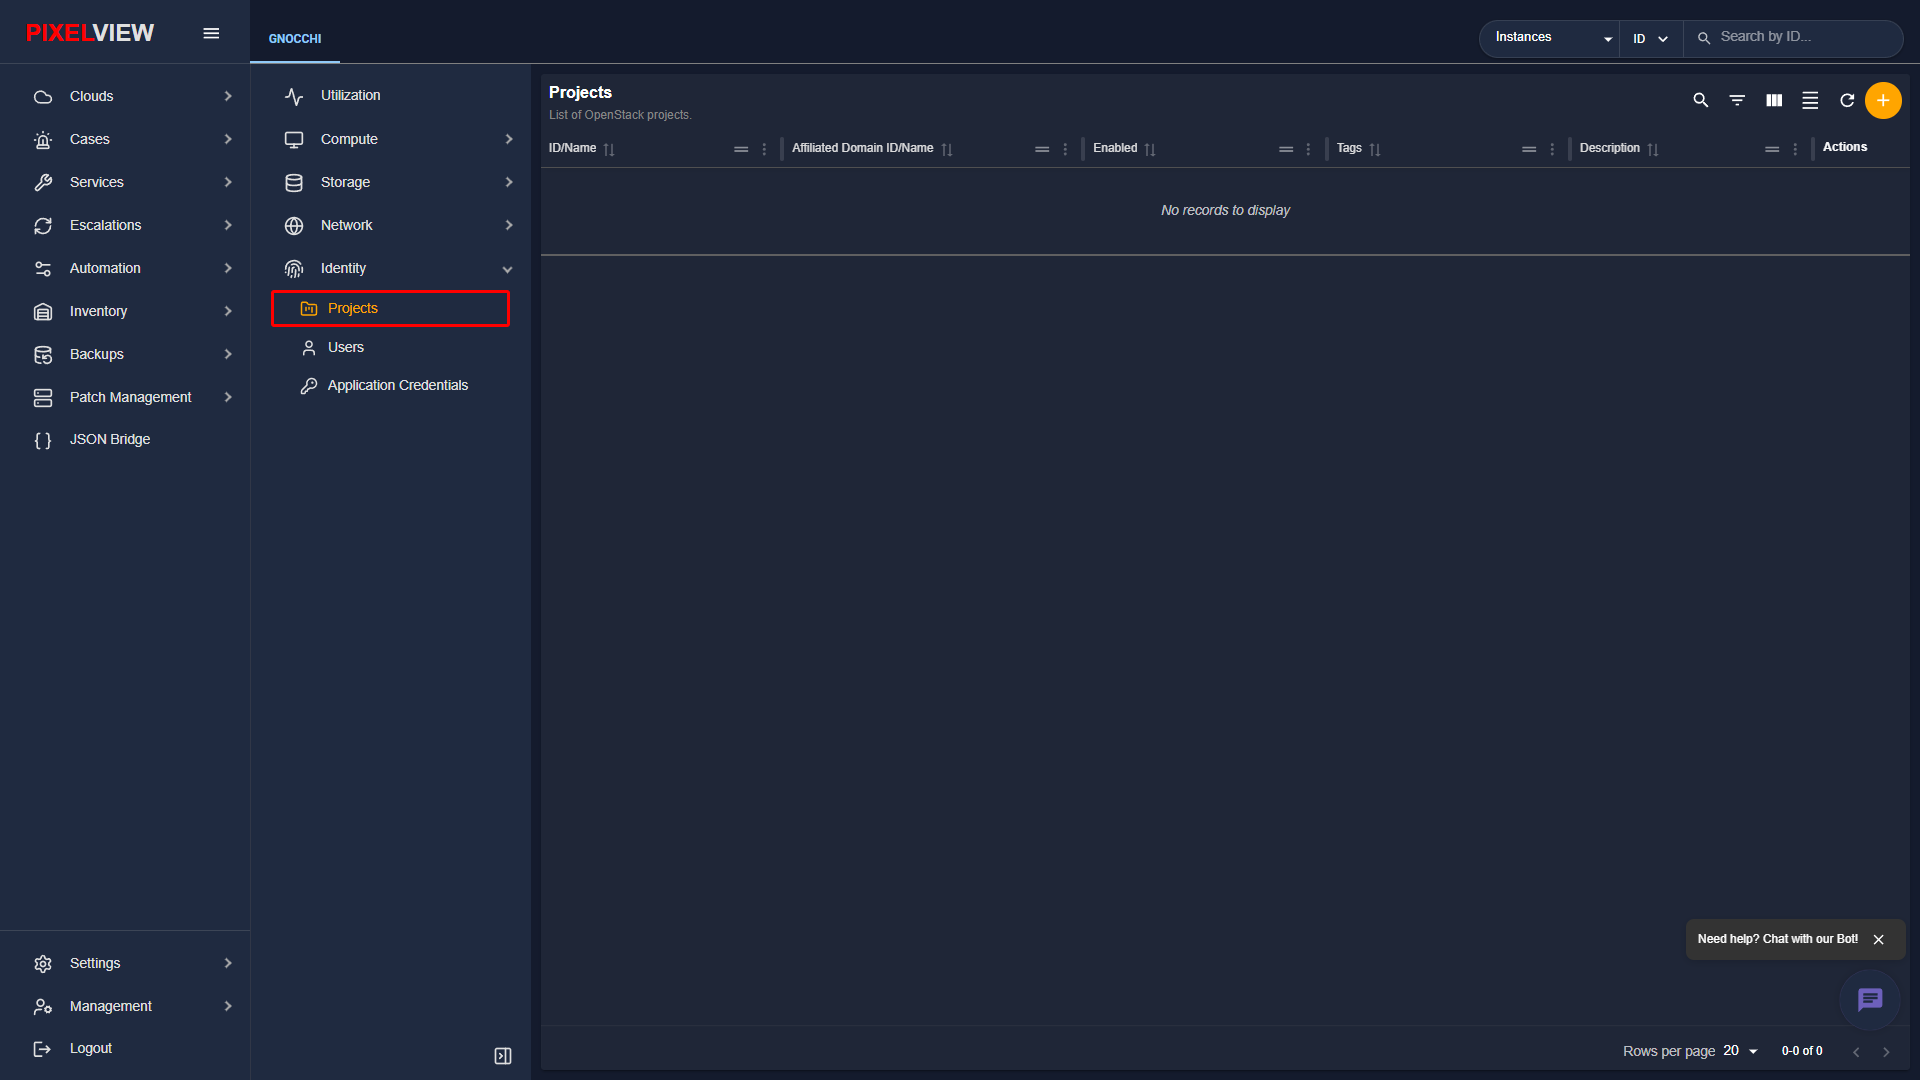
| Column | Description |
|---|---|
| ID / Name | Project display label (e.g., admin, service, production-app) and unique UUID. |
| Domain | Keystone authentication domain (default: Default). |
| Description | Business unit, environment, or billing cost-center notes. |
| Enabled | Status badge indicating whether project workloads are authorized. |
| Actions | Context shortcuts to manage project quotas, assign user memberships, or delete. |
Creating a Project
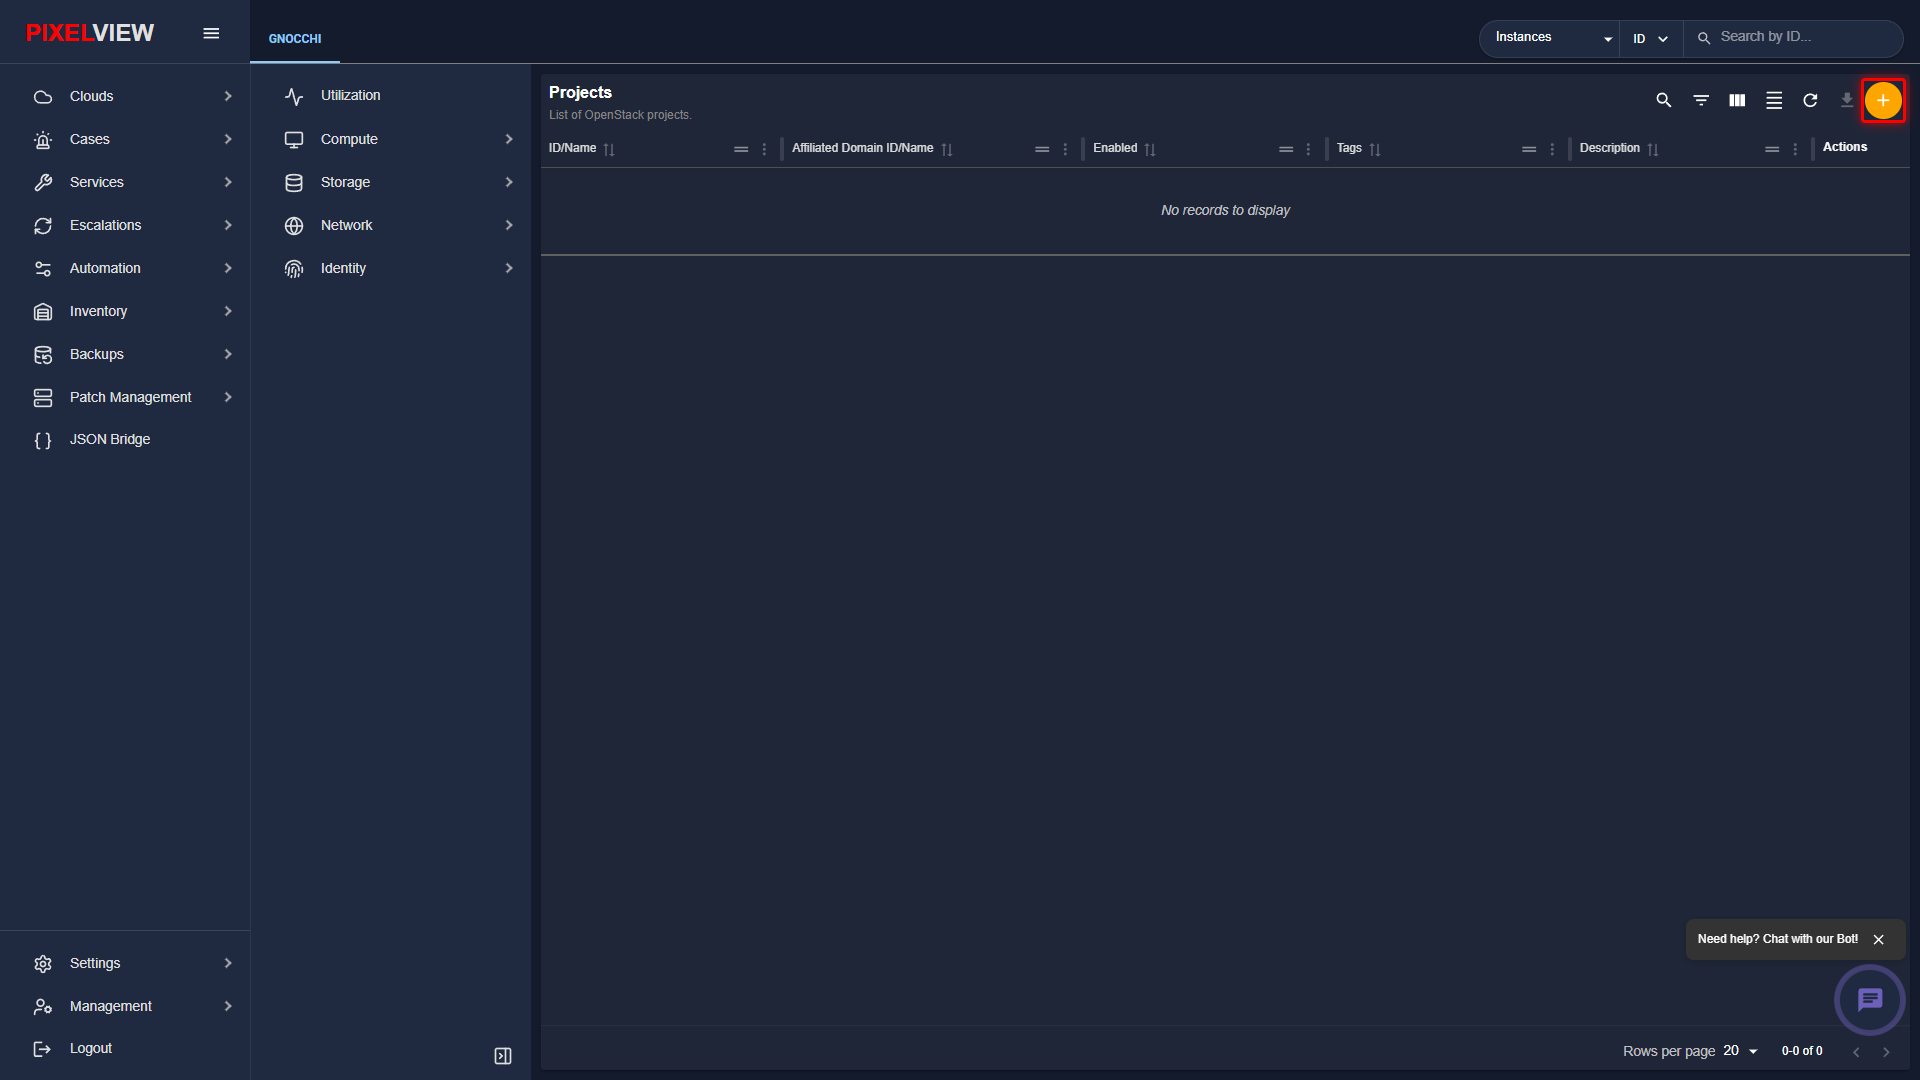
To establish a new tenant project boundary:
* Click the orange + (Create Project) button in the upper right toolbar:
- The Create Project modal dialog opens:
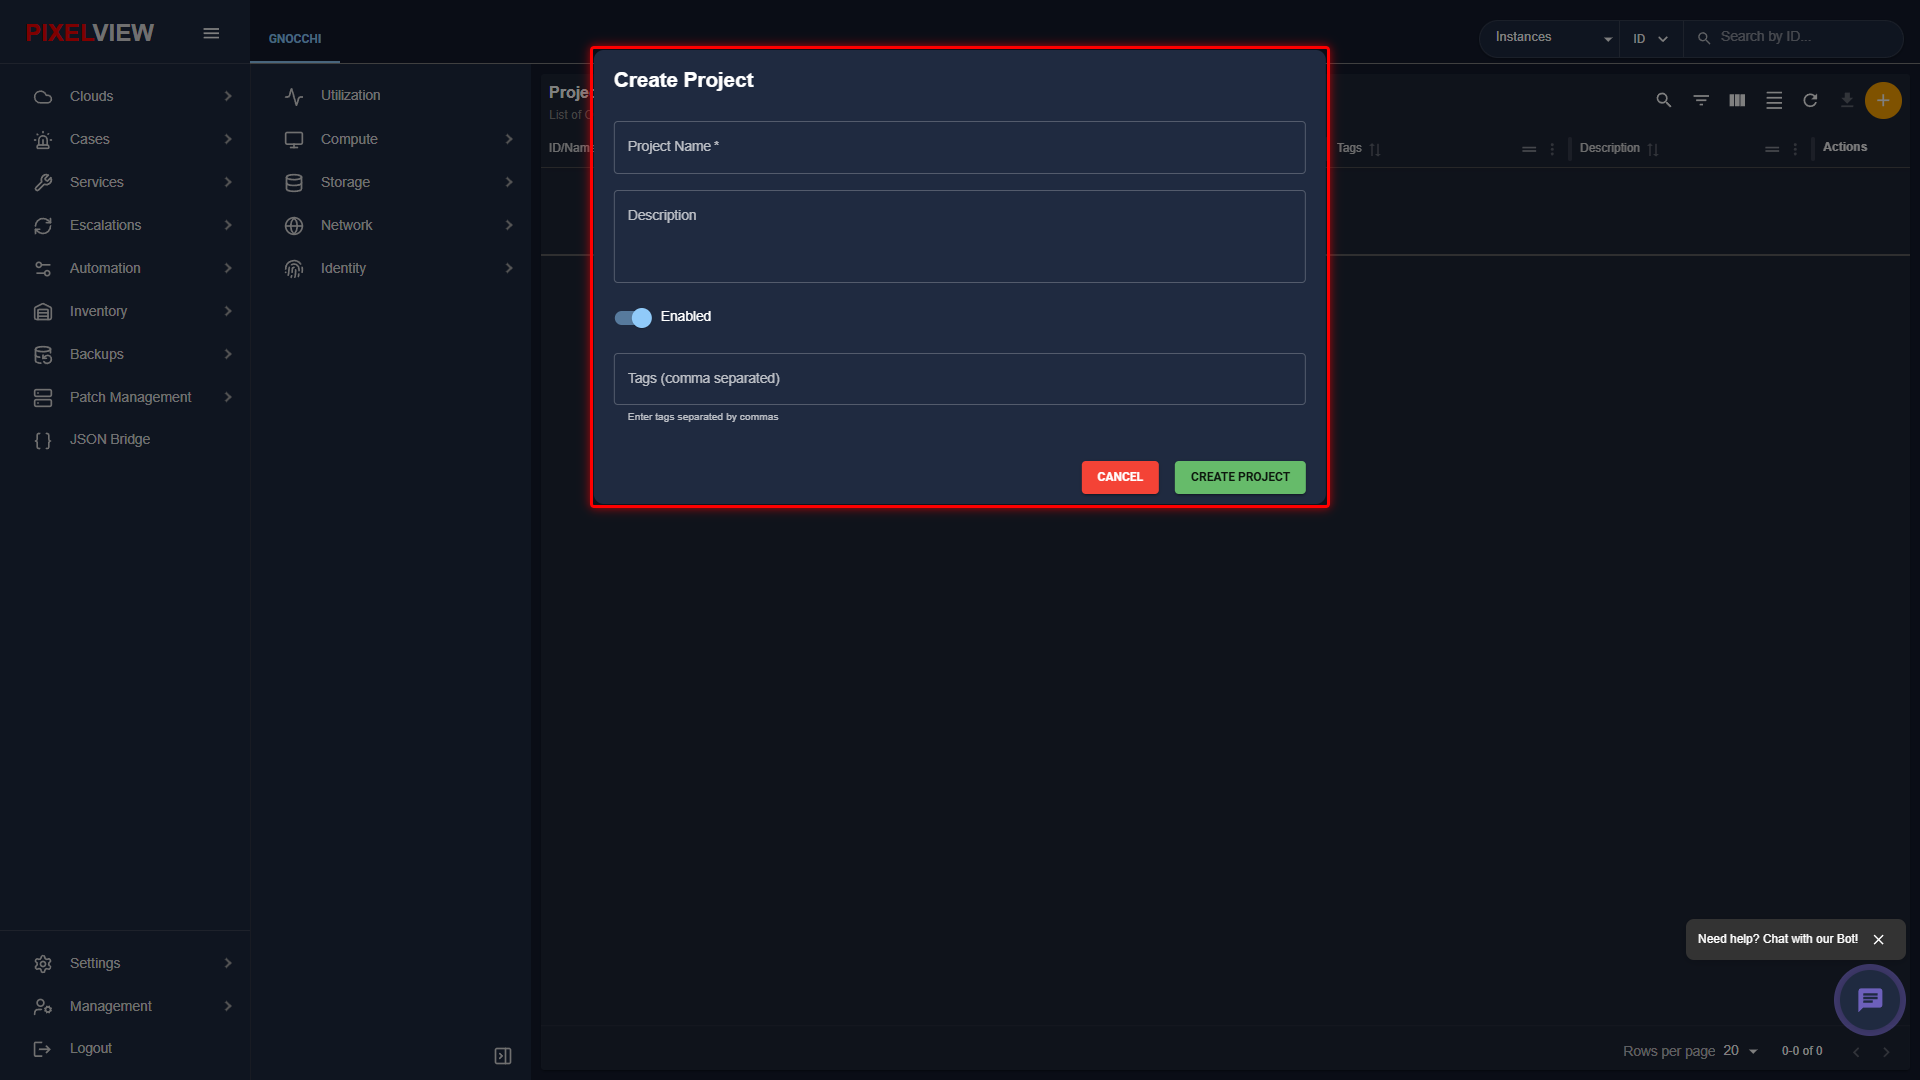
| Parameter | Type | Description |
|---|---|---|
| Project Name | Required Text | Unique tenant identifier label (e.g., devops-cluster, staging-env). |
| Description | Optional Text | Contextual notes regarding business unit, cost center, or owner. |
| Enabled | Toggle Switch | Activates immediate workload provisioning inside this project when turned on. |
| Tags (comma separated) | Optional Text | Metadata classification tags for grouping and governance queries. |
Users
Users Table Overview
Navigate to Identity → Users in the secondary sidebar:
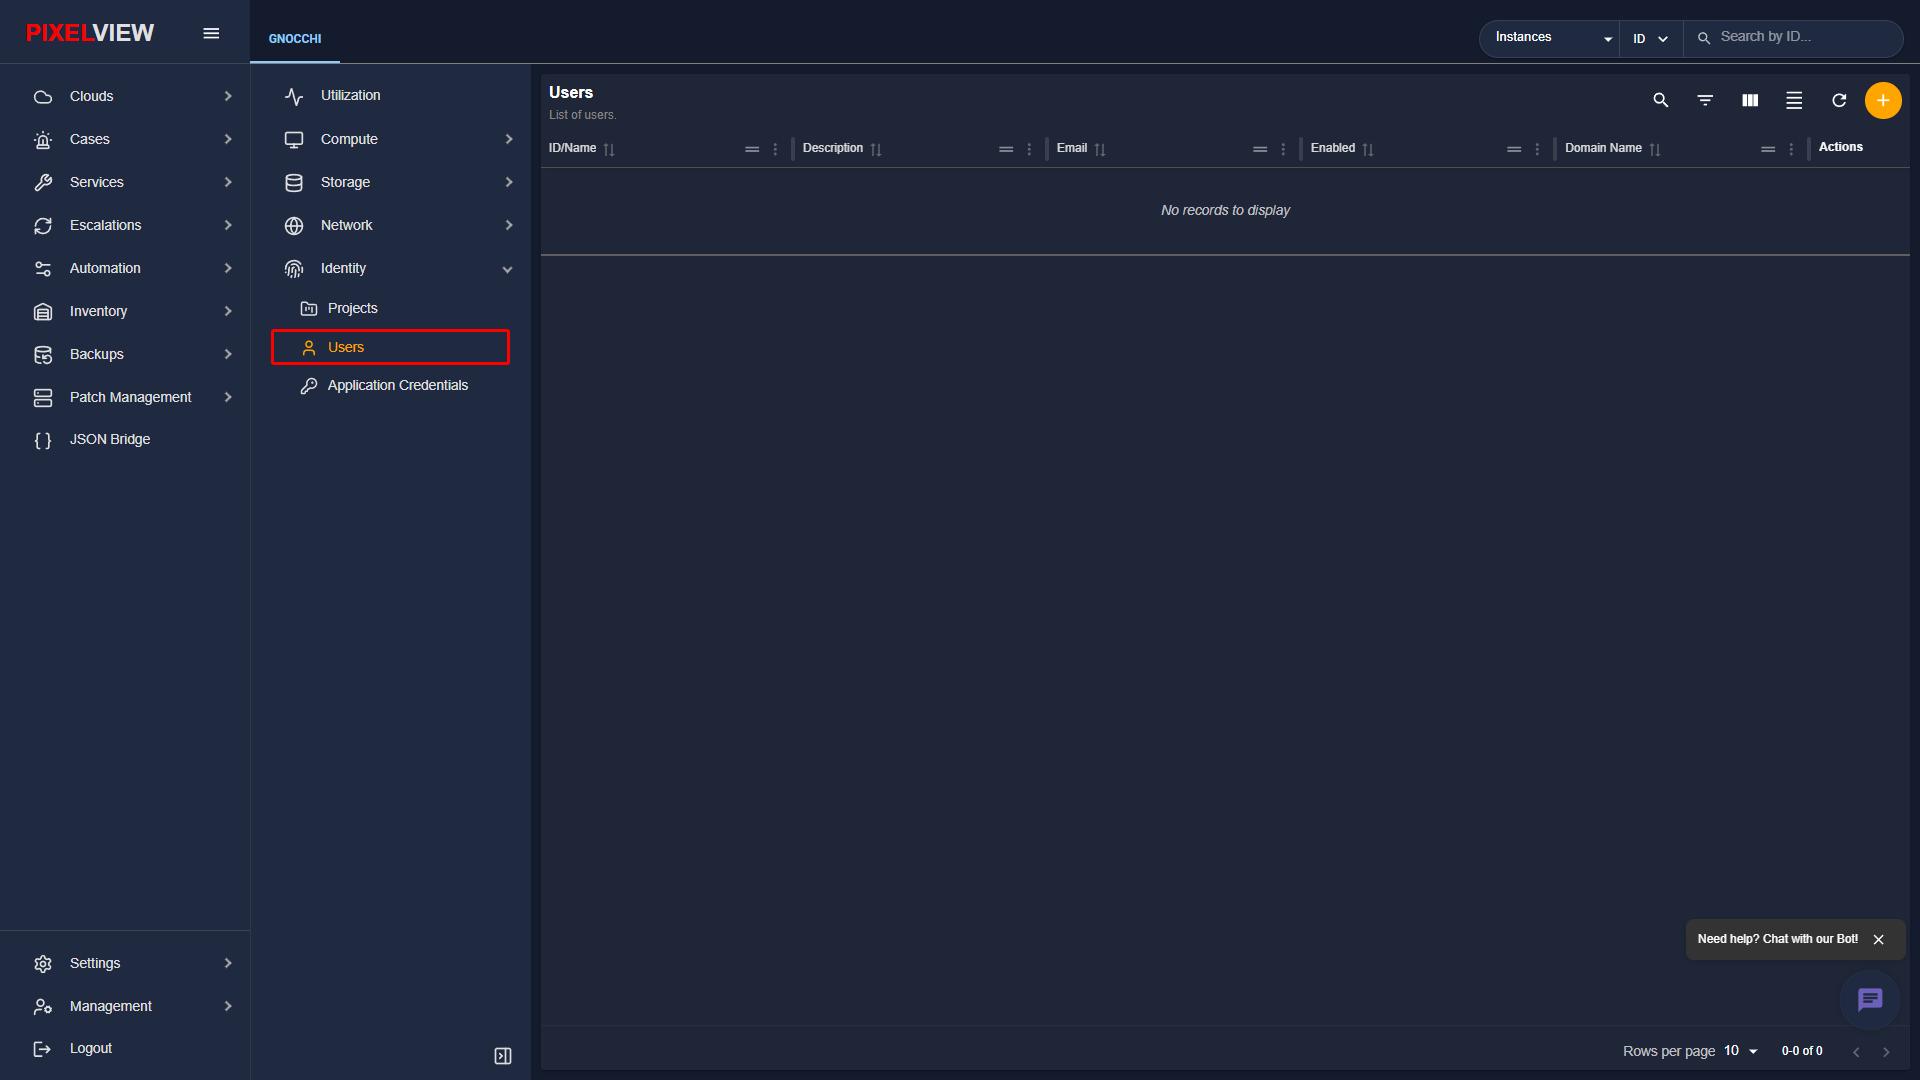
| Column | Description |
|---|---|
| ID / Name | User login handle, username, and UUID. |
| User contact email address. | |
| Domain | Keystone domain holding user credentials. |
| Primary Project | Default tenant scope assigned upon authentication. |
| Enabled | Account status (true / false). |
| Actions | Reset user password, modify role bindings, or disable login. |
Creating a User
To provision a new user account:
* Click the orange + (Create User) button in the upper right toolbar:
- The Create User modal dialog opens:
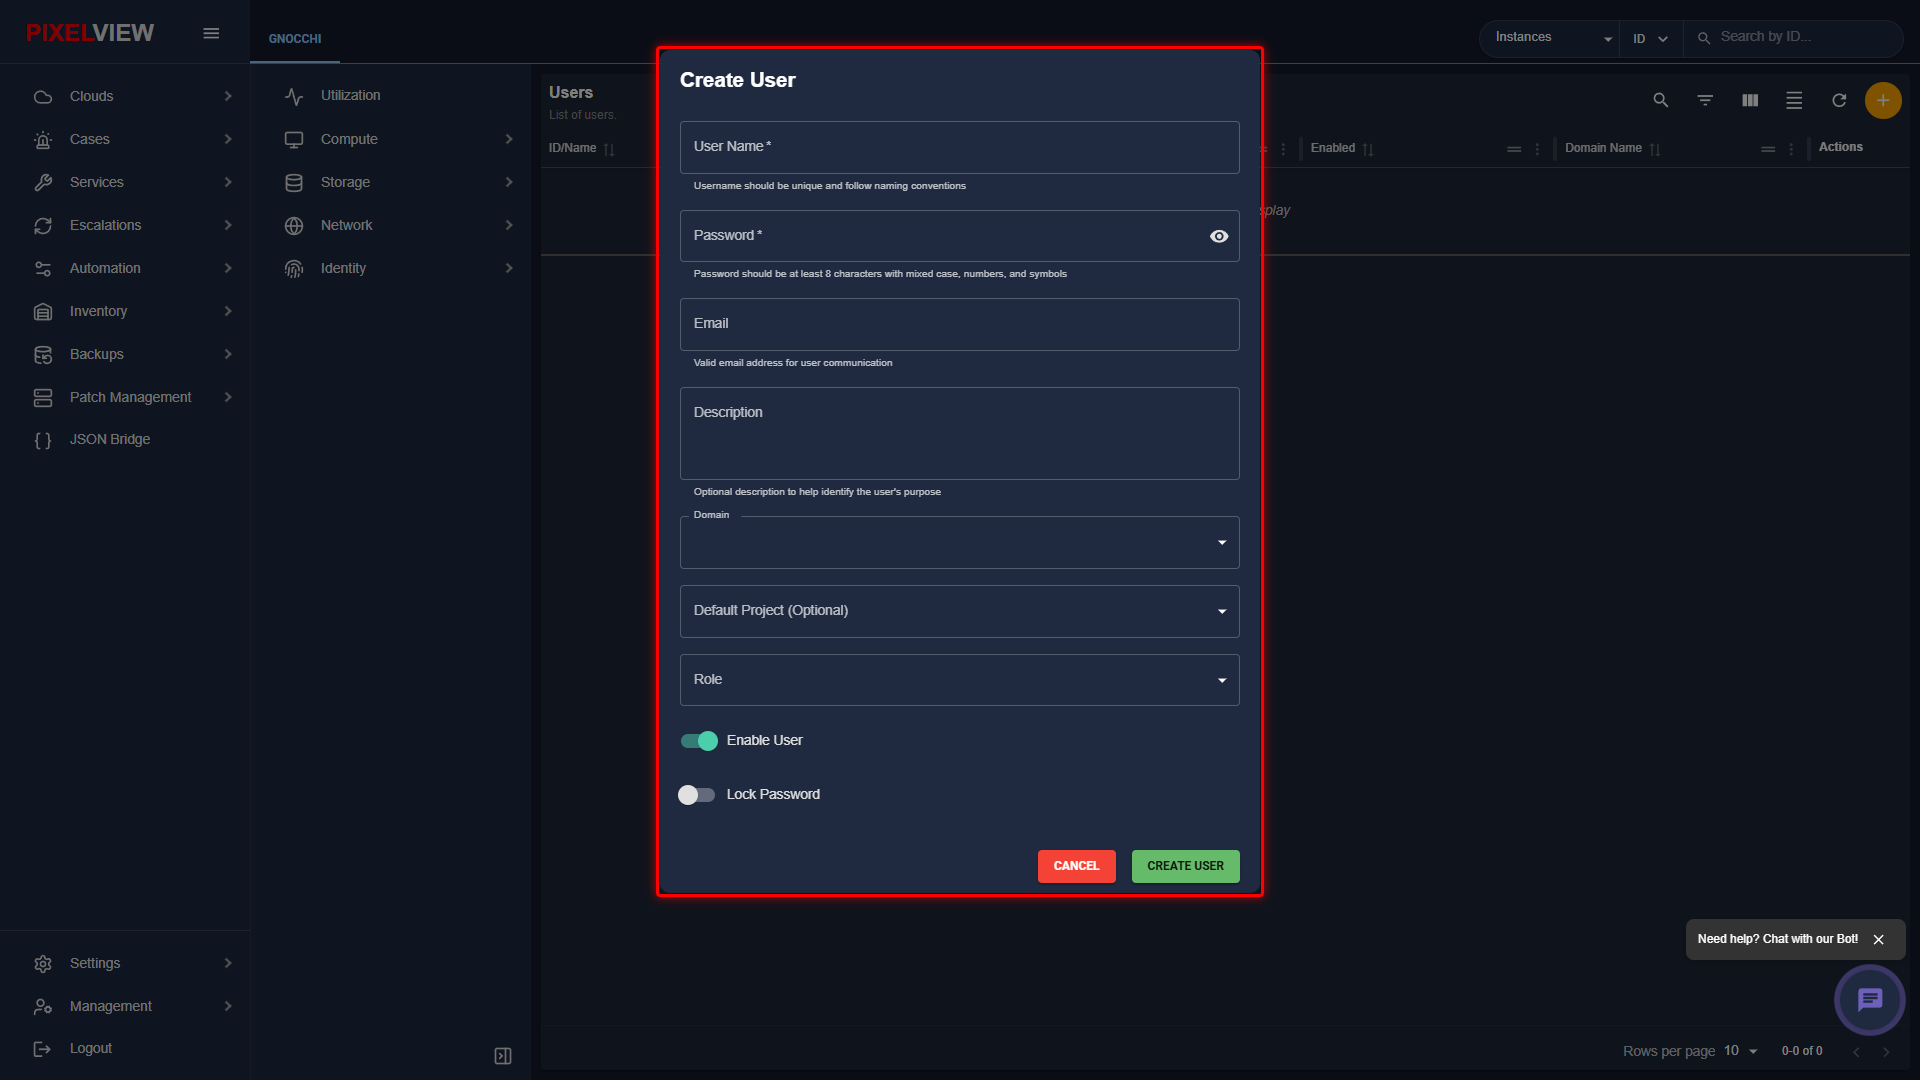
| Parameter | Type | Description |
|---|---|---|
| User Name | Required Text | Unique username for dashboard login and API authentication. |
| Password | Required Password | Initial password (minimum 8 characters with mixed case, numbers, and symbols). |
| Optional Email | Valid email address for notifications and account verification. | |
| Description | Optional Text | Organizational title, role, or team affiliation notes. |
| Domain | Dropdown | Keystone domain holding user credentials (default: Default). |
| Default Project (Optional) | Dropdown | Initial tenant project context selected upon login. |
| Role | Dropdown | Global RBAC role assigned to the user (e.g., admin, member, reader). |
| Enable User | Toggle Switch | Activates or temporarily deactivates login privileges. |
| Lock Password | Toggle Switch | Prevents user from altering password without administrator elevation. |
Groups
Groups Table Overview
Navigate to Identity → Groups in the secondary sidebar:
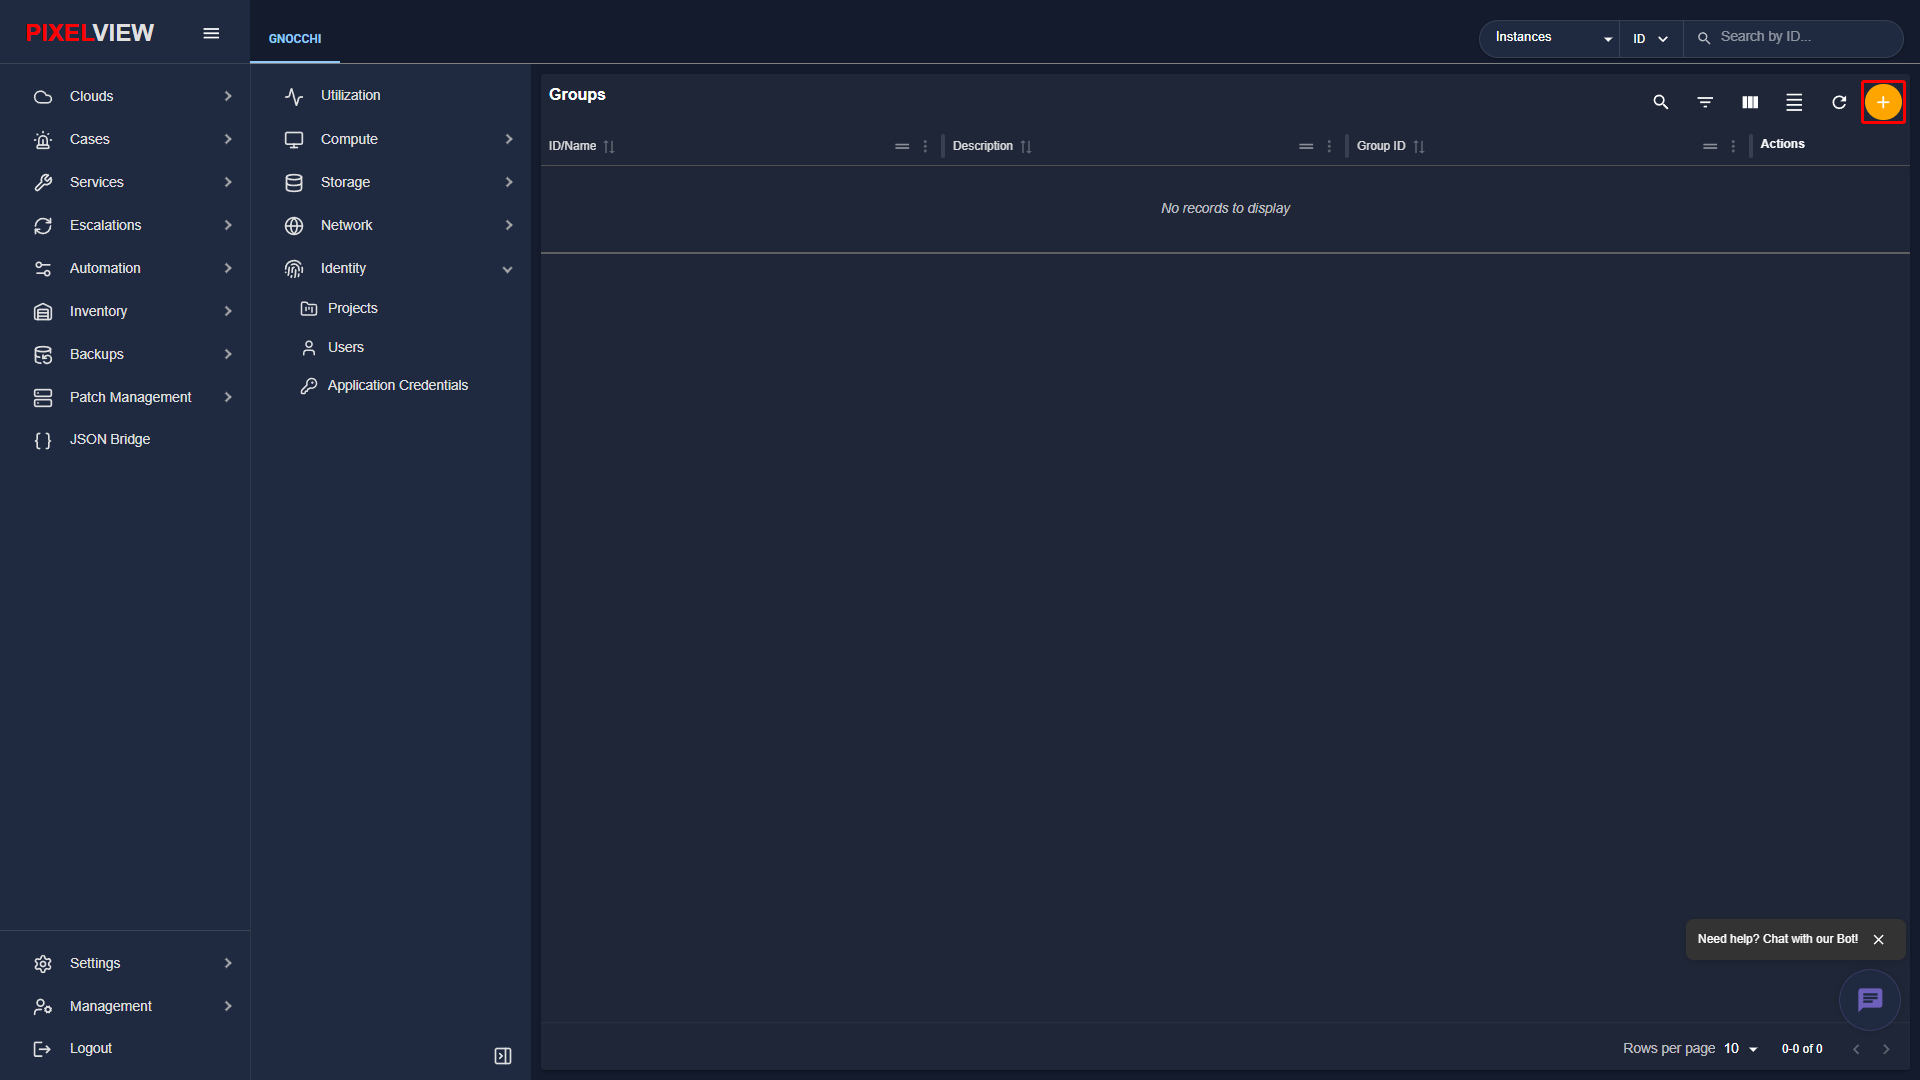
| Column | Description |
|---|---|
| ID / Name | Group name (e.g., administrators, devops, auditors) and UUID. |
| Description | Functional purpose and security scope. |
| Domain | Owning Keystone domain. |
| Actions | Add/remove users from group, assign group-level project roles, or delete. |
Creating a Group
To configure a user permission group:
* Click the orange + (Create Group) button in the upper right toolbar:
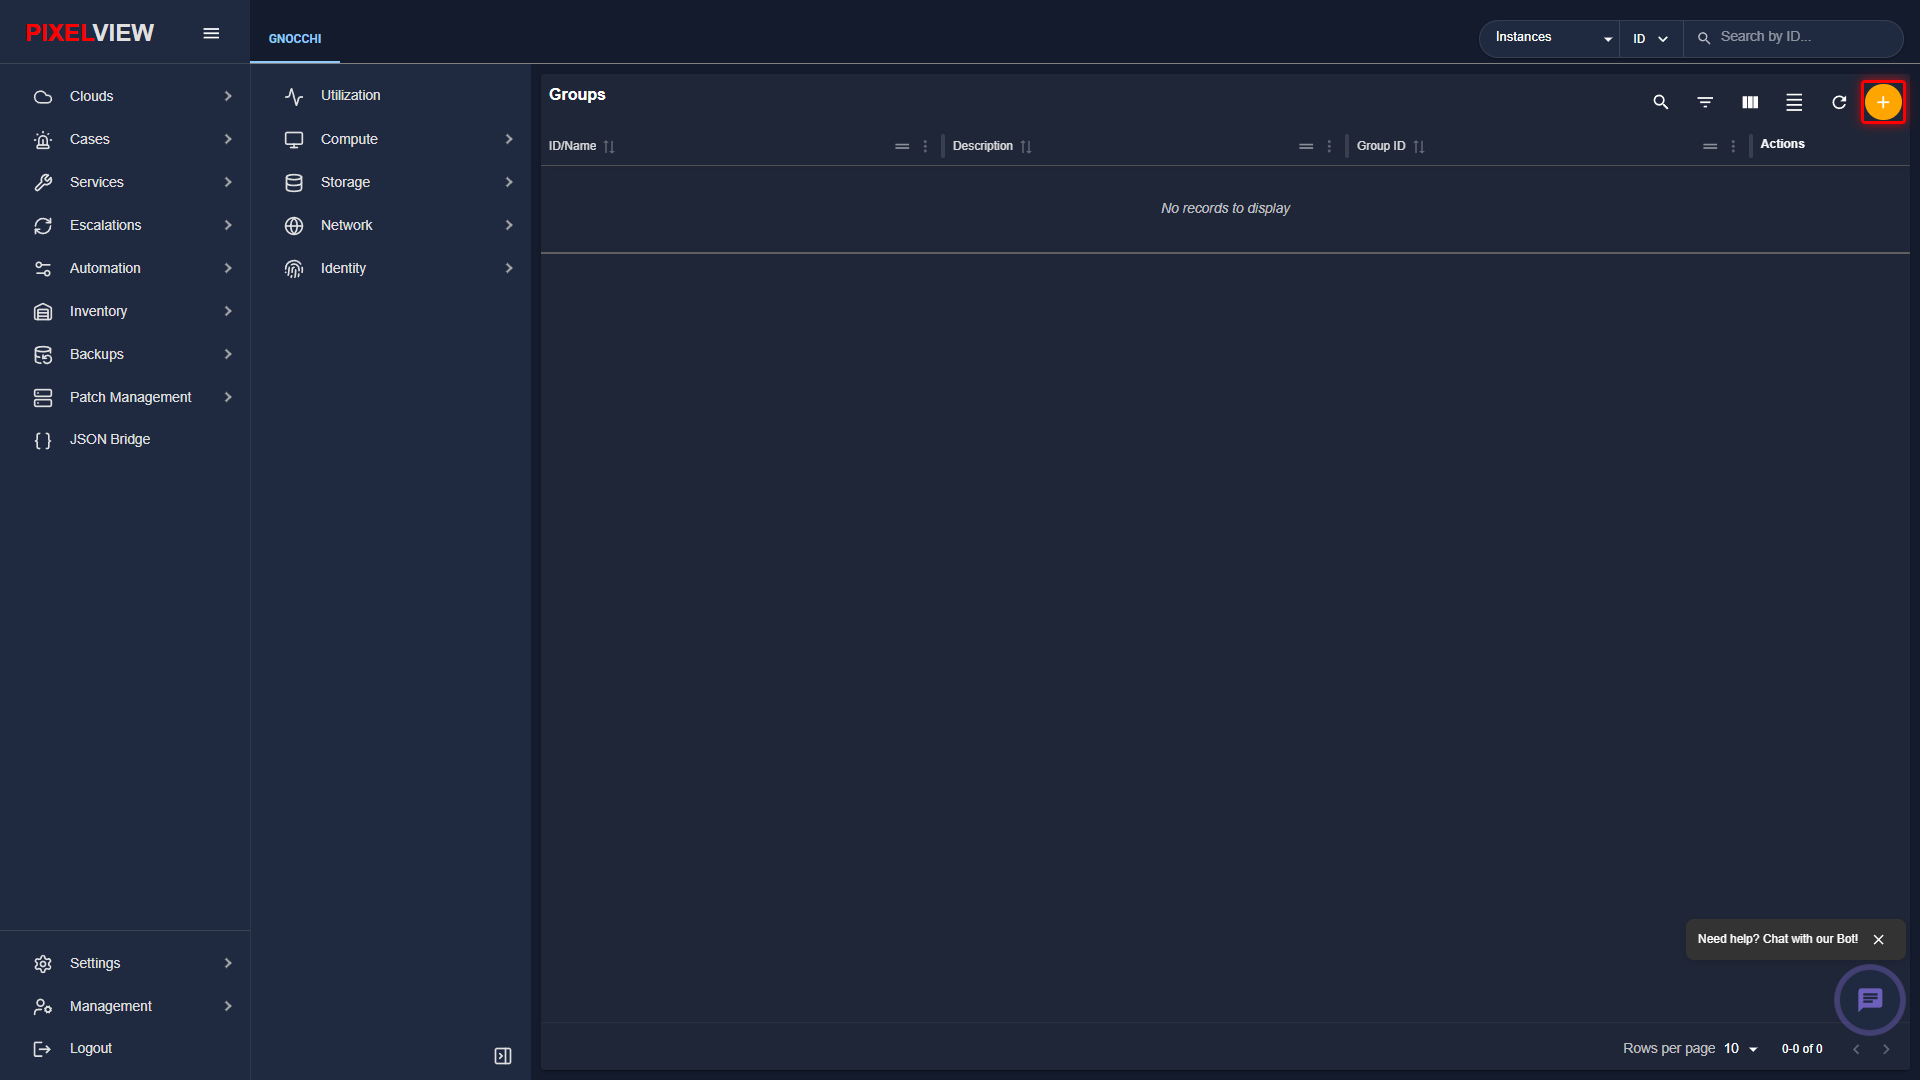
- The Create Group modal dialog opens:
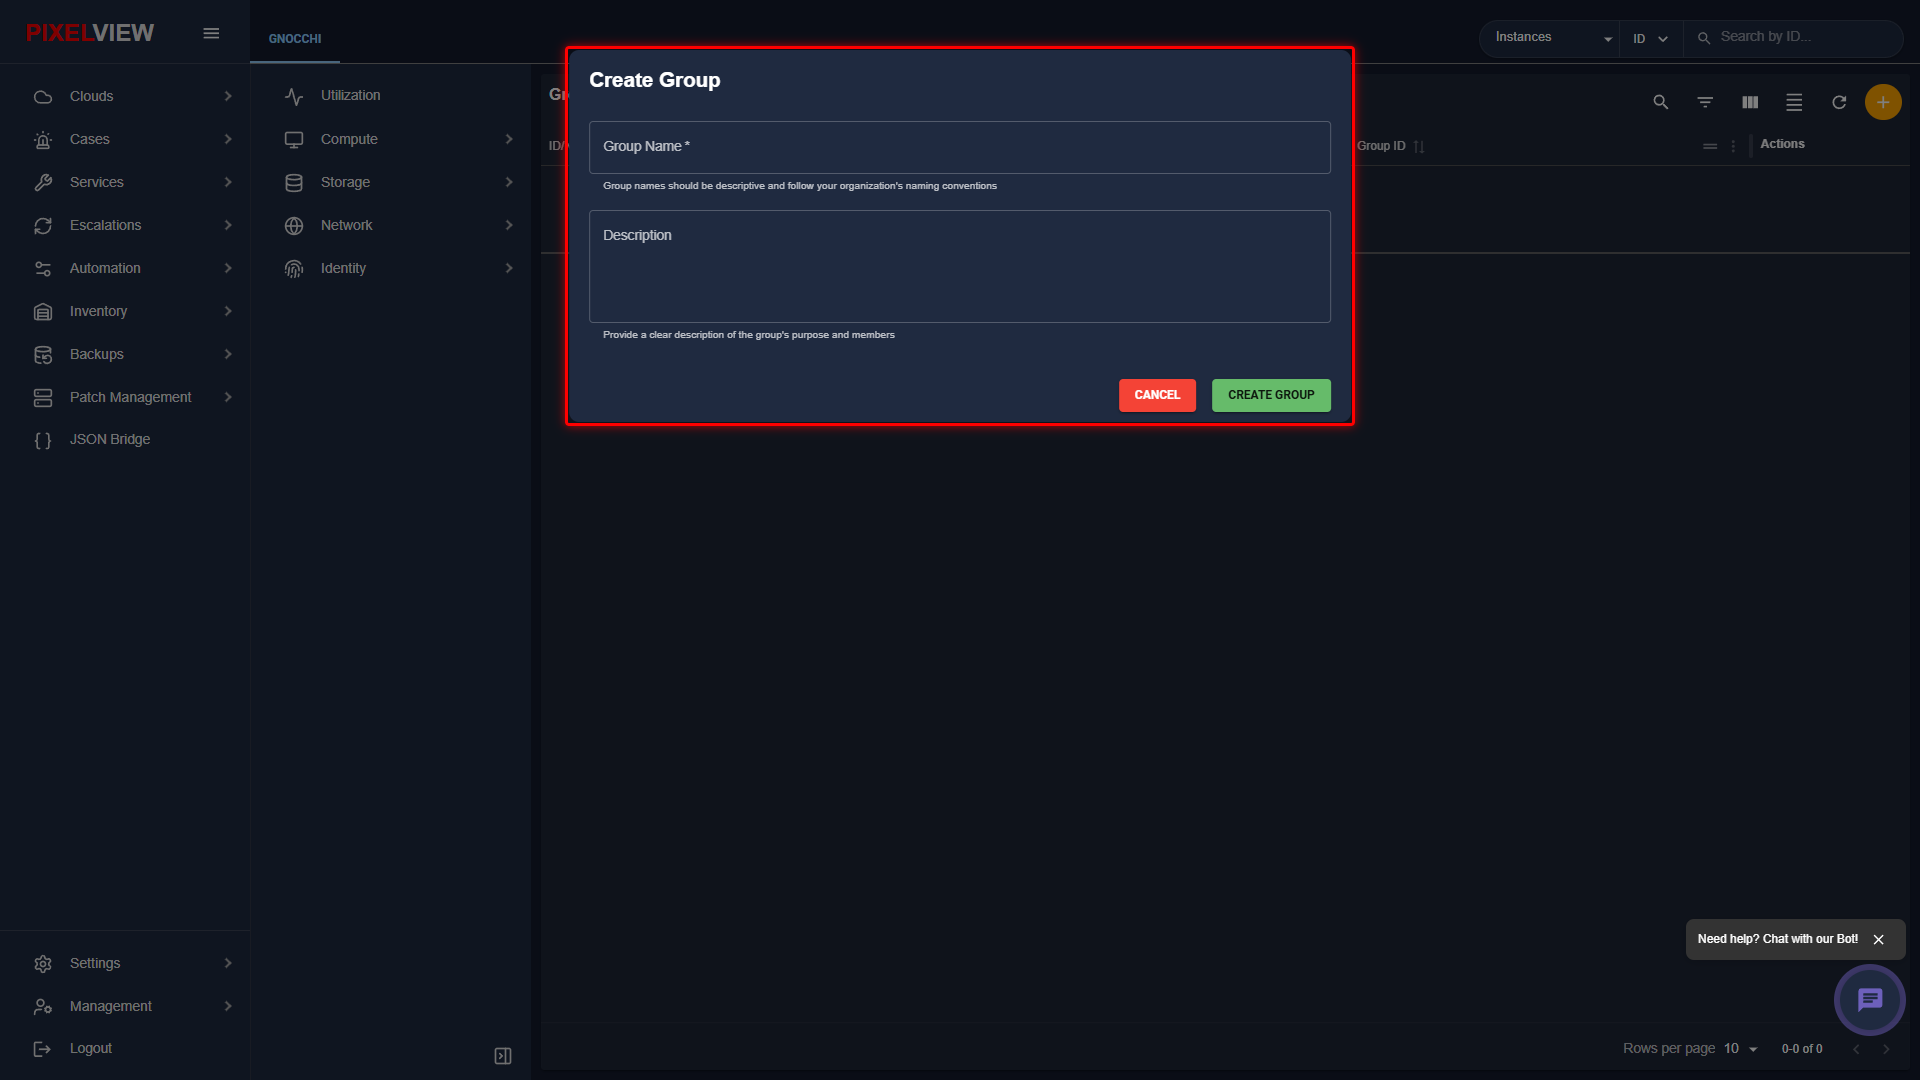
| Parameter | Type | Description |
|---|---|---|
| Group Name | Required Text | Name identifying the security group (e.g., platform-engineers, security-auditors). |
| Description | Optional Text | Functional purpose and scope of permissions granted to members. |
Application Credentials
Application credentials allow automated systems, CI/CD pipelines, and SDK scripts to authenticate against OpenStack APIs without exposing user passwords.
Application Credentials Table Overview
Navigate to Identity → Application Credentials in the secondary sidebar:
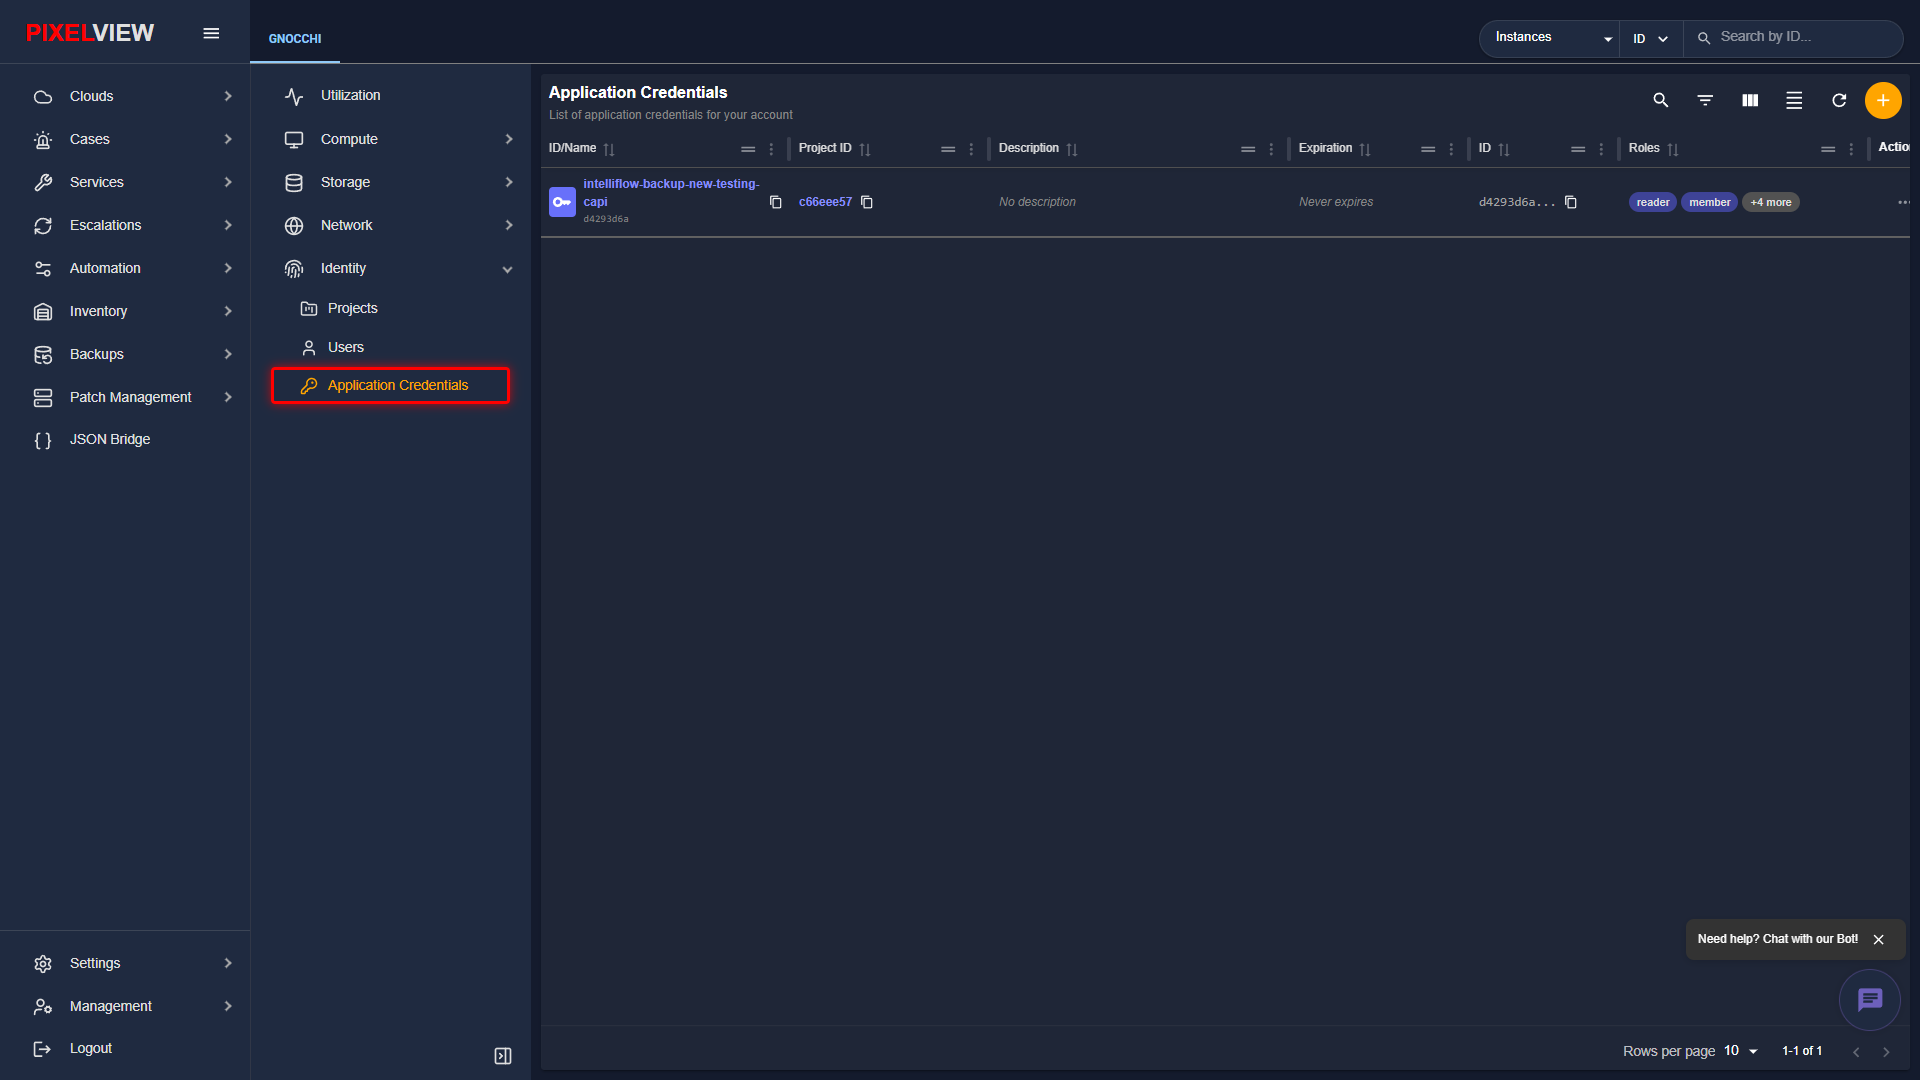
| Column | Description |
|---|---|
| ID / Name | Credential label (e.g., terraform-provisioner, k8s-cloud-provider) and UUID. |
| Project | Scoped project boundary for API authorization. |
| Description | System purpose and expiration tracking. |
| Expiration | Expiry date/time or Unrestricted. |
| Roles | Whitelist of RBAC permissions granted to the API token (member, reader). |
| Actions | Download clouds.yaml configuration or revoke credential token. |
Creating an Application Credential
To generate an automated API authentication token:
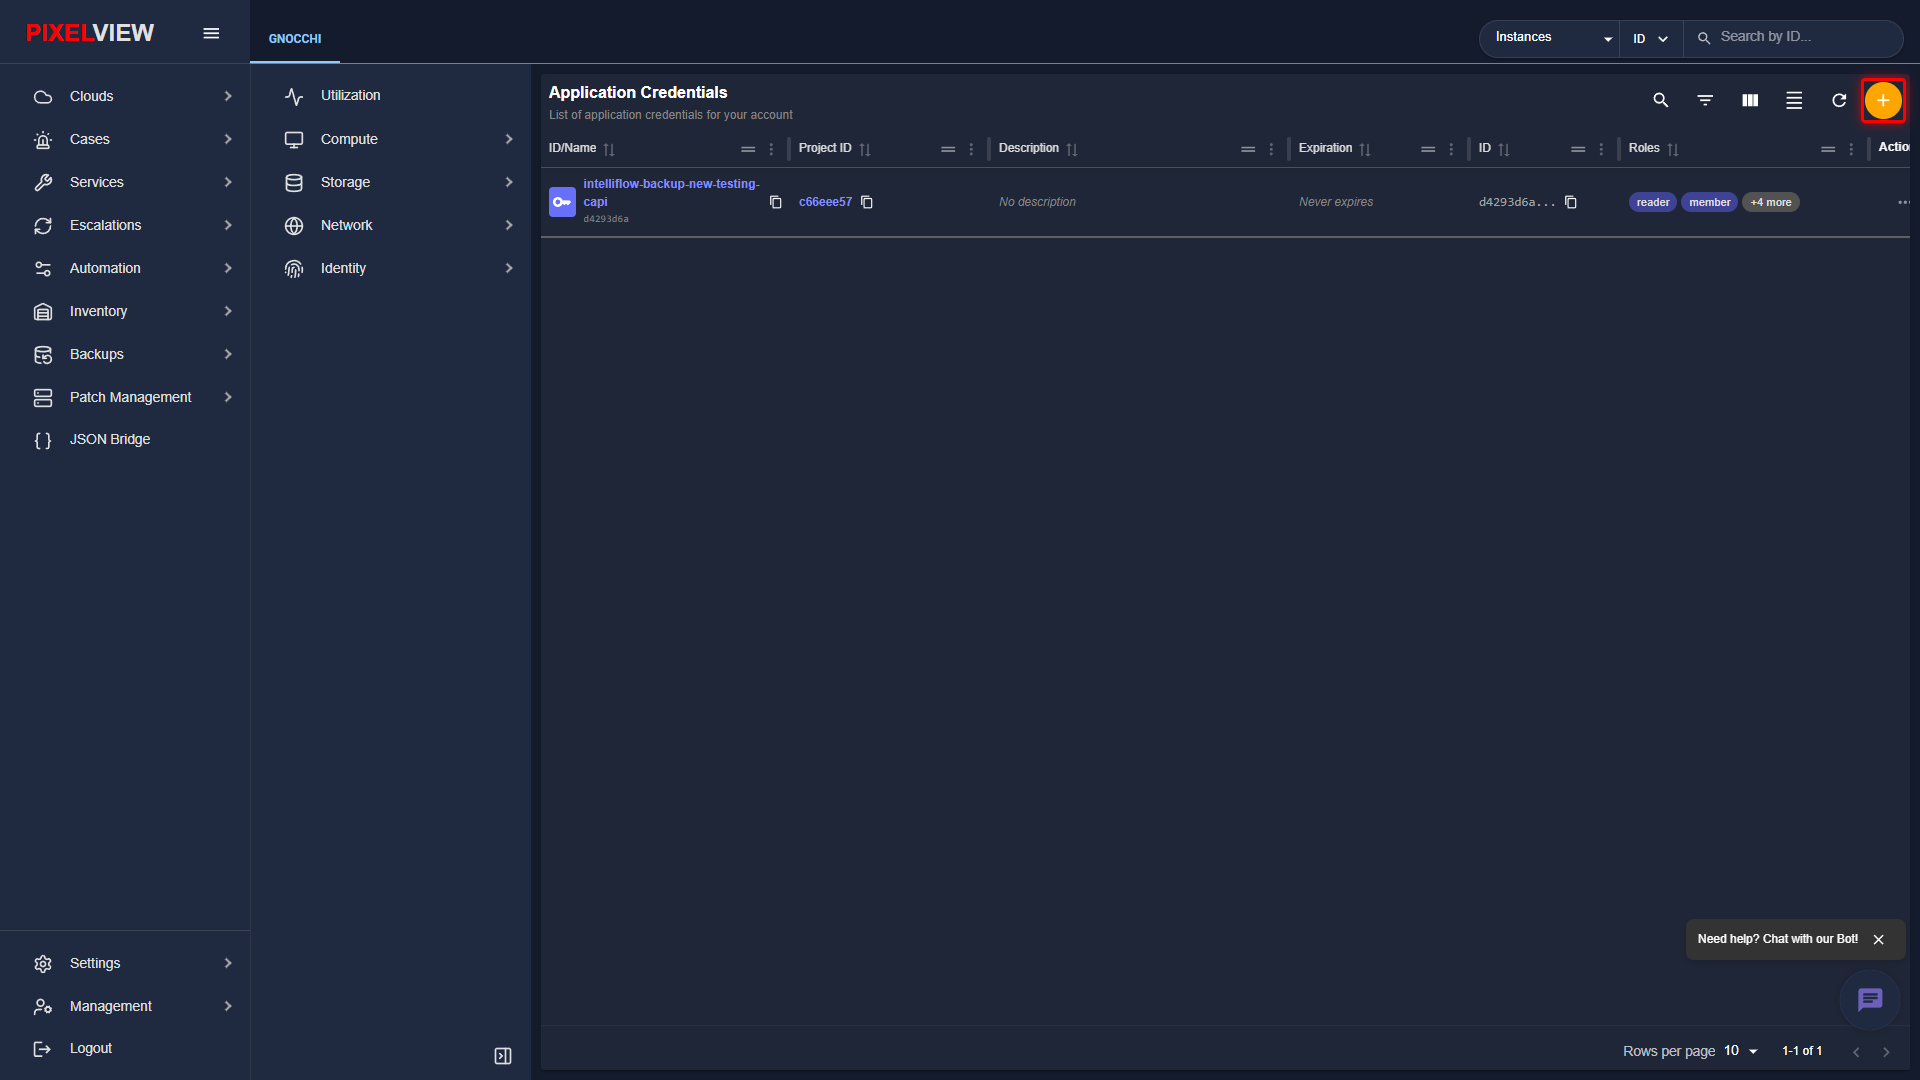
* Click the orange + (Create Application Credential) button in the upper right toolbar:
- The Create Application Credential modal dialog opens:
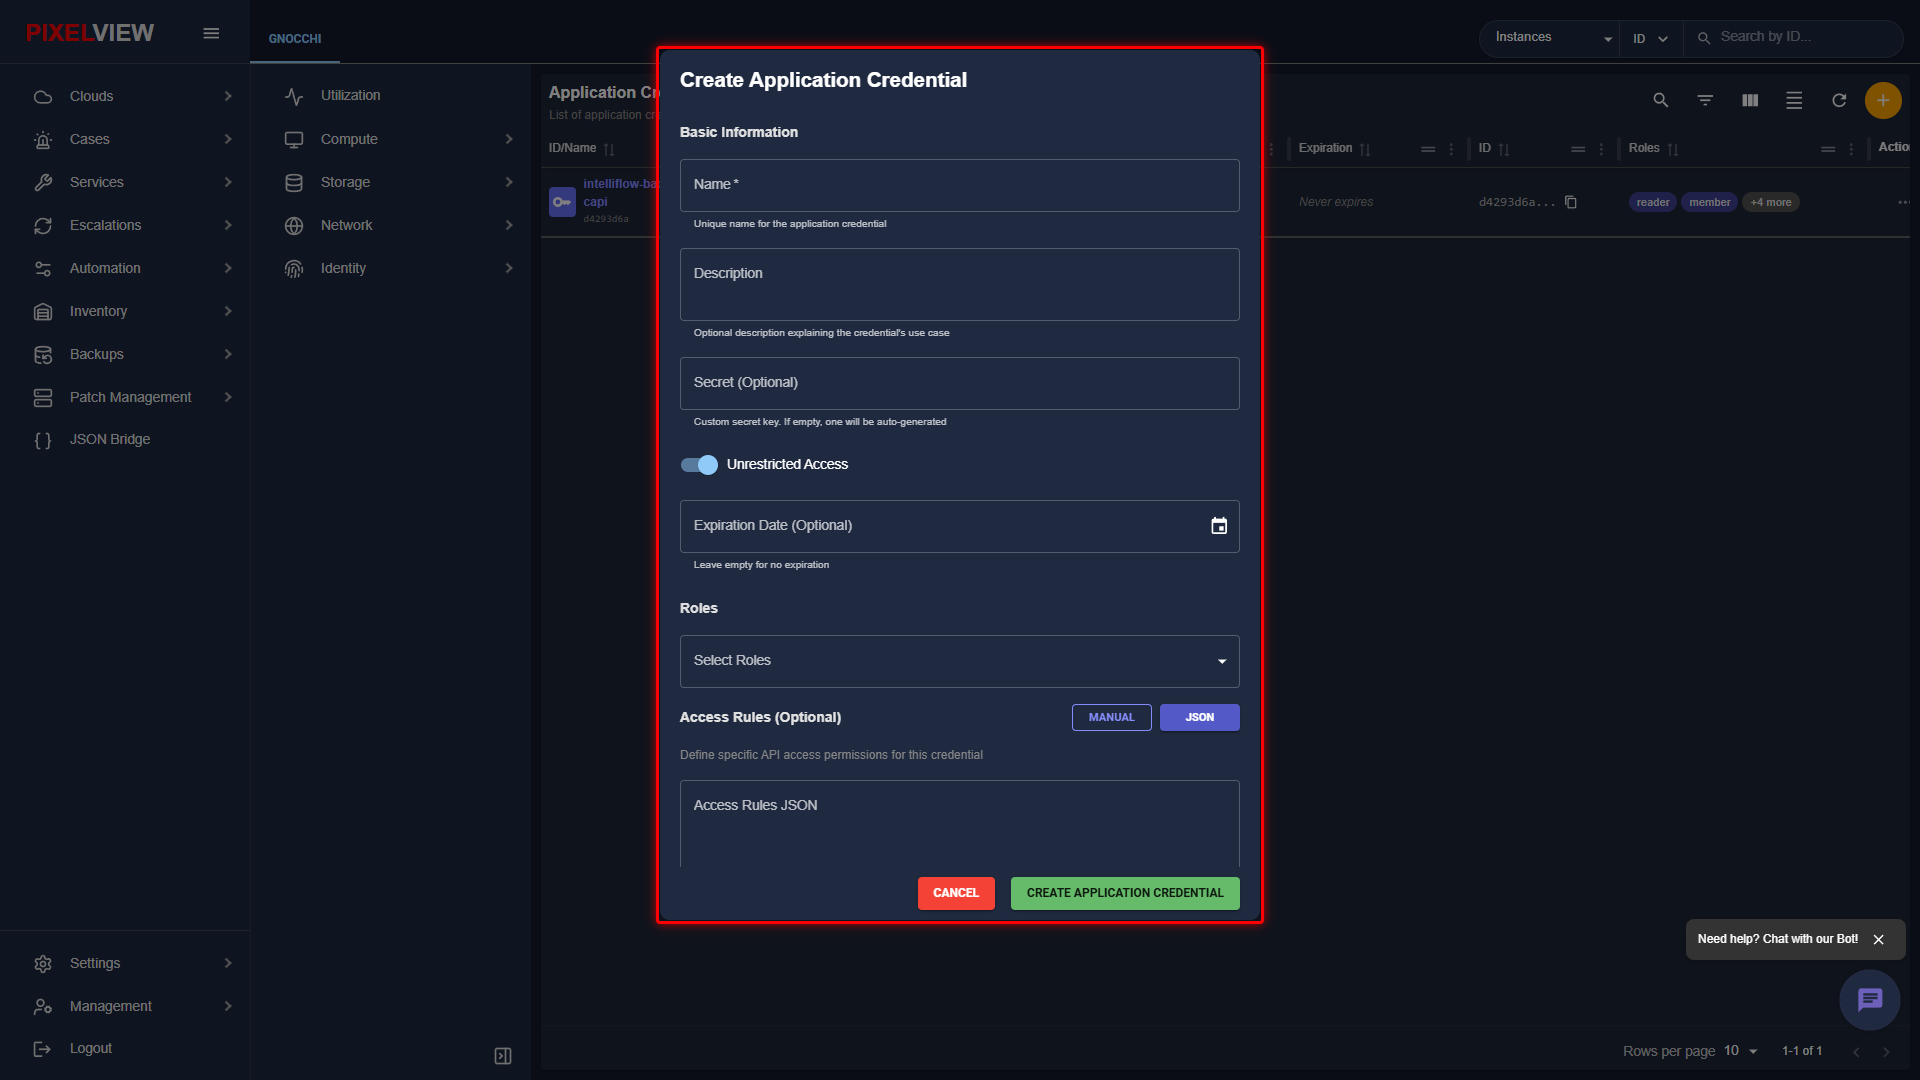
| Parameter | Type | Description |
|---|---|---|
| Name | Required Text | Unique label for the credential (e.g., terraform-runner, k8s-ccm). |
| Description | Optional Text | Pipeline or system daemon explanation. |
| Secret (Optional) | Password Text | Custom API secret token (leave blank to auto-generate a secure random secret). |
| Unrestricted Access | Toggle Switch | When disabled, restricts the credential to explicitly listed role boundaries. |
| Expiration Date (Optional) | Date Picker | Specific calendar expiration cutoff or indefinite access. |
| Roles | Multi-Select Dropdown | Whitelist of RBAC permissions authorized for this credential token. |
| Access Rules (Optional) | JSON / Manual Editor | Fine-grained API path and method limitations (e.g., allow GET /v2.0/networks only). |
Operational Best Practices & Troubleshooting
Common Operational Patterns
- Cross-Zone High Availability: When spinning up redundant database or application clusters, always assign instances to an Anti-Affinity Server Group to ensure physical hardware separation across hypervisors.
- Floating IP Lifecycle: Disassociate and release unused floating IPs back to public pools promptly to prevent IPv4 exhaustion and avoid unnecessary billing costs.
- Storage Sizing: Use high-performance NVMe volume types for I/O-intensive workloads (e.g., PostgreSQL, Elasticsearch) and standard volumes for general storage.
- Monitor Network Topology: Periodically inspect the Interactive Network Topology to identify disconnected ports, orphaned floating IPs, and router bottlenecks.
Troubleshooting Common States
| State / Symptom | Probable Cause | Recommended Resolution |
|---|---|---|
Instance in ERROR State |
Hypervisor out of compute capacity, flavor sizing exceeds quota, or host scheduling failure. | Review instance console logs via Actions → Open Web Console. Verify quota limits under regional settings. |
Volume in error_extending |
Backend Cinder Ceph pool out of physical storage capacity. | Check storage backend pool health. Ensure target storage volume size is supported. |
| Cannot Reach Instance via Floating IP | Security Group lacks inbound rule, or instance guest OS firewall is active. | Verify security group has an Ingress rule permitting TCP port 22 (SSH) or 3389 (RDP) from client CIDR. Verify instance default gateway routes through router interface. |
Load Balancer OFFLINE |
Backend pool members failed health monitor probes or listener port misconfigured. | Inspect Health Monitor timeout and interval settings. Verify member compute instances are answering HTTP/TCP checks on target port. |
Diagnostic Workflow for NoValidHost Scheduling Failures
When an instance provisioning or resize operation fails with NoValidHost (HTTP 500 / No valid host was found):
* Identify Active Scheduler Filters:
* Nova scheduler filters candidate hypervisors sequentially. Review which filter eliminated the hosts:
* AvailabilityZoneFilter: Verify that active compute nodes exist in the selected Availability Zone.
* RamFilter & DiskFilter: Inspect hypervisor free memory and local storage. If memory overcommit ceiling is reached, the host is excluded.
* ComputeFilter: Ensure compute services (nova-compute) are in enabled and up state.
* ImagePropertiesFilter: Check if the image specifies architecture constraints (e.g., hw_machine_type=q35, hw_cpu_policy=dedicated) that hypervisors do not advertise.
* Inspect Placement API Allocation State:
* In the PixelView console, check regional quota utilization under Utilization to ensure vCPU, RAM, and instance counts have not exceeded the project ceiling.
Diagnostic Workflow for Storage Volumes Stuck in Attaching or Detaching State
When a Cinder volume becomes stuck in an intermediate state (attaching or detaching):
* Identify Stale Attachment Records:
* In Storage → Volumes, select the volume and inspect the Attached To field to identify the hypervisor host and instance ID.
* Inspect Nova and Cinder Attachment Mismatch:
* If the volume is detached in Nova but still marked in-use or detaching in Cinder, use the instance Actions menu to trigger an attachment state refresh.
* If necessary, use PixelView automation or the OpenStack CLI to reset the volume state to available once confirmed unmounted from the guest OS:
Hypervisor Maintenance & Live Evacuation Runbook
When performing physical host hardware maintenance, kernel upgrades, or RAM replacement: * Disable Compute Scheduling: * Prevent new workloads from landing on the hypervisor by disabling the compute service:
openstack compute service set --disable --disable-reason "Hardware Maintenance" <hypervisor_hostname> nova-compute
live_migration_block_migration=auto).
* Evacuate Remaining Compute Workloads:
* If the hypervisor suffered an unexpected hardware failure, execute instance evacuation to restore instances on healthy hypervisors from remote Cinder boot volumes.